Lee's Summit, Missouri Submit your own pictures of this city and show them to the world
OSM Map
General Map
Google Map
MSN Map
OSM Map
General Map
Google Map
MSN Map
OSM Map
General Map
Google Map
MSN Map
OSM Map
General Map
Google Map
MSN Map
Please wait while loading the map...
Population in 2022: 103,465 (98% urban, 2% rural). Population change since 2000: +46.3%Males: 52,164 Females: 51,301
March 2022 cost of living index in Lee's Summit: 87.5 (less than average, U.S. average is 100) Percentage of residents living in poverty in 2022: 6.0%for White Non-Hispanic residents , 15.3% for Black residents , 4.5% for Hispanic or Latino residents , 5.7% for American Indian residents , 4.3% for other race residents , 6.0% for two or more races residents )
Profiles of local businesses
Business Search - 14 Million verified businesses
Data:
Median household income ($)
Median household income (% change since 2000)
Household income diversity
Ratio of average income to average house value (%)
Ratio of average income to average rent
Median household income ($) - White
Median household income ($) - Black or African American
Median household income ($) - Asian
Median household income ($) - Hispanic or Latino
Median household income ($) - American Indian and Alaska Native
Median household income ($) - Multirace
Median household income ($) - Other Race
Median household income for houses/condos with a mortgage ($)
Median household income for apartments without a mortgage ($)
Races - White alone (%)
Races - White alone (% change since 2000)
Races - Black alone (%)
Races - Black alone (% change since 2000)
Races - American Indian alone (%)
Races - American Indian alone (% change since 2000)
Races - Asian alone (%)
Races - Asian alone (% change since 2000)
Races - Hispanic (%)
Races - Hispanic (% change since 2000)
Races - Native Hawaiian and Other Pacific Islander alone (%)
Races - Native Hawaiian and Other Pacific Islander alone (% change since 2000)
Races - Two or more races (%)
Races - Two or more races (% change since 2000)
Races - Other race alone (%)
Races - Other race alone (% change since 2000)
Racial diversity
Unemployment (%)
Unemployment (% change since 2000)
Unemployment (%) - White
Unemployment (%) - Black or African American
Unemployment (%) - Asian
Unemployment (%) - Hispanic or Latino
Unemployment (%) - American Indian and Alaska Native
Unemployment (%) - Multirace
Unemployment (%) - Other Race
Population density (people per square mile)
Population - Males (%)
Population - Females (%)
Population - Males (%) - White
Population - Males (%) - Black or African American
Population - Males (%) - Asian
Population - Males (%) - Hispanic or Latino
Population - Males (%) - American Indian and Alaska Native
Population - Males (%) - Multirace
Population - Males (%) - Other Race
Population - Females (%) - White
Population - Females (%) - Black or African American
Population - Females (%) - Asian
Population - Females (%) - Hispanic or Latino
Population - Females (%) - American Indian and Alaska Native
Population - Females (%) - Multirace
Population - Females (%) - Other Race
Coronavirus confirmed cases (Apr 29, 2024)
Deaths caused by coronavirus (Apr 29, 2024)
Coronavirus confirmed cases (per 100k population) (Apr 29, 2024)
Deaths caused by coronavirus (per 100k population) (Apr 29, 2024)
Daily increase in number of cases (Apr 29, 2024)
Weekly increase in number of cases (Apr 29, 2024)
Cases doubled (in days) (Apr 29, 2024)
Hospitalized patients (Apr 18, 2022)
Negative test results (Apr 18, 2022)
Total test results (Apr 18, 2022)
COVID Vaccine doses distributed (per 100k population) (Sep 19, 2023)
COVID Vaccine doses administered (per 100k population) (Sep 19, 2023)
COVID Vaccine doses distributed (Sep 19, 2023)
COVID Vaccine doses administered (Sep 19, 2023)
Likely homosexual households (%)
Likely homosexual households (% change since 2000)
Likely homosexual households - Lesbian couples (%)
Likely homosexual households - Lesbian couples (% change since 2000)
Likely homosexual households - Gay men (%)
Likely homosexual households - Gay men (% change since 2000)
Cost of living index
Median gross rent ($)
Median contract rent ($)
Median monthly housing costs ($)
Median house or condo value ($)
Median house or condo value ($ change since 2000)
Mean house or condo value by units in structure - 1, detached ($)
Mean house or condo value by units in structure - 1, attached ($)
Mean house or condo value by units in structure - 2 ($)
Mean house or condo value by units in structure by units in structure - 3 or 4 ($)
Mean house or condo value by units in structure - 5 or more ($)
Mean house or condo value by units in structure - Boat, RV, van, etc. ($)
Mean house or condo value by units in structure - Mobile home ($)
Median house or condo value ($) - White
Median house or condo value ($) - Black or African American
Median house or condo value ($) - Asian
Median house or condo value ($) - Hispanic or Latino
Median house or condo value ($) - American Indian and Alaska Native
Median house or condo value ($) - Multirace
Median house or condo value ($) - Other Race
Median resident age
Resident age diversity
Median resident age - Males
Median resident age - Females
Median resident age - White
Median resident age - Black or African American
Median resident age - Asian
Median resident age - Hispanic or Latino
Median resident age - American Indian and Alaska Native
Median resident age - Multirace
Median resident age - Other Race
Median resident age - Males - White
Median resident age - Males - Black or African American
Median resident age - Males - Asian
Median resident age - Males - Hispanic or Latino
Median resident age - Males - American Indian and Alaska Native
Median resident age - Males - Multirace
Median resident age - Males - Other Race
Median resident age - Females - White
Median resident age - Females - Black or African American
Median resident age - Females - Asian
Median resident age - Females - Hispanic or Latino
Median resident age - Females - American Indian and Alaska Native
Median resident age - Females - Multirace
Median resident age - Females - Other Race
Commute - mean travel time to work (minutes)
Travel time to work - Less than 5 minutes (%)
Travel time to work - Less than 5 minutes (% change since 2000)
Travel time to work - 5 to 9 minutes (%)
Travel time to work - 5 to 9 minutes (% change since 2000)
Travel time to work - 10 to 19 minutes (%)
Travel time to work - 10 to 19 minutes (% change since 2000)
Travel time to work - 20 to 29 minutes (%)
Travel time to work - 20 to 29 minutes (% change since 2000)
Travel time to work - 30 to 39 minutes (%)
Travel time to work - 30 to 39 minutes (% change since 2000)
Travel time to work - 40 to 59 minutes (%)
Travel time to work - 40 to 59 minutes (% change since 2000)
Travel time to work - 60 to 89 minutes (%)
Travel time to work - 60 to 89 minutes (% change since 2000)
Travel time to work - 90 or more minutes (%)
Travel time to work - 90 or more minutes (% change since 2000)
Marital status - Never married (%)
Marital status - Now married (%)
Marital status - Separated (%)
Marital status - Widowed (%)
Marital status - Divorced (%)
Median family income ($)
Median family income (% change since 2000)
Median non-family income ($)
Median non-family income (% change since 2000)
Median per capita income ($)
Median per capita income (% change since 2000)
Median family income ($) - White
Median family income ($) - Black or African American
Median family income ($) - Asian
Median family income ($) - Hispanic or Latino
Median family income ($) - American Indian and Alaska Native
Median family income ($) - Multirace
Median family income ($) - Other Race
Median year house/condo built
Median year apartment built
Year house built - Built 2005 or later (%)
Year house built - Built 2000 to 2004 (%)
Year house built - Built 1990 to 1999 (%)
Year house built - Built 1980 to 1989 (%)
Year house built - Built 1970 to 1979 (%)
Year house built - Built 1960 to 1969 (%)
Year house built - Built 1950 to 1959 (%)
Year house built - Built 1940 to 1949 (%)
Year house built - Built 1939 or earlier (%)
Average household size
Household density (households per square mile)
Average household size - White
Average household size - Black or African American
Average household size - Asian
Average household size - Hispanic or Latino
Average household size - American Indian and Alaska Native
Average household size - Multirace
Average household size - Other Race
Occupied housing units (%)
Vacant housing units (%)
Owner occupied housing units (%)
Renter occupied housing units (%)
Vacancy status - For rent (%)
Vacancy status - For sale only (%)
Vacancy status - Rented or sold, not occupied (%)
Vacancy status - For seasonal, recreational, or occasional use (%)
Vacancy status - For migrant workers (%)
Vacancy status - Other vacant (%)
Residents with income below the poverty level (%)
Residents with income below 50% of the poverty level (%)
Children below poverty level (%)
Poor families by family type - Married-couple family (%)
Poor families by family type - Male, no wife present (%)
Poor families by family type - Female, no husband present (%)
Poverty status for native-born residents (%)
Poverty status for foreign-born residents (%)
Poverty among high school graduates not in families (%)
Poverty among people who did not graduate high school not in families (%)
Residents with income below the poverty level (%) - White
Residents with income below the poverty level (%) - Black or African American
Residents with income below the poverty level (%) - Asian
Residents with income below the poverty level (%) - Hispanic or Latino
Residents with income below the poverty level (%) - American Indian and Alaska Native
Residents with income below the poverty level (%) - Multirace
Residents with income below the poverty level (%) - Other Race
Air pollution - Air Quality Index (AQI)
Air pollution - CO
Air pollution - NO2
Air pollution - SO2
Air pollution - Ozone
Air pollution - PM10
Air pollution - PM25
Air pollution - Pb
Crime - Murders per 100,000 population
Crime - Rapes per 100,000 population
Crime - Robberies per 100,000 population
Crime - Assaults per 100,000 population
Crime - Burglaries per 100,000 population
Crime - Thefts per 100,000 population
Crime - Auto thefts per 100,000 population
Crime - Arson per 100,000 population
Crime - City-data.com crime index
Crime - Violent crime index
Crime - Property crime index
Crime - Murders per 100,000 population (5 year average)
Crime - Rapes per 100,000 population (5 year average)
Crime - Robberies per 100,000 population (5 year average)
Crime - Assaults per 100,000 population (5 year average)
Crime - Burglaries per 100,000 population (5 year average)
Crime - Thefts per 100,000 population (5 year average)
Crime - Auto thefts per 100,000 population (5 year average)
Crime - Arson per 100,000 population (5 year average)
Crime - City-data.com crime index (5 year average)
Crime - Violent crime index (5 year average)
Crime - Property crime index (5 year average)
1996 Presidential Elections Results (%) - Democratic Party (Clinton)
1996 Presidential Elections Results (%) - Republican Party (Dole)
1996 Presidential Elections Results (%) - Other
2000 Presidential Elections Results (%) - Democratic Party (Gore)
2000 Presidential Elections Results (%) - Republican Party (Bush)
2000 Presidential Elections Results (%) - Other
2004 Presidential Elections Results (%) - Democratic Party (Kerry)
2004 Presidential Elections Results (%) - Republican Party (Bush)
2004 Presidential Elections Results (%) - Other
2008 Presidential Elections Results (%) - Democratic Party (Obama)
2008 Presidential Elections Results (%) - Republican Party (McCain)
2008 Presidential Elections Results (%) - Other
2012 Presidential Elections Results (%) - Democratic Party (Obama)
2012 Presidential Elections Results (%) - Republican Party (Romney)
2012 Presidential Elections Results (%) - Other
2016 Presidential Elections Results (%) - Democratic Party (Clinton)
2016 Presidential Elections Results (%) - Republican Party (Trump)
2016 Presidential Elections Results (%) - Other
2020 Presidential Elections Results (%) - Democratic Party (Biden)
2020 Presidential Elections Results (%) - Republican Party (Trump)
2020 Presidential Elections Results (%) - Other
Ancestries Reported - Arab (%)
Ancestries Reported - Czech (%)
Ancestries Reported - Danish (%)
Ancestries Reported - Dutch (%)
Ancestries Reported - English (%)
Ancestries Reported - French (%)
Ancestries Reported - French Canadian (%)
Ancestries Reported - German (%)
Ancestries Reported - Greek (%)
Ancestries Reported - Hungarian (%)
Ancestries Reported - Irish (%)
Ancestries Reported - Italian (%)
Ancestries Reported - Lithuanian (%)
Ancestries Reported - Norwegian (%)
Ancestries Reported - Polish (%)
Ancestries Reported - Portuguese (%)
Ancestries Reported - Russian (%)
Ancestries Reported - Scotch-Irish (%)
Ancestries Reported - Scottish (%)
Ancestries Reported - Slovak (%)
Ancestries Reported - Subsaharan African (%)
Ancestries Reported - Swedish (%)
Ancestries Reported - Swiss (%)
Ancestries Reported - Ukrainian (%)
Ancestries Reported - United States (%)
Ancestries Reported - Welsh (%)
Ancestries Reported - West Indian (%)
Ancestries Reported - Other (%)
Educational Attainment - No schooling completed (%)
Educational Attainment - Less than high school (%)
Educational Attainment - High school or equivalent (%)
Educational Attainment - Less than 1 year of college (%)
Educational Attainment - 1 or more years of college (%)
Educational Attainment - Associate degree (%)
Educational Attainment - Bachelor's degree (%)
Educational Attainment - Master's degree (%)
Educational Attainment - Professional school degree (%)
Educational Attainment - Doctorate degree (%)
School Enrollment - Nursery, preschool (%)
School Enrollment - Kindergarten (%)
School Enrollment - Grade 1 to 4 (%)
School Enrollment - Grade 5 to 8 (%)
School Enrollment - Grade 9 to 12 (%)
School Enrollment - College undergrad (%)
School Enrollment - Graduate or professional (%)
School Enrollment - Not enrolled in school (%)
School enrollment - Public schools (%)
School enrollment - Private schools (%)
School enrollment - Not enrolled (%)
Median number of rooms in houses and condos
Median number of rooms in apartments
Housing units lacking complete plumbing facilities (%)
Housing units lacking complete kitchen facilities (%)
Density of houses
Urban houses (%)
Rural houses (%)
Households with people 60 years and over (%)
Households with people 65 years and over (%)
Households with people 75 years and over (%)
Households with one or more nonrelatives (%)
Households with no nonrelatives (%)
Population in households (%)
Family households (%)
Nonfamily households (%)
Population in families (%)
Family households with own children (%)
Median number of bedrooms in owner occupied houses
Mean number of bedrooms in owner occupied houses
Median number of bedrooms in renter occupied houses
Mean number of bedrooms in renter occupied houses
Median number of vehichles in owner occupied houses
Mean number of vehichles in owner occupied houses
Median number of vehichles in renter occupied houses
Mean number of vehichles in renter occupied houses
Mortgage status - with mortgage (%)
Mortgage status - with second mortgage (%)
Mortgage status - with home equity loan (%)
Mortgage status - with both second mortgage and home equity loan (%)
Mortgage status - without a mortgage (%)
Average family size
Average family size - White
Average family size - Black or African American
Average family size - Asian
Average family size - Hispanic or Latino
Average family size - American Indian and Alaska Native
Average family size - Multirace
Average family size - Other Race
Geographical mobility - Same house 1 year ago (%)
Geographical mobility - Moved within same county (%)
Geographical mobility - Moved from different county within same state (%)
Geographical mobility - Moved from different state (%)
Geographical mobility - Moved from abroad (%)
Place of birth - Born in state of residence (%)
Place of birth - Born in other state (%)
Place of birth - Native, outside of US (%)
Place of birth - Foreign born (%)
Housing units in structures - 1, detached (%)
Housing units in structures - 1, attached (%)
Housing units in structures - 2 (%)
Housing units in structures - 3 or 4 (%)
Housing units in structures - 5 to 9 (%)
Housing units in structures - 10 to 19 (%)
Housing units in structures - 20 to 49 (%)
Housing units in structures - 50 or more (%)
Housing units in structures - Mobile home (%)
Housing units in structures - Boat, RV, van, etc. (%)
House/condo owner moved in on average (years ago)
Renter moved in on average (years ago)
Year householder moved into unit - Moved in 1999 to March 2000 (%)
Year householder moved into unit - Moved in 1995 to 1998 (%)
Year householder moved into unit - Moved in 1990 to 1994 (%)
Year householder moved into unit - Moved in 1980 to 1989 (%)
Year householder moved into unit - Moved in 1970 to 1979 (%)
Year householder moved into unit - Moved in 1969 or earlier (%)
Means of transportation to work - Drove car alone (%)
Means of transportation to work - Carpooled (%)
Means of transportation to work - Public transportation (%)
Means of transportation to work - Bus or trolley bus (%)
Means of transportation to work - Streetcar or trolley car (%)
Means of transportation to work - Subway or elevated (%)
Means of transportation to work - Railroad (%)
Means of transportation to work - Ferryboat (%)
Means of transportation to work - Taxicab (%)
Means of transportation to work - Motorcycle (%)
Means of transportation to work - Bicycle (%)
Means of transportation to work - Walked (%)
Means of transportation to work - Other means (%)
Working at home (%)
Industry diversity
Most Common Industries - Agriculture, forestry, fishing and hunting, and mining (%)
Most Common Industries - Agriculture, forestry, fishing and hunting (%)
Most Common Industries - Mining, quarrying, and oil and gas extraction (%)
Most Common Industries - Construction (%)
Most Common Industries - Manufacturing (%)
Most Common Industries - Wholesale trade (%)
Most Common Industries - Retail trade (%)
Most Common Industries - Transportation and warehousing, and utilities (%)
Most Common Industries - Transportation and warehousing (%)
Most Common Industries - Utilities (%)
Most Common Industries - Information (%)
Most Common Industries - Finance and insurance, and real estate and rental and leasing (%)
Most Common Industries - Finance and insurance (%)
Most Common Industries - Real estate and rental and leasing (%)
Most Common Industries - Professional, scientific, and management, and administrative and waste management services (%)
Most Common Industries - Professional, scientific, and technical services (%)
Most Common Industries - Management of companies and enterprises (%)
Most Common Industries - Administrative and support and waste management services (%)
Most Common Industries - Educational services, and health care and social assistance (%)
Most Common Industries - Educational services (%)
Most Common Industries - Health care and social assistance (%)
Most Common Industries - Arts, entertainment, and recreation, and accommodation and food services (%)
Most Common Industries - Arts, entertainment, and recreation (%)
Most Common Industries - Accommodation and food services (%)
Most Common Industries - Other services, except public administration (%)
Most Common Industries - Public administration (%)
Occupation diversity
Most Common Occupations - Management, business, science, and arts occupations (%)
Most Common Occupations - Management, business, and financial occupations (%)
Most Common Occupations - Management occupations (%)
Most Common Occupations - Business and financial operations occupations (%)
Most Common Occupations - Computer, engineering, and science occupations (%)
Most Common Occupations - Computer and mathematical occupations (%)
Most Common Occupations - Architecture and engineering occupations (%)
Most Common Occupations - Life, physical, and social science occupations (%)
Most Common Occupations - Education, legal, community service, arts, and media occupations (%)
Most Common Occupations - Community and social service occupations (%)
Most Common Occupations - Legal occupations (%)
Most Common Occupations - Education, training, and library occupations (%)
Most Common Occupations - Arts, design, entertainment, sports, and media occupations (%)
Most Common Occupations - Healthcare practitioners and technical occupations (%)
Most Common Occupations - Health diagnosing and treating practitioners and other technical occupations (%)
Most Common Occupations - Health technologists and technicians (%)
Most Common Occupations - Service occupations (%)
Most Common Occupations - Healthcare support occupations (%)
Most Common Occupations - Protective service occupations (%)
Most Common Occupations - Fire fighting and prevention, and other protective service workers including supervisors (%)
Most Common Occupations - Law enforcement workers including supervisors (%)
Most Common Occupations - Food preparation and serving related occupations (%)
Most Common Occupations - Building and grounds cleaning and maintenance occupations (%)
Most Common Occupations - Personal care and service occupations (%)
Most Common Occupations - Sales and office occupations (%)
Most Common Occupations - Sales and related occupations (%)
Most Common Occupations - Office and administrative support occupations (%)
Most Common Occupations - Natural resources, construction, and maintenance occupations (%)
Most Common Occupations - Farming, fishing, and forestry occupations (%)
Most Common Occupations - Construction and extraction occupations (%)
Most Common Occupations - Installation, maintenance, and repair occupations (%)
Most Common Occupations - Production, transportation, and material moving occupations (%)
Most Common Occupations - Production occupations (%)
Most Common Occupations - Transportation occupations (%)
Most Common Occupations - Material moving occupations (%)
People in Group quarters - Institutionalized population (%)
People in Group quarters - Correctional institutions (%)
People in Group quarters - Federal prisons and detention centers (%)
People in Group quarters - Halfway houses (%)
People in Group quarters - Local jails and other confinement facilities (including police lockups) (%)
People in Group quarters - Military disciplinary barracks (%)
People in Group quarters - State prisons (%)
People in Group quarters - Other types of correctional institutions (%)
People in Group quarters - Nursing homes (%)
People in Group quarters - Hospitals/wards, hospices, and schools for the handicapped (%)
People in Group quarters - Hospitals/wards and hospices for chronically ill (%)
People in Group quarters - Hospices or homes for chronically ill (%)
People in Group quarters - Military hospitals or wards for chronically ill (%)
People in Group quarters - Other hospitals or wards for chronically ill (%)
People in Group quarters - Hospitals or wards for drug/alcohol abuse (%)
People in Group quarters - Mental (Psychiatric) hospitals or wards (%)
People in Group quarters - Schools, hospitals, or wards for the mentally retarded (%)
People in Group quarters - Schools, hospitals, or wards for the physically handicapped (%)
People in Group quarters - Institutions for the deaf (%)
People in Group quarters - Institutions for the blind (%)
People in Group quarters - Orthopedic wards and institutions for the physically handicapped (%)
People in Group quarters - Wards in general hospitals for patients who have no usual home elsewhere (%)
People in Group quarters - Wards in military hospitals for patients who have no usual home elsewhere (%)
People in Group quarters - Juvenile institutions (%)
People in Group quarters - Long-term care (%)
People in Group quarters - Homes for abused, dependent, and neglected children (%)
People in Group quarters - Residential treatment centers for emotionally disturbed children (%)
People in Group quarters - Training schools for juvenile delinquents (%)
People in Group quarters - Short-term care, detention or diagnostic centers for delinquent children (%)
People in Group quarters - Type of juvenile institution unknown (%)
People in Group quarters - Noninstitutionalized population (%)
People in Group quarters - College dormitories (includes college quarters off campus) (%)
People in Group quarters - Military quarters (%)
People in Group quarters - On base (%)
People in Group quarters - Barracks, unaccompanied personnel housing (UPH), (Enlisted/Officer), ;and similar group living quarters for military personnel (%)
People in Group quarters - Transient quarters for temporary residents (%)
People in Group quarters - Military ships (%)
People in Group quarters - Group homes (%)
People in Group quarters - Homes or halfway houses for drug/alcohol abuse (%)
People in Group quarters - Homes for the mentally ill (%)
People in Group quarters - Homes for the mentally retarded (%)
People in Group quarters - Homes for the physically handicapped (%)
People in Group quarters - Other group homes (%)
People in Group quarters - Religious group quarters (%)
People in Group quarters - Dormitories (%)
People in Group quarters - Agriculture workers' dormitories on farms (%)
People in Group quarters - Job Corps and vocational training facilities (%)
People in Group quarters - Other workers' dormitories (%)
People in Group quarters - Crews of maritime vessels (%)
People in Group quarters - Other nonhousehold living situations (%)
People in Group quarters - Other noninstitutional group quarters (%)
Residents speaking English at home (%)
Residents speaking English at home - Born in the United States (%)
Residents speaking English at home - Native, born elsewhere (%)
Residents speaking English at home - Foreign born (%)
Residents speaking Spanish at home (%)
Residents speaking Spanish at home - Born in the United States (%)
Residents speaking Spanish at home - Native, born elsewhere (%)
Residents speaking Spanish at home - Foreign born (%)
Residents speaking other language at home (%)
Residents speaking other language at home - Born in the United States (%)
Residents speaking other language at home - Native, born elsewhere (%)
Residents speaking other language at home - Foreign born (%)
Class of Workers - Employee of private company (%)
Class of Workers - Self-employed in own incorporated business (%)
Class of Workers - Private not-for-profit wage and salary workers (%)
Class of Workers - Local government workers (%)
Class of Workers - State government workers (%)
Class of Workers - Federal government workers (%)
Class of Workers - Self-employed workers in own not incorporated business and Unpaid family workers (%)
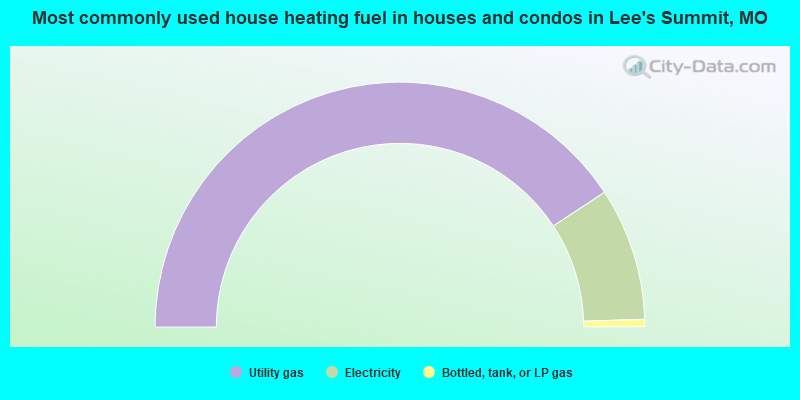
House heating fuel used in houses and condos - Utility gas (%)
House heating fuel used in houses and condos - Bottled, tank, or LP gas (%)
House heating fuel used in houses and condos - Electricity (%)
House heating fuel used in houses and condos - Fuel oil, kerosene, etc. (%)
House heating fuel used in houses and condos - Coal or coke (%)
House heating fuel used in houses and condos - Wood (%)
House heating fuel used in houses and condos - Solar energy (%)
House heating fuel used in houses and condos - Other fuel (%)
House heating fuel used in houses and condos - No fuel used (%)
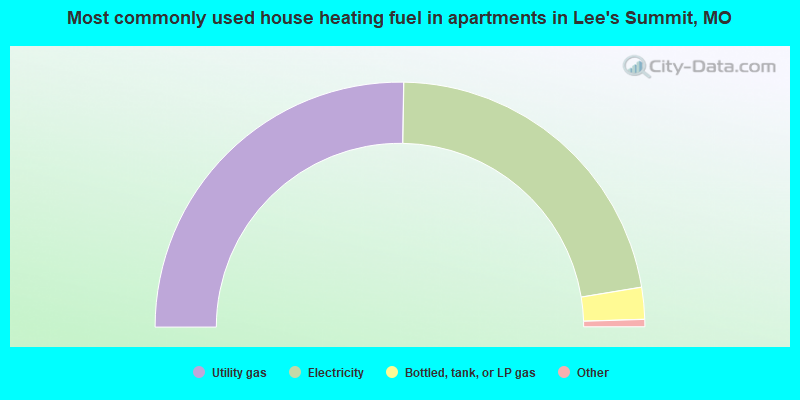
House heating fuel used in apartments - Utility gas (%)
House heating fuel used in apartments - Bottled, tank, or LP gas (%)
House heating fuel used in apartments - Electricity (%)
House heating fuel used in apartments - Fuel oil, kerosene, etc. (%)
House heating fuel used in apartments - Coal or coke (%)
House heating fuel used in apartments - Wood (%)
House heating fuel used in apartments - Solar energy (%)
House heating fuel used in apartments - Other fuel (%)
House heating fuel used in apartments - No fuel used (%)
Armed forces status - In Armed Forces (%)
Armed forces status - Civilian (%)
Armed forces status - Civilian - Veteran (%)
Armed forces status - Civilian - Nonveteran (%)
Fatal accidents locations in years 2005-2021
Fatal accidents locations in 2005
Fatal accidents locations in 2006
Fatal accidents locations in 2007
Fatal accidents locations in 2008
Fatal accidents locations in 2009
Fatal accidents locations in 2010
Fatal accidents locations in 2011
Fatal accidents locations in 2012
Fatal accidents locations in 2013
Fatal accidents locations in 2014
Fatal accidents locations in 2015
Fatal accidents locations in 2016
Fatal accidents locations in 2017
Fatal accidents locations in 2018
Fatal accidents locations in 2019
Fatal accidents locations in 2020
Fatal accidents locations in 2021
Alcohol use - People drinking some alcohol every month (%)
Alcohol use - People not drinking at all (%)
Alcohol use - Average days/month drinking alcohol
Alcohol use - Average drinks/week
Alcohol use - Average days/year people drink much
Audiometry - Average condition of hearing (%)
Audiometry - People that can hear a whisper from across a quiet room (%)
Audiometry - People that can hear normal voice from across a quiet room (%)
Audiometry - Ears ringing, roaring, buzzing (%)
Audiometry - Had a job exposure to loud noise (%)
Audiometry - Had off-work exposure to loud noise (%)
Blood Pressure & Cholesterol - Has high blood pressure (%)
Blood Pressure & Cholesterol - Checking blood pressure at home (%)
Blood Pressure & Cholesterol - Frequently checking blood cholesterol (%)
Blood Pressure & Cholesterol - Has high cholesterol level (%)
Consumer Behavior - Money monthly spent on food at supermarket/grocery store
Consumer Behavior - Money monthly spent on food at other stores
Consumer Behavior - Money monthly spent on eating out
Consumer Behavior - Money monthly spent on carryout/delivered foods
Consumer Behavior - Income spent on food at supermarket/grocery store (%)
Consumer Behavior - Income spent on food at other stores (%)
Consumer Behavior - Income spent on eating out (%)
Consumer Behavior - Income spent on carryout/delivered foods (%)
Current Health Status - General health condition (%)
Current Health Status - Blood donors (%)
Current Health Status - Has blood ever tested for HIV virus (%)
Current Health Status - Left-handed people (%)
Dermatology - People using sunscreen (%)
Diabetes - Diabetics (%)
Diabetes - Had a blood test for high blood sugar (%)
Diabetes - People taking insulin (%)
Diet Behavior & Nutrition - Diet health (%)
Diet Behavior & Nutrition - Milk product consumption (# of products/month)
Diet Behavior & Nutrition - Meals not home prepared (#/week)
Diet Behavior & Nutrition - Meals from fast food or pizza place (#/week)
Diet Behavior & Nutrition - Ready-to-eat foods (#/month)
Diet Behavior & Nutrition - Frozen meals/pizza (#/month)
Drug Use - People that ever used marijuana or hashish (%)
Drug Use - Ever used hard drugs (%)
Drug Use - Ever used any form of cocaine (%)
Drug Use - Ever used heroin (%)
Drug Use - Ever used methamphetamine (%)
Health Insurance - People covered by health insurance (%)
Kidney Conditions-Urology - Avg. # of times urinating at night
Medical Conditions - People with asthma (%)
Medical Conditions - People with anemia (%)
Medical Conditions - People with psoriasis (%)
Medical Conditions - People with overweight (%)
Medical Conditions - Elderly people having difficulties in thinking or remembering (%)
Medical Conditions - People who ever received blood transfusion (%)
Medical Conditions - People having trouble seeing even with glass/contacts (%)
Medical Conditions - People with arthritis (%)
Medical Conditions - People with gout (%)
Medical Conditions - People with congestive heart failure (%)
Medical Conditions - People with coronary heart disease (%)
Medical Conditions - People with angina pectoris (%)
Medical Conditions - People who ever had heart attack (%)
Medical Conditions - People who ever had stroke (%)
Medical Conditions - People with emphysema (%)
Medical Conditions - People with thyroid problem (%)
Medical Conditions - People with chronic bronchitis (%)
Medical Conditions - People with any liver condition (%)
Medical Conditions - People who ever had cancer or malignancy (%)
Mental Health - People who have little interest in doing things (%)
Mental Health - People feeling down, depressed, or hopeless (%)
Mental Health - People who have trouble sleeping or sleeping too much (%)
Mental Health - People feeling tired or having little energy (%)
Mental Health - People with poor appetite or overeating (%)
Mental Health - People feeling bad about themself (%)
Mental Health - People who have trouble concentrating on things (%)
Mental Health - People moving or speaking slowly or too fast (%)
Mental Health - People having thoughts they would be better off dead (%)
Oral Health - Average years since last visit a dentist
Oral Health - People embarrassed because of mouth (%)
Oral Health - People with gum disease (%)
Oral Health - General health of teeth and gums (%)
Oral Health - Average days a week using dental floss/device
Oral Health - Average days a week using mouthwash for dental problem
Oral Health - Average number of teeth
Pesticide Use - Households using pesticides to control insects (%)
Pesticide Use - Households using pesticides to kill weeds (%)
Physical Activity - People doing vigorous-intensity work activities (%)
Physical Activity - People doing moderate-intensity work activities (%)
Physical Activity - People walking or bicycling (%)
Physical Activity - People doing vigorous-intensity recreational activities (%)
Physical Activity - People doing moderate-intensity recreational activities (%)
Physical Activity - Average hours a day doing sedentary activities
Physical Activity - Average hours a day watching TV or videos
Physical Activity - Average hours a day using computer
Physical Functioning - People having limitations keeping them from working (%)
Physical Functioning - People limited in amount of work they can do (%)
Physical Functioning - People that need special equipment to walk (%)
Physical Functioning - People experiencing confusion/memory problems (%)
Physical Functioning - People requiring special healthcare equipment (%)
Prescription Medications - Average number of prescription medicines taking
Preventive Aspirin Use - Adults 40+ taking low-dose aspirin (%)
Reproductive Health - Vaginal deliveries (%)
Reproductive Health - Cesarean deliveries (%)
Reproductive Health - Deliveries resulted in a live birth (%)
Reproductive Health - Pregnancies resulted in a delivery (%)
Reproductive Health - Women breastfeeding newborns (%)
Reproductive Health - Women that had a hysterectomy (%)
Reproductive Health - Women that had both ovaries removed (%)
Reproductive Health - Women that have ever taken birth control pills (%)
Reproductive Health - Women taking birth control pills (%)
Reproductive Health - Women that have ever used Depo-Provera or injectables (%)
Reproductive Health - Women that have ever used female hormones (%)
Sexual Behavior - People 18+ that ever had sex (vaginal, anal, or oral) (%)
Sexual Behavior - Males 18+ that ever had vaginal sex with a woman (%)
Sexual Behavior - Males 18+ that ever performed oral sex on a woman (%)
Sexual Behavior - Males 18+ that ever had anal sex with a woman (%)
Sexual Behavior - Males 18+ that ever had any sex with a man (%)
Sexual Behavior - Females 18+ that ever had vaginal sex with a man (%)
Sexual Behavior - Females 18+ that ever performed oral sex on a man (%)
Sexual Behavior - Females 18+ that ever had anal sex with a man (%)
Sexual Behavior - Females 18+ that ever had any kind of sex with a woman (%)
Sexual Behavior - Average age people first had sex
Sexual Behavior - Average number of female sex partners in lifetime (males 18+)
Sexual Behavior - Average number of female vaginal sex partners in lifetime (males 18+)
Sexual Behavior - Average age people first performed oral sex on a woman (18+)
Sexual Behavior - Average number of woman performed oral sex on in lifetime (18+)
Sexual Behavior - Average number of male sex partners in lifetime (males 18+)
Sexual Behavior - Average number of male anal sex partners in lifetime (males 18+)
Sexual Behavior - Average age people first performed oral sex on a man (18+)
Sexual Behavior - Average number of male oral sex partners in lifetime (18+)
Sexual Behavior - People using protection when performing oral sex (%)
Sexual Behavior - Average number of times people have vaginal or anal sex a year
Sexual Behavior - People having sex without condom (%)
Sexual Behavior - Average number of male sex partners in lifetime (females 18+)
Sexual Behavior - Average number of male vaginal sex partners in lifetime (females 18+)
Sexual Behavior - Average number of female sex partners in lifetime (females 18+)
Sexual Behavior - Circumcised males 18+ (%)
Sleep Disorders - Average hours sleeping at night
Sleep Disorders - People that has trouble sleeping (%)
Smoking-Cigarette Use - People smoking cigarettes (%)
Taste & Smell - People 40+ having problems with smell (%)
Taste & Smell - People 40+ having problems with taste (%)
Taste & Smell - People 40+ that ever had wisdom teeth removed (%)
Taste & Smell - People 40+ that ever had tonsils teeth removed (%)
Taste & Smell - People 40+ that ever had a loss of consciousness because of a head injury (%)
Taste & Smell - People 40+ that ever had a broken nose or other serious injury to face or skull (%)
Taste & Smell - People 40+ that ever had two or more sinus infections (%)
Weight - Average height (inches)
Weight - Average weight (pounds)
Weight - Average BMI
Weight - People that are obese (%)
Weight - People that ever were obese (%)
Weight - People trying to lose weight (%)
Officers per 1,000 residents here:
1.31Missouri average:
2.54
Ancestries: German (15.5%), English (12.1%), European (9.0%), American (8.4%), Irish (6.1%), Italian (2.4%).
Current Local Time:
Land area: 59.5 square miles.
Population density: 1,739 people per square mile (low).
4,266 residents are foreign born (1.8% Asia , 1.0% Latin America , 0.7% Europe , 0.5% Africa ).
This city:
4.2%Missouri:
4.2%
Median real estate property taxes paid for housing units with mortgages in 2022: $3,580 (1.0%)Median real estate property taxes paid for housing units with no mortgage in 2022: $3,347 (1.0%)
Nearest city with pop. 200,000+: Kansas City, MO
Nearest city with pop. 1,000,000+: Chicago, IL
Nearest cities:
Unity Village, MO (1.5 miles),
Latitude: 38.92 N, Longitude: 94.37 W
Daytime population change due to commuting: -2,751 (-2.6%)Workers who live and work in this city: 23,416 (45.7%)
Area code commonly used in this area: 816
Property values in Lee's Summit, MO
Single-family new house construction building permits:
2004: 997 buildings , average cost: $163,6002003: 992 buildings , average cost: $152,3002002: 1155 buildings , average cost: $131,2002001: 893 buildings , average cost: $128,1002000: 776 buildings , average cost: $128,3001999: 840 buildings , average cost: $124,8001998: 804 buildings , average cost: $123,3001997: 735 buildings , average cost: $113,600Unemployment in December 2023:
Population change in the 1990s: +24,165 (+51.9%).
Most common occupations in Lee's Summit, MO (%)
Both Males Females
Other management occupations, except farmers and farm managers (5.7%)
Computer specialists (4.2%)
Cooks and food preparation workers (3.9%)
Retail sales workers, except cashiers (3.6%)
Other office and administrative support workers, including supervisors (3.1%)
Building and grounds cleaning and maintenance occupations (2.9%)
Top executives (2.7%)
Other management occupations, except farmers and farm managers (6.8%)
Computer specialists (5.9%)
Driver/sales workers and truck drivers (4.8%)
Retail sales workers, except cashiers (3.9%)
Cooks and food preparation workers (3.8%)
Building and grounds cleaning and maintenance occupations (3.7%)
Top executives (3.4%)
Secretaries and administrative assistants (5.7%)
Other office and administrative support workers, including supervisors (5.4%)
Registered nurses (5.3%)
Other management occupations, except farmers and farm managers (4.6%)
Cooks and food preparation workers (4.0%)
Information and record clerks, except customer service representatives (3.8%)
Retail sales workers, except cashiers (3.2%)
Tornado activity:
Lee's Summit-area historical tornado activity is slightly above Missouri state average. It is 90% greater than the overall U.S. average.
On 5/20/1957, a category F5 (max. wind speeds 261-318 mph) tornado 4.2 miles away from the Lee's Summit city center killed 44 people and injured 207 people and caused between $500,000 and $5,000,000 in damages.
On 5/4/1977, a category F4 (max. wind speeds 207-260 mph) tornado 21.0 miles away from the city center injured 5 people and caused between $500,000 and $5,000,000 in damages.
Earthquake activity:
Lee's Summit-area historical earthquake activity is significantly above Missouri state average. It is 503% greater than the overall U.S. average. On 9/3/2016 at 12:02:44, a magnitude 5.8 (5.8 MW, Depth: 3.5 mi, Class: Moderate, Intensity: VI - VII) earthquake occurred 222.3 miles away from the city center On 11/6/2011 at 03:53:10, a magnitude 5.7 (5.7 MW, Depth: 3.2 mi) earthquake occurred 268.9 miles away from Lee's Summit center On 11/12/2014 at 21:40:00, a magnitude 4.9 (4.9 MW, Depth: 2.5 mi, Class: Light, Intensity: IV - V) earthquake occurred 210.4 miles away from the city center On 11/7/2016 at 01:44:24, a magnitude 5.0 (5.0 MW, Depth: 2.8 mi) earthquake occurred 242.7 miles away from the city center On 2/13/2016 at 17:07:06, a magnitude 5.1 (5.1 MW, Depth: 5.2 mi) earthquake occurred 290.8 miles away from Lee's Summit center On 4/18/2008 at 09:36:59, a magnitude 5.4 (5.1 MB, 4.8 MS, 5.4 MW, 5.2 MW) earthquake occurred 351.7 miles away from Lee's Summit center Magnitude types: body-wave magnitude (MB), surface-wave magnitude (MS), moment magnitude (MW) Natural disasters: The number of natural disasters in Jackson County (24) is greater than the US average (15).Major Disasters (Presidential) Declared: 17Emergencies Declared: 5Floods: 18, Storms: 15, Tornadoes: 8, Winter Storms: 2, Drought: 1, Heavy Rain: 1, Hurricane: 1, Ice Storm: 1, Wind: 1, Other: 1 (Note: some incidents may be assigned to more than one category). Hospitals and medical centers near Lee's Summit: JEFFERSON HEALTH CARE (Nursing Home, about 2 miles away; LEES SUMMIT, MO)
DIALYSIS CLINICS, INC - LEES SUMMIT (Dialysis Facility, about 2 miles away; LEES SUMMIT, MO)
DSI - LEE'S SUMMIT RENAL CENTER (Dialysis Facility, about 2 miles away; LEES SUMMIT, MO)
AMEDISYS HOME HEALTH OF MISSOURI (Home Health Center, about 2 miles away; LEES SUMMIT, MO)
VILLAGE HOME HEALTH (Home Health Center, about 2 miles away; LEES SUMMIT, MO)
VILLAGE HOSPICE (Hospital, about 2 miles away; LEES SUMMIT, MO)
JOHN KNOX VILLAGE CARE CENTER (Nursing Home, about 3 miles away; LEES SUMMIT, MO)
Amtrak station: LEE'S SUMMIT (220 S. MAIN ST.)
.
Services: enclosed waiting area, public payphones, free short-term parking, free long-term parking, call for taxi service.
College/University in Lee's Summit: National American University-Lee's Summit Full-time enrollment: 281; Location: 401 North West Murray Road; Private, for-profit; Website: www.national.edu/locations/missouri/lees-summit)
Colleges/universities with over 2000 students nearest to Lee's Summit:
Rockhurst University (about 13 miles; Kansas City, MO ; Full-time enrollment: 2,013)
University of Missouri-Kansas City (about 14 miles; Kansas City, MO ; FT enrollment: 10,544)
Metropolitan Community College-Kansas City (about 16 miles; Kansas City, MO ; FT enrollment: 12,834)
Wright Career College (about 16 miles; Overland Park, KS ; FT enrollment: 3,107)
Johnson County Community College (about 20 miles; Overland Park, KS ; FT enrollment: 11,976)
MidAmerica Nazarene University (about 23 miles; Olathe, KS ; FT enrollment: 2,158)
Kansas City Kansas Community College (about 25 miles; Kansas City, KS ; FT enrollment: 4,718)
Public high schools in Lee's Summit: LEE'S SUMMIT NORTH HIGH Students: 2,099, Location: 901 NE DOUGLAS ST, Grades: 9-12)LEE'S SUMMIT SR. HIGH Students: 1,795, Location: 400 SE BLUE PKWY, Grades: 9-12)LEE'S SUMMIT WEST HIGH Students: 1,393, Location: 2600 SW WARD RD, Grades: 9-12)HILLTOP SCHOOL Students: 44, Location: 301 NE GREGORY BLVD, Grades: 5-12)LANGSFORD HOUSE Location: 525 SE 2ND ST, Grades: 5-12)
LAKEVIEW WOODS SCHOOL Location: 351 NW GREGORY, Grades: KG-12)
MILLER PARK CENTER Location: 600 SE MILLER STREET, Grades: KG-12)
Biggest public elementary/middle schools in Lee's Summit: PRAIRIE VIEW ELEM. Students: 967, Location: 501 SE TODD GEORGE RD, Grades: KG-6)BERNARD C. CAMPBELL MIDDLE Students: 942, Location: 1201 NE COLBERN RD, Grades: 5-8)PLEASANT LEA ELEM. Students: 896, Location: 700 W PERSEL, Grades: KG-6)SUMMIT LAKES MIDDLE Students: 845, Location: 3500 SW WINDEMERE DR, Grades: 7-8)HAWTHORN HILL ELEM. Students: 687, Location: 2801 SW PRYOR RD, Grades: KG-6)LONGVIEW FARM ELEM. Students: 645, Location: 1001 SW LONGVIEW PARK DR, Grades: KG-6)VOY SPEARS JR. ELEM. Students: 641, Location: 201 NE ANDERSON, Grades: PK-5)UNDERWOOD ELEM. Students: 637, Location: 1125 NE COLBERN RD, Grades: KG-6)WOODLAND ELEM. Students: 614, Location: 12709 S SMART RD, Grades: KG-6)DELTA WOODS MIDDLE Students: 609, Location: 4401 NE LAKEWOOD WAY, Grades: 6-8)See full list of schools located in Lee's Summit User-submitted facts and corrections:
Hospital St. Luke's East Lee's Summit. Douglas St. and 470 FW. added by Nana
Please add Martin Luther Lutheran Church to your list of Lees Summit Churches. The address is 1200 SW Parkway, Lees Summit, MO 64063, phone is 524-2540, email is mlutherchurch at sbcglobal.net; website is www.mlchurch.org
Notable locations in Lee's Summit: (A) , Blue Springs Marina (B) , Longview Farm (C) , Buckeye Square (D) , Lees Summit Fire Department Station 3 (E) , Lees Summit Fire Department Station 4 (F) , Lees Summit Fire Department Station 5 (G) , Lees Summit Fire Department Station 1 Headquarters (H) , Lees Summit Fire Department Station 7 (I) , Lees Summit Fire Department Station 2 (J) . Display/hide their locations on the map
Shopping Centers: (1) , Ceder Creek Mall Shopping Center (2) , Lees Summit Town Center Shopping Center (3) , Pinetree Plaza Shopping Center (4) , Summit Shopping Center (5) , Valle Vista Shopping Center (6) , Summit Springs Shopping Center (7) . Display/hide their locations on the map
Churches in Lee's Summit include: (A) , Saint Matthew Church (B) , Longview Chapel (C) , Woods Chapel (D) , Community Church (E) , Mount Zion Church (F) . Display/hide their locations on the map
Cemetery: (1) . Display/hide its location on the map
Reservoirs: (A) , Lakewood Lake West (B) , Bowlin Pond (C) , Prairie Lee Lake (D) , Lakewood Lakes (E) , Lakewood Lake East (F) , Mirror Lakes (G) , Old Longview Lake (H) . Display/hide their locations on the map
Streams, rivers, and creeks: (A) , Cedar Creek (B) , Alexander Creek (C) , Mouse Creek (D) . Display/hide their locations on the map
Parks in Lee's Summit include: (1) , North Prairie Lee Park (2) , Franke Soccer Fields (3) , Summit Park (4) . Display/hide their locations on the map
Birthplace of: Pat Metheny - (born 1954), musician, Audrey Lindvall - Female model, Jamie Andrisevic - College basketball player (Arizona State Sun Devils), Trevor Rosenthal - Baseball player, Walter Coleman (1895 pitcher) - Baseball player, Rolla Mapel - Baseball player.
Jackson County has a predicted average indoor radon screening level greater than 4 pCi/L (pico curies per liter) - Highest Potential Average household size: This city:
2.6 peopleMissouri:
2.5 people
Percentage of family households: This city:
73.0%Whole state:
65.3%
Percentage of households with unmarried partners: This city:
4.9%Whole state:
6.7%
Likely homosexual households (counted as self-reported same-sex unmarried-partner households)
Lesbian couples: 0.3% of all households Gay men: 0.2% of all households
People in group quarters in Lee's Summit in 2010:
573 people in nursing facilities/skilled-nursing facilities
53 people in other noninstitutional facilities
46 people in correctional facilities intended for juveniles
20 people in emergency and transitional shelters (with sleeping facilities) for people experiencing homelessness
15 people in group homes intended for adults
7 people in group homes for juveniles (non-correctional)
People in group quarters in Lee's Summit in 2000:
746 people in nursing homes
21 people in homes for the mentally retarded
9 people in other noninstitutional group quarters
3 people in religious group quarters
Banks with branches in Lee's Summit (2011 data):
Bank of Lee's Summit: Third And Ward Branch at Third Street And Ward Road, branch established on 1983/12/22; Sam Walton Lane Branch at 1021 Sam Walton Lane, branch established on 1996/04/08. Info updated 2010/08/12: Bank assets: $270.5 mil, Deposits: $215.5 mil, headquarters in Lees Summit, MO, positive income , Commercial Lending Specialization, 4 total offices , Holding Company: Valley View Bancshares, Inc.
North American Savings Bank, F.S.B.: 291 Highway Branch at 646 North 291 Highway, branch established on 1923/01/01. Info updated 2011/07/21: Bank assets: $1,184.7 mil, Deposits: $889.0 mil, headquarters in Grandview, MO, negative income in the last year , Commercial Lending Specialization, 9 total offices
Preferred Bank: Melody Lane Branch at 601 S.E. Melody Lane, branch established on 1989/02/13. Info updated 2010/07/26: Bank assets: $75.4 mil, Deposits: $66.9 mil, headquarters in Rothville, MO, positive income , 4 total offices , Holding Company: Bor Bancorp
Bank of the West: Blue Parkway Branch at 740 Northwest Blue Parkway, branch established on 1966/05/16. Info updated 2009/11/16: Bank assets: $62,408.3 mil, Deposits: $43,995.2 mil, headquarters in San Francisco, CA, positive income , 647 total offices , Holding Company: Bnp Paribas
Blue Ridge Bank and Trust Co.: Lee's Summit Branch at 121 South M-291 Highway, branch established on 1918/01/01. Info updated 2011/06/13: Bank assets: $469.9 mil, Deposits: $424.5 mil, headquarters in Independence, MO, negative income in the last year , Commercial Lending Specialization, 11 total offices , Holding Company: Blue Ridge Bancshares, Inc.
For population 15 years and over in Lee's Summit:
Never married: 27.7%Now married: 55.3%Separated: 1.5%Widowed: 5.2%Divorced: 10.3% For population 25 years and over in Lee's Summit:
High school or higher: 96.6%Bachelor's degree or higher: 48.7%Graduate or professional degree: 18.4%Unemployed: 2.6%Mean travel time to work (commute): 18.1 minutes
Education Gini index (Inequality in education) Here:
10.1Missouri average:
11.1
Religion statistics for Lee's Summit, MO (based on Jackson County data)
Religion Adherents Congregations Evangelical Protestant 154,390 404 Catholic 69,441 52 Mainline Protestant 61,299 159 Other 34,880 110 Black Protestant 34,722 84 Orthodox 1,235 3 None 318,191 -
Source: Clifford Grammich, Kirk Hadaway, Richard Houseal, Dale E.Jones, Alexei Krindatch, Richie Stanley and Richard H.Taylor. 2012. 2010 U.S.Religion Census: Religious Congregations & Membership Study. Association of Statisticians of American Religious Bodies. Jones, Dale E., et al. 2002. Congregations and Membership in the United States 2000. Nashville, TN: Glenmary Research Center. Graphs represent county-level data
Food Environment Statistics: Number of grocery stores : 109Jackson County :
1.64 / 10,000 pop.Missouri :
1.88 / 10,000 pop.
Number of supercenters and club stores : 10Here :
0.15 / 10,000 pop.Missouri :
0.18 / 10,000 pop.
Number of convenience stores (no gas) : 40Jackson County :
0.60 / 10,000 pop.State :
0.60 / 10,000 pop.
Number of convenience stores (with gas) : 185Jackson County :
2.78 / 10,000 pop.Missouri :
4.34 / 10,000 pop.
Number of full-service restaurants : 460Jackson County :
6.91 / 10,000 pop.Missouri :
7.37 / 10,000 pop.
Adult obesity rate : Jackson County :
30.8%Missouri :
29.6%
Low-income preschool obesity rate : Health and Nutrition: Healthy diet rate : This city:
51.9%Missouri:
50.9%
Average overall health of teeth and gums : Lee's Summit:
51.0%Missouri:
48.6%
Average BMI : Lee's Summit:
28.5Missouri:
28.7
People feeling badly about themselves : People not drinking alcohol at all : Lee's Summit:
8.6%Missouri:
10.1%
Average hours sleeping at night : This city:
6.8Missouri:
6.8
Overweight people : Lee's Summit:
34.8%Missouri:
34.3%
General health condition : Lee's Summit:
59.3%Missouri:
57.5%
Average condition of hearing : More about Health and Nutrition of Lee's Summit, MO Residents
Lee's Summit government finances - Expenditure in 2021 (per resident):
Construction - General - Other: $35,643,000 ($344.49)
Current Operations - Police Protection: $22,228,000 ($214.84)
Local Fire Protection: $20,941,000 ($202.40)Water Utilities: $16,886,000 ($163.20)Sewerage: $14,648,000 ($141.57)Financial Administration: $12,587,000 ($121.65)General - Other: $12,144,000 ($117.37)Regular Highways: $11,445,000 ($110.62)Parks and Recreation: $8,062,000 ($77.92)Housing and Community Development: $4,478,000 ($43.28)Central Staff Services: $4,172,000 ($40.32)Air Transportation: $2,830,000 ($27.35)Judicial and Legal Services: $2,578,000 ($24.92)Solid Waste Management: $600,000 ($5.80)General - Interest on Debt: $2,848,000 ($27.53)
Total Salaries and Wages: $65,197,000 ($630.14)
Water Utilities - Interest on Debt: $19,000 ($0.18)
Lee's Summit government finances - Revenue in 2021 (per resident):
Charges - Sewerage: $18,254,000 ($176.43)
Other: $12,616,000 ($121.93)Parks and Recreation: $2,399,000 ($23.19)Air Transportation: $2,150,000 ($20.78)Miscellaneous Commercial Activities: $68,000 ($0.66)Federal Intergovernmental - General Local Government Support: $863,000 ($8.34)
Air Transportation: $89,000 ($0.86)Local Intergovernmental - General Local Government Support: $4,496,000 ($43.45)
Miscellaneous - General Revenue - Other: $15,642,000 ($151.18)
Interest Earnings: $4,425,000 ($42.77)Sale of Property: $3,658,000 ($35.35)Rents: $2,324,000 ($22.46)Fines and Forfeits: $14,000 ($0.14)Revenue - Water Utilities: $19,188,000 ($185.45)
State Intergovernmental - Highways: $2,354,000 ($22.75)
General Local Government Support: $9,000 ($0.09)Other: $1,000 ($0.01)Tax - General Sales and Gross Receipts: $42,517,000 ($410.93)
Property: $37,049,000 ($358.08)Public Utilities Sales: $11,527,000 ($111.41)Occupation and Business License - Other: $1,905,000 ($18.41)Other Selective Sales: $1,892,000 ($18.29)Motor Vehicle License: $418,000 ($4.04)Tobacco Products Sales: $269,000 ($2.60)Other License: $168,000 ($1.62)Alcoholic Beverage License: $95,000 ($0.92)
Lee's Summit government finances - Debt in 2021 (per resident):
Long Term Debt - Beginning Outstanding - Unspecified Public Purpose: $74,650,000 ($721.50)
Outstanding Unspecified Public Purpose: $65,144,000 ($629.62)Retired Unspecified Public Purpose: $9,506,000 ($91.88)
Lee's Summit government finances - Cash and Securities in 2021 (per resident):
Other Funds - Cash and Securities: $160,695,000 ($1553.13)
Sinking Funds - Cash and Securities: $11,023,000 ($106.54)
7.09% of this county's 2021 resident taxpayers lived in other counties in 2020 ($55,298 average adjusted gross income )
Here:
7.09%Missouri average:
7.67%
0.01% of residents moved from foreign countries ($84 average AGI )Jackson County:
0.01%Missouri average:
0.02%
Top counties from which taxpayers relocated into this county between 2020 and 2021:
7.47% of this county's 2020 resident taxpayers moved to other counties in 2021 ($66,055 average adjusted gross income )
Here:
7.47%Missouri average:
7.51%
0.01% of residents moved to foreign countries ($37 average AGI )Jackson County:
0.01%Missouri average:
0.01%
Top counties to which taxpayers relocated from this county between 2020 and 2021:
Businesses in Lee's Summit, MO
Name Count Name Count
24 Hour Fitness 1 Nike 2 ALDI 1 Nissan 1 Burger King 3 OfficeMax 1 Chipotle 1 Olive Garden 1 Coldwater Creek 1 Outback 1 Dressbarn 1 Outback Steakhouse 1 Eddie Bauer 1 Panera Bread 2 Finish Line 1 Plato's Closet 1 Hilton 1 Red Lobster 1 Hobby Lobby 1 SONIC Drive-In 2 Jimmy John's 1 Sephora 1 Justice 1 Starbucks 1 Kincaid 1 Steak 'n Shake 1 Kohl's 1 Subway 3 Lane Furniture 1 Super 8 1 Macy's 1 T.J.Maxx 1 Maurices 1 The Room Place 1 Motherhood Maternity 1 Toyota 1
Strongest AM radio stations in Lee's Summit:
WHB (810 AM; 50 kW; KANSAS CITY, MO; Owner: UNION BROADCASTING, INC.)
KCCV (760 AM; daytime; 6 kW; OVERLAND PARK, KS; Owner: BOTT BROADCASTING COMPANY)
KKHK (1250 AM; 25 kW; KANSAS CITY, KS)
KCTE (1510 AM; daytime; 10 kW; INDEPENDENCE, MO; Owner: UNION BROADCASTING, INC.)
KCSP (610 AM; 5 kW; KANSAS CITY, MO; Owner: ENTERCOM KANSAS CITY LICENSE, LLC)
KPHN (1190 AM; 5 kW; KANSAS CITY, MO; Owner: ABC, INC.)
KXTR (1660 AM; 10 kW; KANSAS CITY, KS; Owner: ENTERCOM KANSAS CITY LICENSE, LLC)
KMBZ (980 AM; 5 kW; KANSAS CITY, MO; Owner: ENTERCOM KANSAS CITY LICENSE, LLC)
KCMO (710 AM; 10 kW; KANSAS CITY, MO; Owner: SUSQUEHANNA KANSAS CITY PARTNERSHIP)
KCWJ (1030 AM; 1 kW; BLUE SPRINGS, MO; Owner: CHRISTIAN BROADCASTING ASSOCIATES, LP)
KCNW (1380 AM; 2 kW; FAIRWAY, KS; Owner: KANSAS CITY RADIO, INC.)
KPRT (1590 AM; 1 kW; KANSAS CITY, MO; Owner: CARTER BROADCAST GROUP, INC.)
KGGN (890 AM; daytime; 1 kW; GLADSTONE, MO; Owner: MORTENSON BROADCASTING COMPANY, INC.)
Strongest FM radio stations in Lee's Summit:
KMXV (93.3 FM; KANSAS CITY, MO; Owner: INFINITY RADIO OPERATIONS INC.)
KQRC-FM (98.9 FM; LEAVENWORTH, KS; Owner: ENTERCOM KANSAS CITY LICENSE, LLC)
KRBZ (96.5 FM; KANSAS CITY, MO; Owner: ENTERCOM KANSAS CITY LICENSE, LLC)
KYYS (99.7 FM; KANSAS CITY, MO; Owner: ENTERCOM KANSAS CITY LICENSE, LLC)
KPRS (103.3 FM; KANSAS CITY, MO; Owner: CARTER BROADCAST GROUP, INC.)
WDAF-FM (106.5 FM; LIBERTY, MO; Owner: ENTERCOM KANSAS CITY LICENSE, LLC)
KCFX (101.1 FM; HARRISONVILLE, MO; Owner: SUSQUEHANNA KANSAS CITY PARTNERSHIP)
KUDL (98.1 FM; KANSAS CITY, KS; Owner: ENTERCOM KANSAS CITY LICENSE, LLC)
KSRC (102.1 FM; KANSAS CITY, MO; Owner: INFINITY RADIO OPERATIONS INC.)
KBEQ-FM (104.3 FM; KANSAS CITY, MO; Owner: INFINITY RADIO SUBSIDIARY OPERATIONS INC.)
KCMO-FM (94.9 FM; KANSAS CITY, MO; Owner: SUSQUEHANNA KANSAS CITY PARTNERSHIP)
KZPL (97.3 FM; LEE'S SUMMIT, MO; Owner: UNION FIRST BROADCASTING, LLC)
KCUR-FM (89.3 FM; KANSAS CITY, MO; Owner: CURATORS OF UNIVERSITY OF MISSOURI)
KLJC (88.5 FM; KANSAS CITY, MO; Owner: CALVARY BIBLE COLLEGE)
KKFI (90.1 FM; KANSAS CITY, MO; Owner: MID-COAST RADIO PROJECT, INC.)
KFKF-FM (94.1 FM; KANSAS CITY, KS; Owner: INFINITY RADIO SUBSIDIARY OPERATIONS INC.)
KMJK (107.3 FM; LEXINGTON, MO; Owner: ALLUR-KANSAS CITY, INC.)
KCCV-FM (92.3 FM; OLATHE, KS; Owner: BOTT BROADCASTING COMPANY)
KAYX (92.5 FM; RICHMOND, MO; Owner: BOTT COMMUNICATIONS, INC.)
TV broadcast stations around Lee's Summit:
KMCI (Channel 38; LAWRENCE, KS; Owner: SCRIPPS HOWARD BROADCASTING COMPANY)
KPXE (Channel 50; KANSAS CITY, MO; Owner: PAXSON KANSAS CITY LICENSE, INC.)
KMBC-TV (Channel 9; KANSAS CITY, MO; Owner: KMBC HEARST-ARGYLE TELEVISION, INC.)
KCPT (Channel 19; KANSAS CITY, MO; Owner: PUBLIC TELEVISION 19, INC.)
KSMO-TV (Channel 62; KANSAS CITY, MO; Owner: KSMO LICENSEE, INC.)
K35CT (Channel 35; KANSAS CITY, MO; Owner: WORD OF GOD FELLOWSHIP, INC.)
KCTV (Channel 5; KANSAS CITY, MO; Owner: MEREDITH CORPORATION)
KCWE (Channel 29; KANSAS CITY, MO; Owner: KCWE-TV, INC.)
K48FS (Channel 48; KANSAS CITY, MO; Owner: WORD OF GOD FELLOWSHIP, INC.)
KSHB-TV (Channel 41; KANSAS CITY, MO; Owner: SCRIPPS HOWARD BROADCASTING COMPANY)
WDAF-TV (Channel 4; KANSAS CITY, MO; Owner: WDAF LICENSE, INC.)
K26CR (Channel 26; KANSAS CITY, MO; Owner: VENTANA TELEVISION, INC.)
National Bridge Inventory (NBI) Statistics 164 Number of bridges1,371ft / 418m Total length $4,381,000 Total costs2,576,996 Total average daily traffic203,495 Total average daily truck traffic
New bridges - historical statistics
1 1910-1919 1 1920-1929 1 1950-1959 9 1960-1969 65 1970-1979 9 1980-1989 11 1990-1999 39 2000-2009 22 2010-2019 6 2020-2022
See full National Bridge Inventory statistics for Lee's Summit, MO
Home Mortgage Disclosure Act Aggregated Statistics For Year 2009(Based on 8 full and 7 partial tracts) A) FHA, FSA/RHS & VA B) Conventional C) Refinancings D) Home Improvement Loans E) Loans on Dwellings For 5+ Families F) Non-occupant Loans on G) Loans On Manufactured Number Average Value Number Average Value Number Average Value Number Average Value Number Average Value Number Average Value Number Average Value
LOANS ORIGINATED 589 $157,673 587 $184,844 2,893 $177,912 83 $73,503 2 $2,045,000 135 $150,378 1 $148,850 APPLICATIONS APPROVED, NOT ACCEPTED 26 $177,099 34 $173,917 237 $183,329 15 $53,499 0 $0 7 $145,146 0 $0 APPLICATIONS DENIED 47 $140,947 67 $201,432 597 $183,929 62 $33,527 0 $0 41 $114,169 2 $77,585 APPLICATIONS WITHDRAWN 58 $153,811 59 $173,458 633 $187,109 26 $104,420 0 $0 17 $128,655 0 $0 FILES CLOSED FOR INCOMPLETENESS 7 $242,494 11 $238,420 120 $202,514 2 $90,010 0 $0 5 $113,918 0 $0
Aggregated Statistics For Year 2008(Based on 8 full and 7 partial tracts) A) FHA, FSA/RHS & VA B) Conventional C) Refinancings D) Home Improvement Loans E) Loans on Dwellings For 5+ Families F) Non-occupant Loans on G) Loans On Manufactured Number Average Value Number Average Value Number Average Value Number Average Value Number Average Value Number Average Value Number Average Value
LOANS ORIGINATED 426 $156,555 932 $182,636 1,367 $178,173 125 $52,627 3 $1,601,387 211 $149,393 1 $44,170 APPLICATIONS APPROVED, NOT ACCEPTED 18 $162,156 70 $181,596 201 $166,283 33 $28,734 0 $0 21 $117,486 1 $26,400 APPLICATIONS DENIED 45 $157,982 88 $193,839 733 $192,689 137 $62,111 0 $0 44 $124,422 1 $24,000 APPLICATIONS WITHDRAWN 40 $166,935 108 $201,158 399 $188,449 17 $115,628 0 $0 20 $120,966 0 $0 FILES CLOSED FOR INCOMPLETENESS 6 $146,255 15 $208,930 84 $183,531 11 $58,644 0 $0 4 $109,032 0 $0
Aggregated Statistics For Year 2007(Based on 8 full and 7 partial tracts) A) FHA, FSA/RHS & VA B) Conventional C) Refinancings D) Home Improvement Loans E) Loans on Dwellings For 5+ Families F) Non-occupant Loans on G) Loans On Manufactured Number Average Value Number Average Value Number Average Value Number Average Value Number Average Value Number Average Value Number Average Value
LOANS ORIGINATED 140 $154,469 1,633 $166,655 1,485 $158,495 247 $45,078 5 $5,510,400 298 $167,126 0 $0 APPLICATIONS APPROVED, NOT ACCEPTED 12 $151,722 191 $165,705 330 $161,845 60 $49,564 0 $0 27 $174,442 0 $0 APPLICATIONS DENIED 19 $149,767 249 $166,058 946 $179,388 181 $77,699 1 $262,000 69 $155,805 2 $21,020 APPLICATIONS WITHDRAWN 15 $140,467 157 $162,350 471 $170,133 41 $119,782 0 $0 32 $174,995 0 $0 FILES CLOSED FOR INCOMPLETENESS 5 $133,080 32 $161,508 155 $188,203 12 $71,190 0 $0 3 $105,190 0 $0
Aggregated Statistics For Year 2006(Based on 8 full and 7 partial tracts) A) FHA, FSA/RHS & VA B) Conventional C) Refinancings D) Home Improvement Loans E) Loans on Dwellings For 5+ Families F) Non-occupant Loans on G) Loans On Manufactured Number Average Value Number Average Value Number Average Value Number Average Value Number Average Value Number Average Value Number Average Value
LOANS ORIGINATED 174 $145,873 2,133 $151,786 1,877 $141,274 256 $46,821 3 $6,061,510 290 $133,281 0 $0 APPLICATIONS APPROVED, NOT ACCEPTED 11 $147,984 259 $163,764 384 $157,429 64 $48,061 0 $0 66 $140,248 1 $29,200 APPLICATIONS DENIED 15 $135,105 392 $181,111 1,104 $169,409 146 $67,977 2 $434,750 116 $153,694 5 $48,784 APPLICATIONS WITHDRAWN 12 $119,894 249 $147,171 735 $159,948 44 $103,174 0 $0 54 $168,240 0 $0 FILES CLOSED FOR INCOMPLETENESS 1 $245,370 66 $183,184 173 $171,976 10 $91,519 0 $0 16 $134,578 1 $218,140
Aggregated Statistics For Year 2005(Based on 8 full and 7 partial tracts) A) FHA, FSA/RHS & VA B) Conventional C) Refinancings D) Home Improvement Loans E) Loans on Dwellings For 5+ Families F) Non-occupant Loans on G) Loans On Manufactured Number Average Value Number Average Value Number Average Value Number Average Value Number Average Value Number Average Value Number Average Value
LOANS ORIGINATED 202 $143,182 2,478 $140,587 2,399 $143,172 209 $54,146 4 $1,238,682 395 $117,202 2 $94,155 APPLICATIONS APPROVED, NOT ACCEPTED 5 $135,868 263 $132,074 344 $145,812 50 $50,997 0 $0 51 $123,482 3 $46,290 APPLICATIONS DENIED 21 $112,462 390 $121,436 1,065 $156,258 161 $49,876 0 $0 117 $119,268 17 $45,746 APPLICATIONS WITHDRAWN 13 $139,978 324 $141,130 869 $159,321 73 $177,132 1 $580,000 68 $138,398 1 $146,000 FILES CLOSED FOR INCOMPLETENESS 1 $86,000 68 $133,596 189 $153,453 11 $58,435 0 $0 12 $86,929 1 $130,440
Aggregated Statistics For Year 2004(Based on 8 full and 7 partial tracts) A) FHA, FSA/RHS & VA B) Conventional C) Refinancings D) Home Improvement Loans E) Loans on Dwellings For 5+ Families F) Non-occupant Loans on G) Loans On Manufactured Number Average Value Number Average Value Number Average Value Number Average Value Number Average Value Number Average Value Number Average Value
LOANS ORIGINATED 196 $139,311 2,152 $146,480 2,794 $145,261 198 $47,581 7 $1,213,593 341 $124,417 3 $41,083 APPLICATIONS APPROVED, NOT ACCEPTED 10 $128,785 258 $138,816 437 $150,118 32 $40,662 0 $0 45 $123,595 4 $67,170 APPLICATIONS DENIED 12 $134,458 349 $139,262 1,042 $144,235 141 $41,046 1 $158,690 96 $123,665 6 $57,855 APPLICATIONS WITHDRAWN 12 $132,069 227 $159,665 782 $152,408 45 $55,548 0 $0 41 $131,072 3 $179,167 FILES CLOSED FOR INCOMPLETENESS 3 $146,247 70 $164,174 241 $152,311 15 $39,281 0 $0 27 $114,203 0 $0
Aggregated Statistics For Year 2003(Based on 8 full and 7 partial tracts) A) FHA, FSA/RHS & VA B) Conventional C) Refinancings D) Home Improvement Loans E) Loans on Dwellings For 5+ Families F) Non-occupant Loans on Number Average Value Number Average Value Number Average Value Number Average Value Number Average Value Number Average Value
LOANS ORIGINATED 253 $133,390 1,917 $146,497 6,655 $137,891 132 $29,019 8 $841,482 399 $117,320 APPLICATIONS APPROVED, NOT ACCEPTED 7 $154,624 152 $140,522 575 $138,709 30 $45,811 0 $0 28 $113,555 APPLICATIONS DENIED 23 $137,507 230 $147,828 1,171 $144,908 87 $33,102 3 $2,015,103 50 $126,057 APPLICATIONS WITHDRAWN 15 $134,307 192 $131,593 953 $141,376 25 $49,137 0 $0 45 $135,595 FILES CLOSED FOR INCOMPLETENESS 6 $128,313 30 $135,302 211 $155,748 10 $36,095 0 $0 9 $132,067
Aggregated Statistics For Year 2002(Based on 3 full and 3 partial tracts) A) FHA, FSA/RHS & VA B) Conventional C) Refinancings D) Home Improvement Loans E) Loans on Dwellings For 5+ Families F) Non-occupant Loans on Number Average Value Number Average Value Number Average Value Number Average Value Number Average Value Number Average Value
LOANS ORIGINATED 100 $118,983 424 $120,587 1,238 $115,225 40 $28,837 1 $203,960 144 $111,876 APPLICATIONS APPROVED, NOT ACCEPTED 3 $113,333 35 $123,132 133 $111,880 10 $26,574 0 $0 11 $124,568 APPLICATIONS DENIED 8 $97,896 42 $89,205 215 $109,636 23 $18,115 0 $0 9 $97,410 APPLICATIONS WITHDRAWN 7 $121,494 37 $123,591 273 $115,293 5 $27,702 0 $0 16 $116,844 FILES CLOSED FOR INCOMPLETENESS 0 $0 18 $128,742 72 $115,436 0 $0 0 $0 3 $87,147
Aggregated Statistics For Year 2001(Based on 3 full and 3 partial tracts) A) FHA, FSA/RHS & VA B) Conventional C) Refinancings D) Home Improvement Loans E) Loans on Dwellings For 5+ Families F) Non-occupant Loans on Number Average Value Number Average Value Number Average Value Number Average Value Number Average Value Number Average Value
LOANS ORIGINATED 125 $111,881 378 $117,712 972 $110,941 63 $31,641 6 $785,678 111 $112,729 APPLICATIONS APPROVED, NOT ACCEPTED 4 $90,952 35 $102,954 96 $103,080 18 $21,533 0 $0 7 $113,221 APPLICATIONS DENIED 4 $117,312 40 $103,451 254 $103,872 29 $16,362 0 $0 9 $141,719 APPLICATIONS WITHDRAWN 7 $102,973 34 $115,451 190 $106,493 16 $26,066 0 $0 15 $105,074 FILES CLOSED FOR INCOMPLETENESS 0 $0 8 $119,192 58 $109,673 1 $26,160 0 $0 2 $110,340
Aggregated Statistics For Year 2000(Based on 3 full and 3 partial tracts) A) FHA, FSA/RHS & VA B) Conventional C) Refinancings D) Home Improvement Loans E) Loans on Dwellings For 5+ Families F) Non-occupant Loans on Number Average Value Number Average Value Number Average Value Number Average Value Number Average Value Number Average Value
LOANS ORIGINATED 120 $101,759 357 $114,968 267 $92,022 43 $19,087 2 $627,500 57 $84,172 APPLICATIONS APPROVED, NOT ACCEPTED 3 $87,333 35 $117,722 44 $93,322 16 $23,875 0 $0 3 $91,753 APPLICATIONS DENIED 5 $103,402 47 $98,391 109 $79,941 28 $19,344 0 $0 9 $89,723 APPLICATIONS WITHDRAWN 4 $116,412 30 $101,477 70 $91,229 8 $45,329 0 $0 2 $80,560 FILES CLOSED FOR INCOMPLETENESS 1 $95,950 7 $160,766 39 $101,940 0 $0 0 $0 2 $74,000
Aggregated Statistics For Year 1999(Based on 5 full and 5 partial tracts) A) FHA, FSA/RHS & VA B) Conventional C) Refinancings D) Home Improvement Loans E) Loans on Dwellings For 5+ Families F) Non-occupant Loans on Number Average Value Number Average Value Number Average Value Number Average Value Number Average Value Number Average Value
LOANS ORIGINATED 368 $106,787 1,354 $125,852 1,409 $101,446 154 $17,328 5 $620,096 130 $99,972 APPLICATIONS APPROVED, NOT ACCEPTED 11 $101,448 110 $114,794 187 $88,909 27 $31,604 0 $0 21 $79,435 APPLICATIONS DENIED 25 $97,572 202 $98,560 369 $109,073 82 $19,131 0 $0 28 $109,248 APPLICATIONS WITHDRAWN 21 $105,075 117 $116,370 250 $107,152 24 $58,757 0 $0 21 $118,891 FILES CLOSED FOR INCOMPLETENESS 2 $87,405 18 $138,266 59 $139,133 1 $6,830 0 $0 2 $85,180
Detailed mortgage data for all 15 tracts in Lee s Summit, MO
Private Mortgage Insurance Companies Aggregated Statistics For Year 2009(Based on 8 full and 7 partial tracts) A) Conventional B) Refinancings C) Non-occupant Loans on Number Average Value Number Average Value Number Average Value
LOANS ORIGINATED 146 $200,761 159 $197,937 2 $160,065 APPLICATIONS APPROVED, NOT ACCEPTED 32 $209,787 44 $232,603 0 $0 APPLICATIONS DENIED 20 $199,471 22 $216,331 1 $256,130 APPLICATIONS WITHDRAWN 11 $209,829 8 $204,958 0 $0 FILES CLOSED FOR INCOMPLETENESS 5 $132,694 2 $150,925 0 $0
Aggregated Statistics For Year 2008(Based on 8 full and 7 partial tracts) A) Conventional B) Refinancings C) Non-occupant Loans on Number Average Value Number Average Value Number Average Value
LOANS ORIGINATED 337 $184,181 202 $200,773 20 $149,054 APPLICATIONS APPROVED, NOT ACCEPTED 76 $176,684 84 $223,950 10 $104,208 APPLICATIONS DENIED 16 $171,974 11 $274,932 7 $139,021 APPLICATIONS WITHDRAWN 9 $156,341 10 $197,491 2 $63,145 FILES CLOSED FOR INCOMPLETENESS 12 $192,859 5 $237,356 4 $148,718
Aggregated Statistics For Year 2007(Based on 8 full and 7 partial tracts) A) Conventional B) Refinancings C) Non-occupant Loans on Number Average Value Number Average Value Number Average Value
LOANS ORIGINATED 495 $168,977 212 $192,564 36 $149,072 APPLICATIONS APPROVED, NOT ACCEPTED 61 $182,057 53 $176,113 5 $117,848 APPLICATIONS DENIED 3 $186,797 3 $317,007 2 $305,600 APPLICATIONS WITHDRAWN 18 $202,670 10 $192,242 3 $96,000 FILES CLOSED FOR INCOMPLETENESS 5 $268,662 1 $263,430 0 $0
Aggregated Statistics For Year 2006(Based on 8 full and 7 partial tracts) A) Conventional B) Refinancings C) Non-occupant Loans on D) Loans On Manufactured Number Average Value Number Average Value Number Average Value Number Average Value
LOANS ORIGINATED 352 $169,318 135 $185,635 21 $171,652 1 $126,600 APPLICATIONS APPROVED, NOT ACCEPTED 40 $162,734 56 $199,459 10 $169,533 0 $0 APPLICATIONS DENIED 7 $168,527 4 $465,092 4 $458,398 0 $0 APPLICATIONS WITHDRAWN 11 $176,514 20 $179,297 1 $391,900 0 $0 FILES CLOSED FOR INCOMPLETENESS 4 $124,030 0 $0 1 $85,000 0 $0
Aggregated Statistics For Year 2005(Based on 8 full and 7 partial tracts) A) Conventional B) Refinancings C) Non-occupant Loans on Number Average Value Number Average Value Number Average Value
LOANS ORIGINATED 316 $164,481 204 $171,180 36 $113,400 APPLICATIONS APPROVED, NOT ACCEPTED 50 $165,327 54 $174,044 11 $125,463 APPLICATIONS DENIED 1 $123,340 2 $142,845 0 $0 APPLICATIONS WITHDRAWN 13 $171,220 25 $179,323 3 $123,913 FILES CLOSED FOR INCOMPLETENESS 3 $176,723 3 $199,900 2 $78,000
Aggregated Statistics For Year 2004(Based on 8 full and 7 partial tracts) A) Conventional B) Refinancings C) Non-occupant Loans on D) Loans On Manufactured Number Average Value Number Average Value Number Average Value Number Average Value
LOANS ORIGINATED 410 $162,998 292 $159,431 49 $123,288 1 $89,000 APPLICATIONS APPROVED, NOT ACCEPTED 53 $162,162 92 $148,792 9 $108,684 0 $0 APPLICATIONS DENIED 6 $107,152 5 $269,450 4 $86,528 0 $0 APPLICATIONS WITHDRAWN 15 $185,129 22 $135,256 3 $186,483 0 $0 FILES CLOSED FOR INCOMPLETENESS 3 $152,393 2 $101,360 0 $0 0 $0
Aggregated Statistics For Year 2003(Based on 8 full and 7 partial tracts) A) Conventional B) Refinancings C) Non-occupant Loans on Number Average Value Number Average Value Number Average Value
LOANS ORIGINATED 578 $149,384 796 $153,508 40 $110,126 APPLICATIONS APPROVED, NOT ACCEPTED 63 $152,049 189 $156,061 9 $122,663 APPLICATIONS DENIED 5 $194,046 8 $399,036 1 $261,680 APPLICATIONS WITHDRAWN 27 $147,725 41 $157,316 5 $142,068 FILES CLOSED FOR INCOMPLETENESS 2 $150,690 2 $191,610 2 $102,950
Aggregated Statistics For Year 2002(Based on 3 full and 3 partial tracts) A) Conventional B) Refinancings C) Non-occupant Loans on Number Average Value Number Average Value Number Average Value
LOANS ORIGINATED 144 $124,661 176 $128,089 24 $111,992 APPLICATIONS APPROVED, NOT ACCEPTED 13 $163,122 39 $137,221 4 $140,475 APPLICATIONS DENIED 1 $111,560 2 $138,265 0 $0 APPLICATIONS WITHDRAWN 6 $102,595 14 $129,769 2 $114,970 FILES CLOSED FOR INCOMPLETENESS 0 $0 1 $110,840 0 $0
Aggregated Statistics For Year 2001(Based on 3 full and 3 partial tracts) A) Conventional B) Refinancings C) Non-occupant Loans on Number Average Value Number Average Value Number Average Value
LOANS ORIGINATED 137 $130,161 161 $130,510 12 $104,212 APPLICATIONS APPROVED, NOT ACCEPTED 20 $129,584 24 $129,447 7 $88,429 APPLICATIONS DENIED 0 $0 4 $141,710 0 $0 APPLICATIONS WITHDRAWN 3 $125,310 5 $84,240 0 $0 FILES CLOSED FOR INCOMPLETENESS 0 $0 0 $0 0 $0
Aggregated Statistics For Year 2000(Based on 3 full and 3 partial tracts) A) Conventional B) Refinancings C) Non-occupant Loans on Number Average Value Number Average Value Number Average Value
LOANS ORIGINATED 123 $129,535 31 $114,814 6 $103,900 APPLICATIONS APPROVED, NOT ACCEPTED 12 $124,802 6 $111,822 0 $0 APPLICATIONS DENIED 4 $102,872 2 $118,245 0 $0 APPLICATIONS WITHDRAWN 6 $119,905 0 $0 1 $85,000 FILES CLOSED FOR INCOMPLETENESS 3 $84,213 0 $0 0 $0
Aggregated Statistics For Year 1999(Based on 5 full and 5 partial tracts) A) Conventional B) Refinancings C) Non-occupant Loans on Number Average Value Number Average Value Number Average Value
LOANS ORIGINATED 495 $128,118 155 $122,247 13 $78,825 APPLICATIONS APPROVED, NOT ACCEPTED 47 $148,388 25 $139,206 3 $166,880 APPLICATIONS DENIED 13 $122,350 9 $118,769 0 $0 APPLICATIONS WITHDRAWN 10 $157,588 5 $101,198 2 $138,410 FILES CLOSED FOR INCOMPLETENESS 5 $131,336 1 $91,580 0 $0
Lee's Summit compared to Missouri state average:
Median house value above state average. Unemployed percentage significantly below state average. Hispanic race population percentage above state average. Length of stay since moving in below state average. House age below state average. Percentage of population with a bachelor's degree or higher above state average. Lee's Summit on our top lists :
#5 on the list of "Top 101 cities with largest percentage of females in industries: information (population 50,000+)"
#20 on the list of "Top 101 cities with most building permits per 10,000 residents (population 50,000+)"
#34 on the list of "Top 101 cities with the highest percentage of English-only speaking households, population 50,000+"
#41 on the list of "Top 101 cities with largest percentage of males in occupations: sales and related occupations (population 50,000+)"
#50 on the list of "Top 101 cities with the largest percentage of one, detached housing units in structures (20,000+ housing units)"
#58 on the list of "Top 101 cities with largest percentage of males in industries: wholesale trade (population 50,000+)"
#58 on the list of "Top 100 cities with biggest houses (pop. 50,000+)"
#64 on the list of "Top 101 cities with largest percentage of males in occupations: management occupations (population 50,000+)"
#67 on the list of "Top 101 cities with the smallest differences between morning and afternoon humidity (population 50,000+)"
#67 on the list of "Top 101 cities with the smallest humidity differences during a year (population 50,000+)"
#68 on the list of "Top 101 cities with the lowest number of burglaries per 100,000 residents (population 50,000+)"
#74 on the list of "Top 101 cities with the largest temperature differences during a year (population 50,000+)"
#75 on the list of "Top 101 cities with largest percentage of females in occupations: office and administrative support occupations (population 50,000+)"
#77 on the list of "Top 101 cities with the most local government spending on highway construction per resident (population 10,000+)"
#80 on the list of "Top 101 cities with largest percentage population increases in the 1990s) (population 50,000+)"
#81 on the list of "Top 101 cities with the least people below 50% of the poverty level (population 50,000+)"
#81 on the list of "Top 101 cities with the lowest number of robberies per 100,000 residents (population 50,000+)"
#81 on the list of "Top 100 safest cities (lowest city-data.com crime index) (pop. 50,000+)"
#87 on the list of "Top 101 cities with largest percentage of females in industries: other services, except public administration (population 50,000+)"
#94 on the list of "Top 101 cities with the least people below the poverty level (population 50,000+)"
#4 on the list of "Top 101 counties with the highest Sulfur Oxides Annual air pollution readings in 2012 (µg/m3 )"
#20 on the list of "Top 101 counties with the highest Particulate Matter (PM10 ) Annual air pollution readings in 2012 (µg/m3 )"
#25 on the list of "Top 101 counties with the most Black Protestant adherents"
#26 on the list of "Top 101 counties with the most Black Protestant congregations"
#37 on the list of "Top 101 counties with the lowest surface withdrawal of fresh water for public supply (pop. 50,000+)"
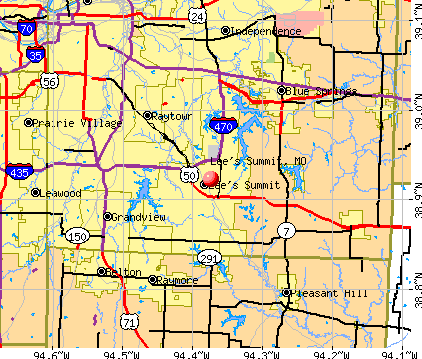


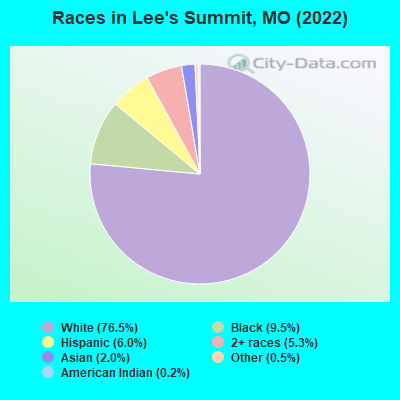
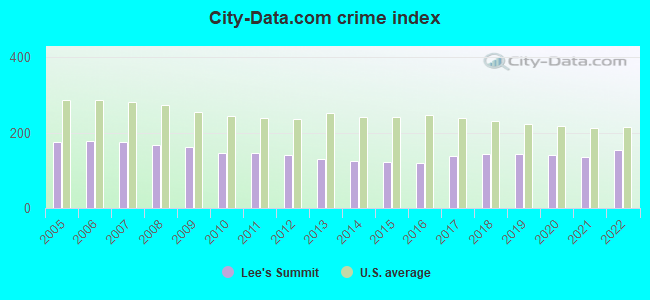
 Recent articles from our blog. Our writers, many of them Ph.D. graduates or candidates, create easy-to-read articles on a wide variety of topics.

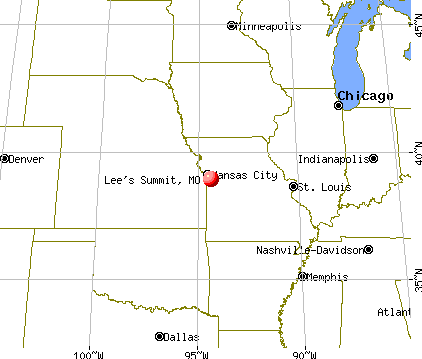
 (14.4 miles
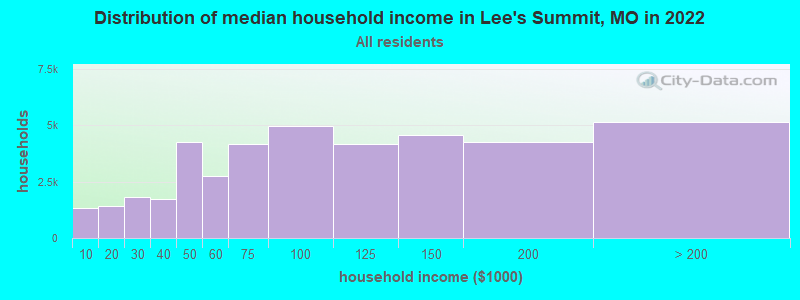
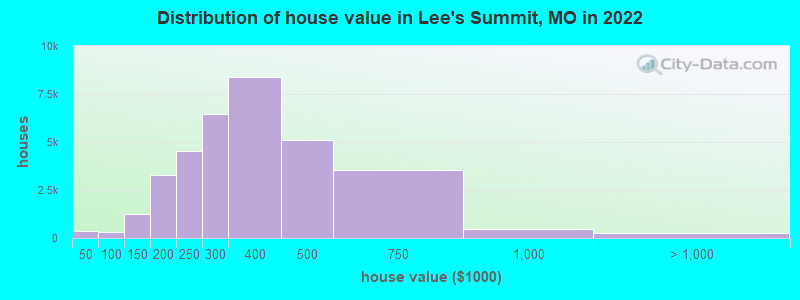
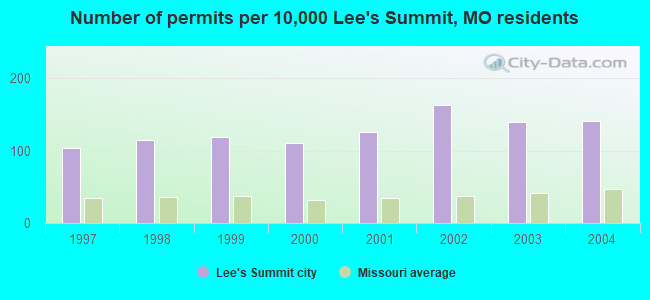
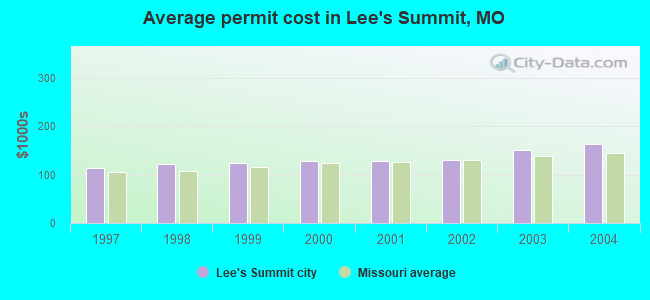
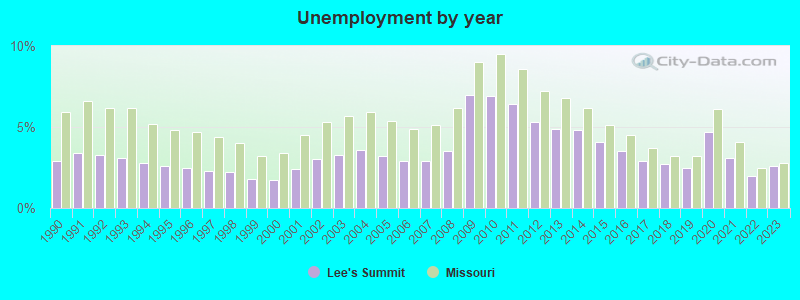
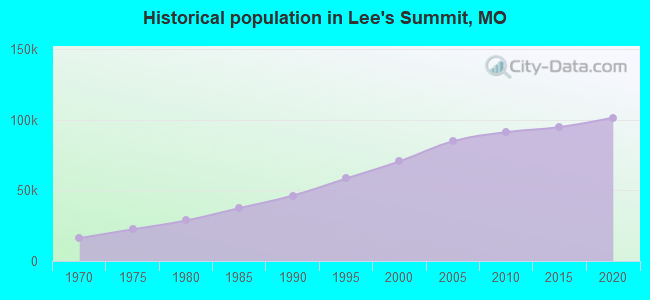
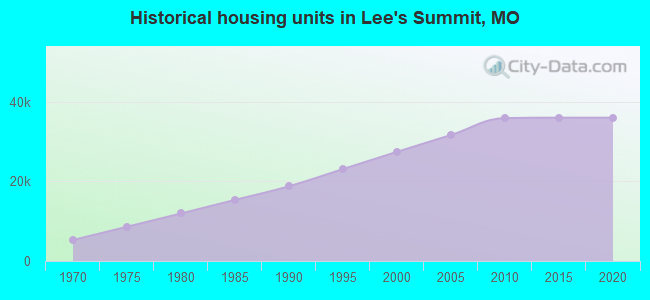
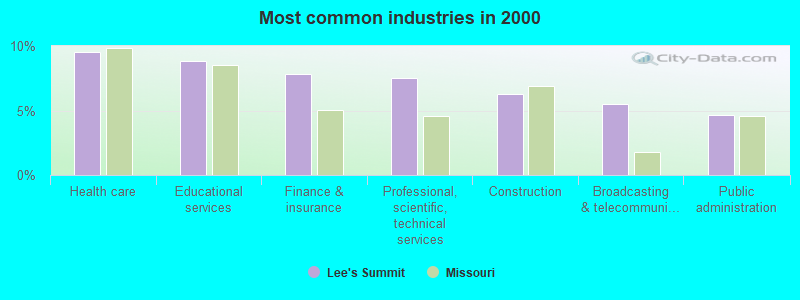
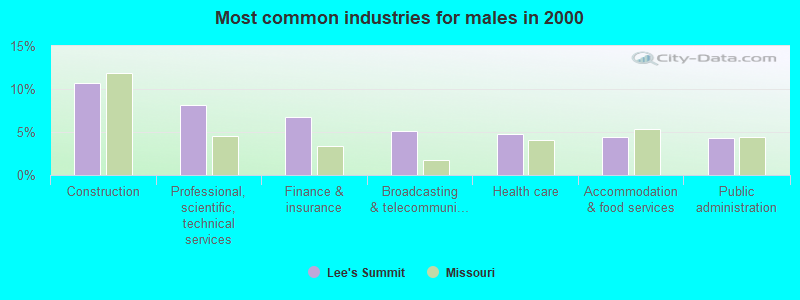
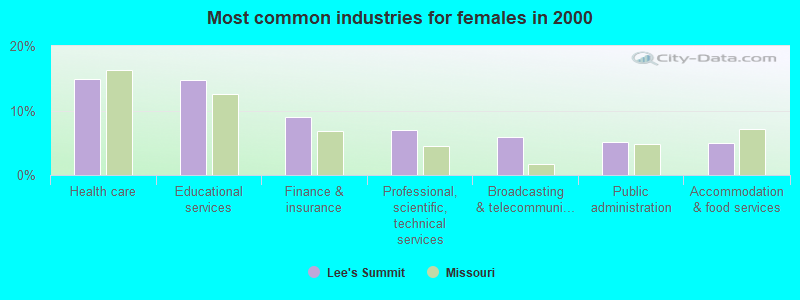
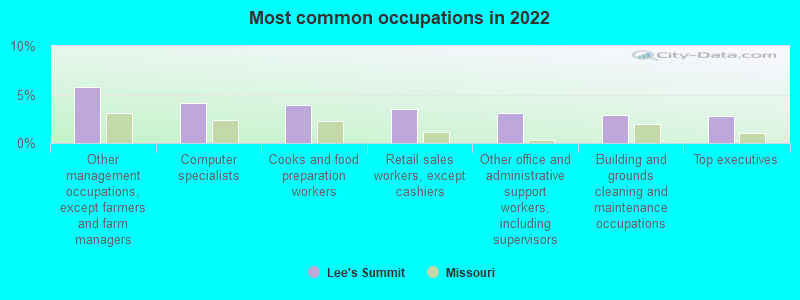
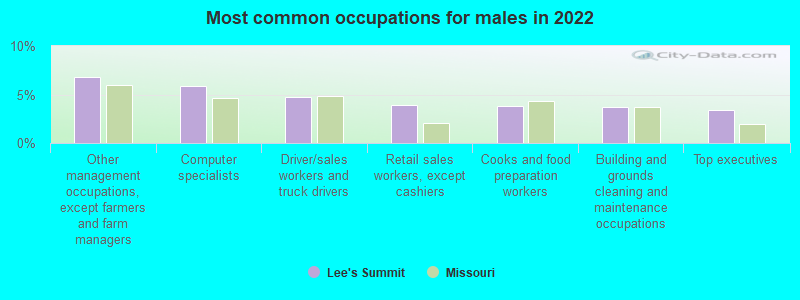
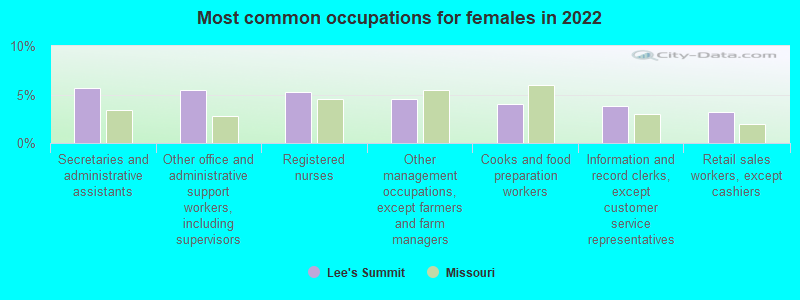


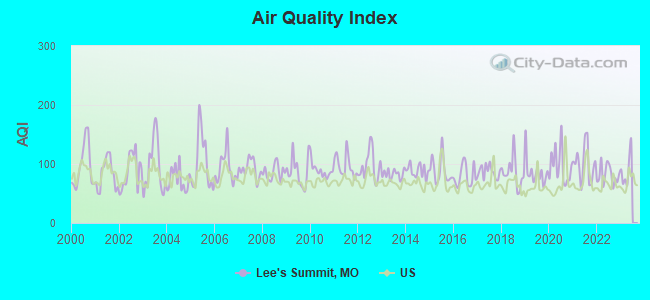
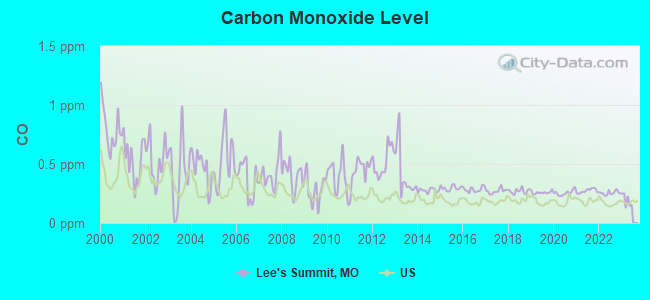
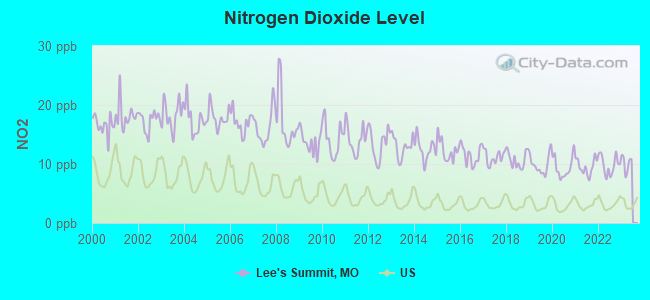
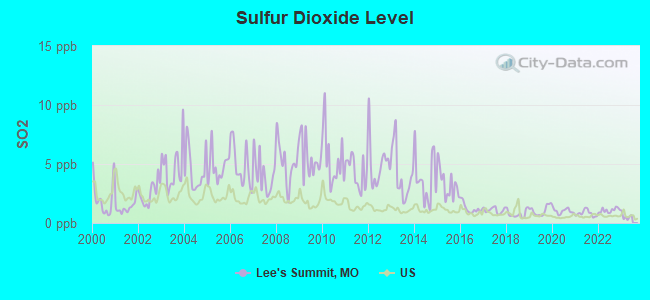
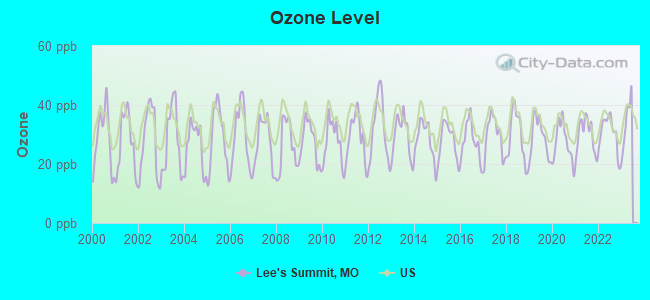
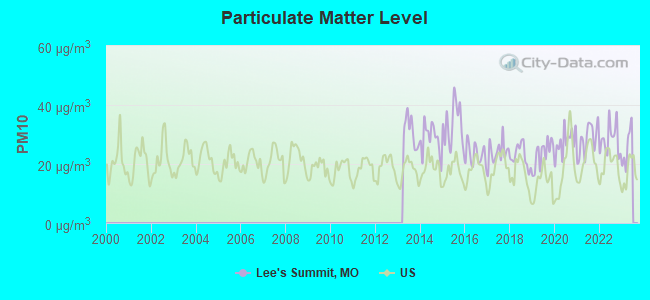
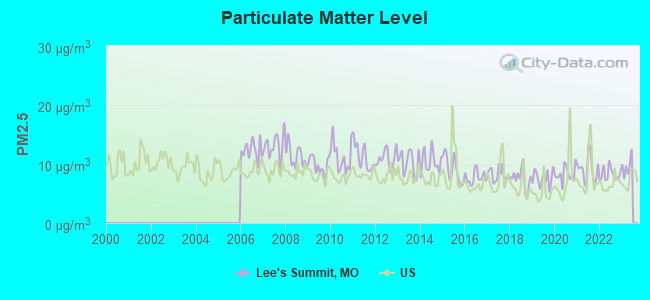

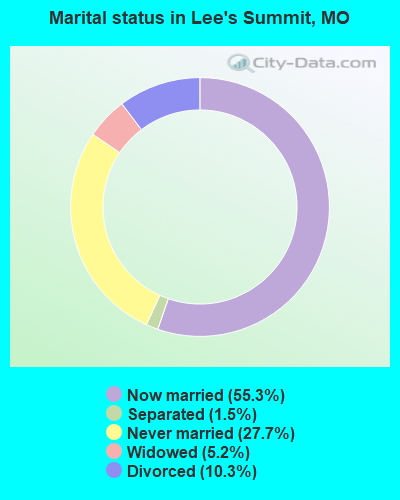
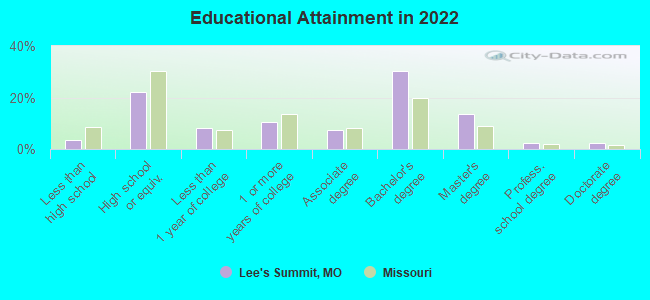
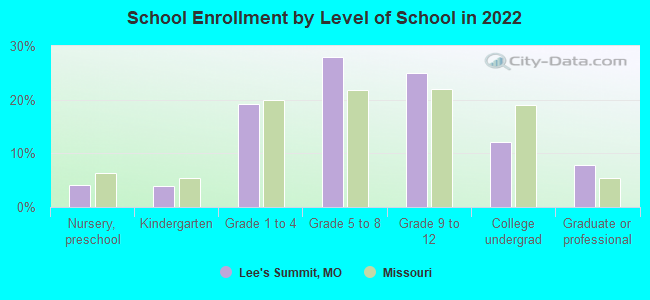
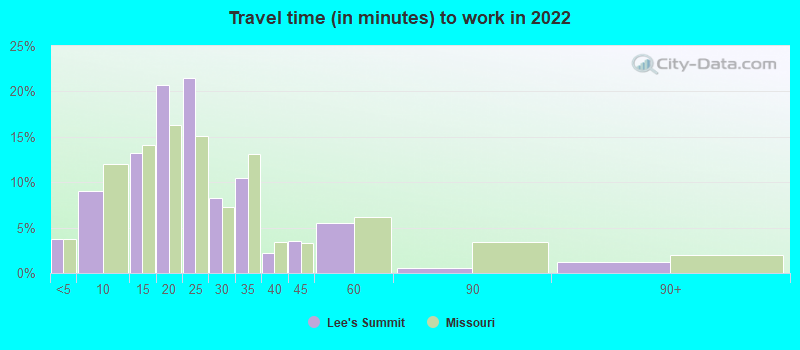
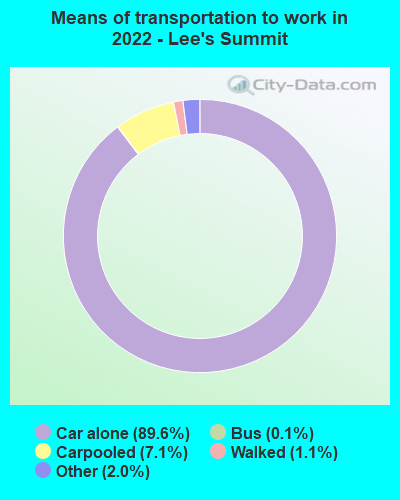
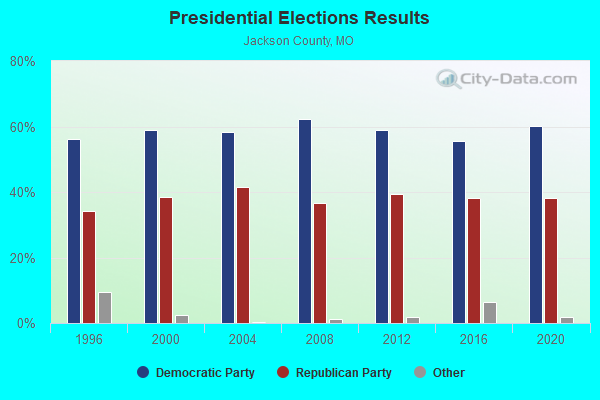
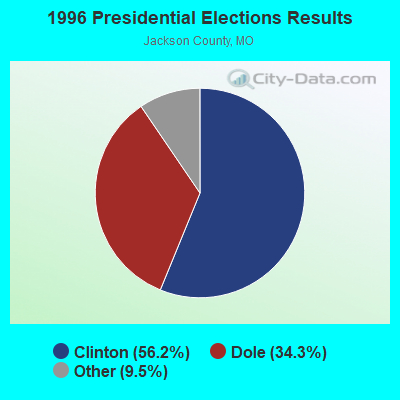
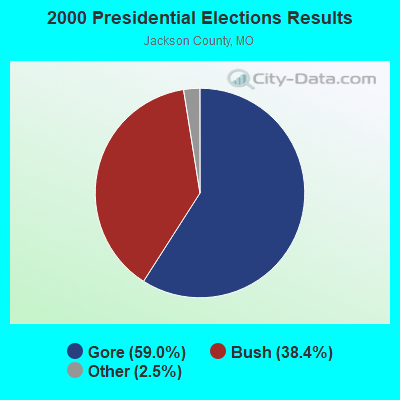
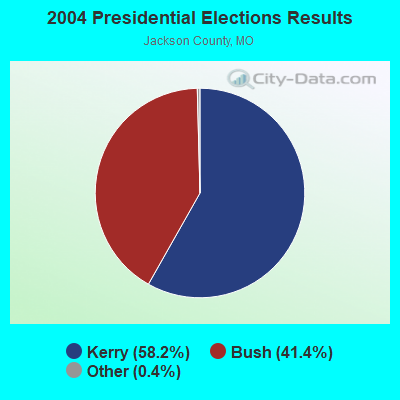
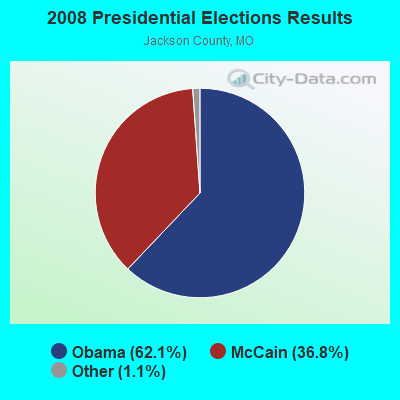
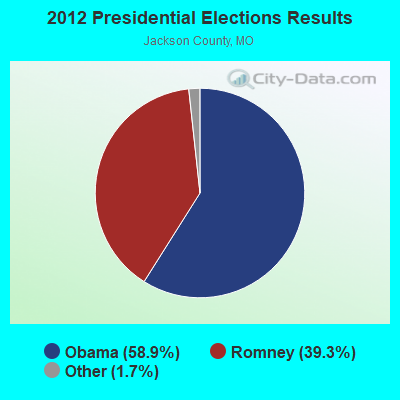
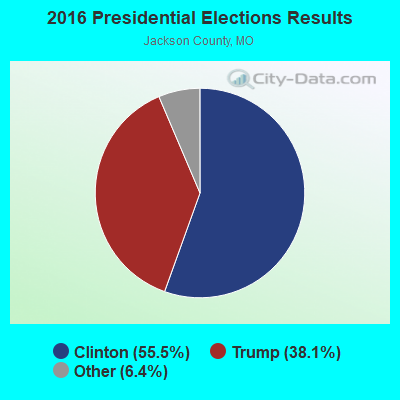
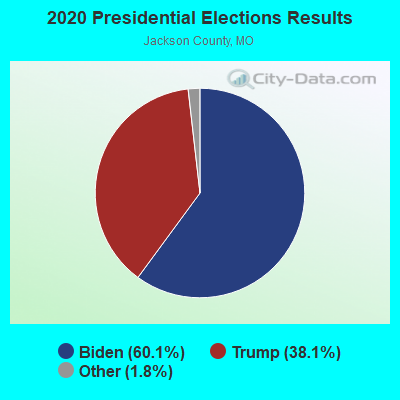
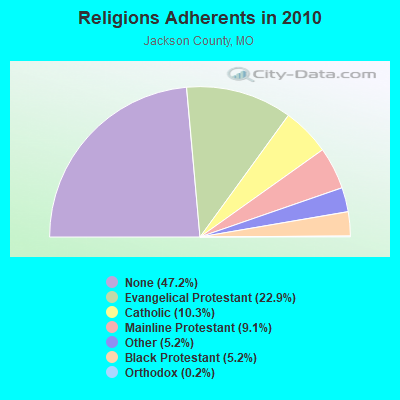
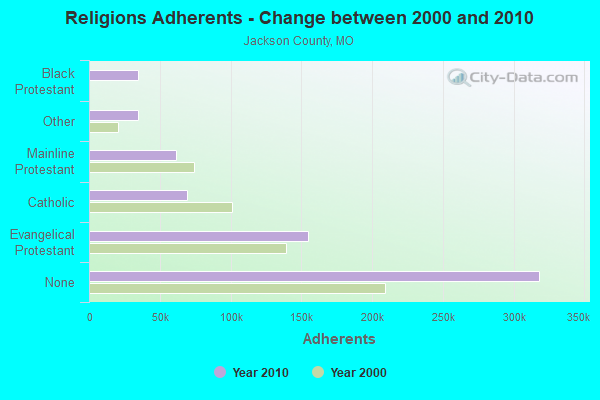
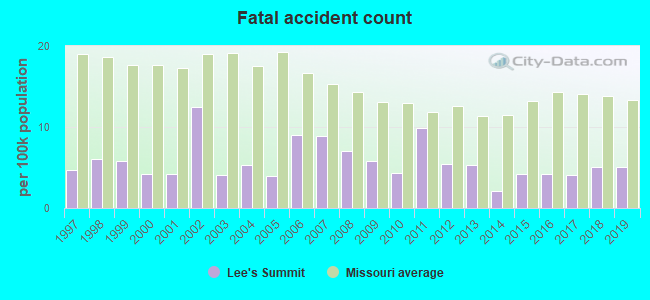
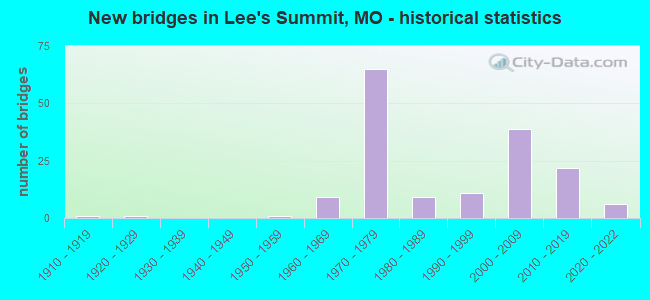
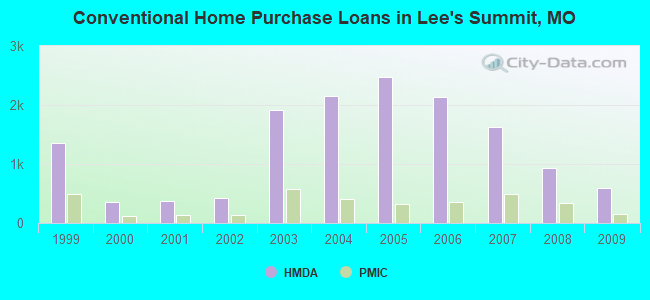
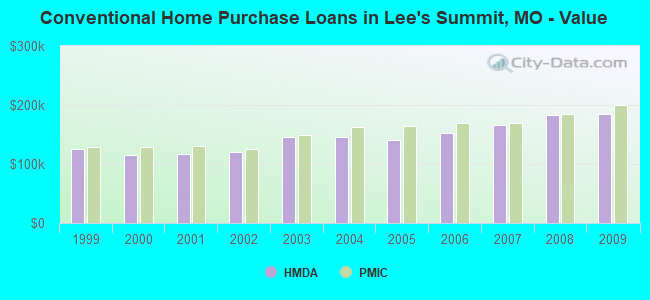
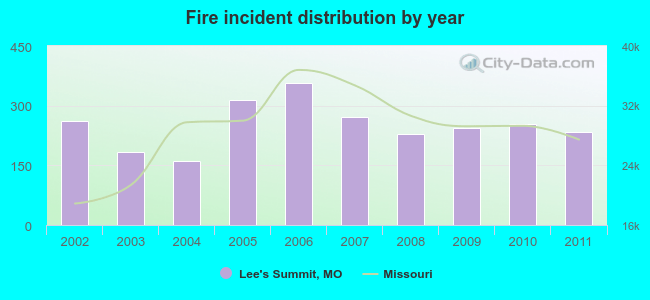 According to the data from the years 2002 - 2011 the average number of fire incidents per year is 251. The highest number of reported fire incidents - 358 took place in 2006, and the least - 161 in 2004. The data has a dropping trend.
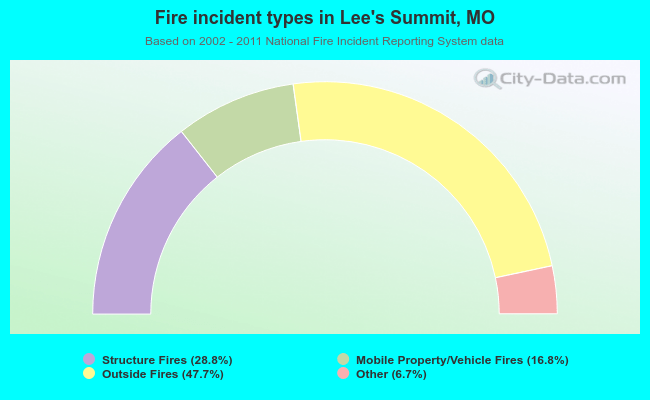 When looking into fire subcategories, the most incidents belonged to: Outside Fires (47.7%), and Structure Fires (28.8%).