Blue Springs, Missouri Submit your own pictures of this city and show them to the world
OSM Map
General Map
Google Map
MSN Map
OSM Map
General Map
Google Map
MSN Map
OSM Map
General Map
Google Map
MSN Map
OSM Map
General Map
Google Map
MSN Map
Please wait while loading the map...
Population in 2022: 59,518 (100% urban, 0% rural). Population change since 2000: +23.8%Males: 28,750 Females: 30,768
March 2022 cost of living index in Blue Springs: 86.9 (less than average, U.S. average is 100) Percentage of residents living in poverty in 2022: 6.4%for White Non-Hispanic residents , 6.6% for Black residents , 14.2% for Hispanic or Latino residents , 2.2% for other race residents , 12.9% for two or more races residents )
Profiles of local businesses
Business Search - 14 Million verified businesses
Data:
Median household income ($)
Median household income (% change since 2000)
Household income diversity
Ratio of average income to average house value (%)
Ratio of average income to average rent
Median household income ($) - White
Median household income ($) - Black or African American
Median household income ($) - Asian
Median household income ($) - Hispanic or Latino
Median household income ($) - American Indian and Alaska Native
Median household income ($) - Multirace
Median household income ($) - Other Race
Median household income for houses/condos with a mortgage ($)
Median household income for apartments without a mortgage ($)
Races - White alone (%)
Races - White alone (% change since 2000)
Races - Black alone (%)
Races - Black alone (% change since 2000)
Races - American Indian alone (%)
Races - American Indian alone (% change since 2000)
Races - Asian alone (%)
Races - Asian alone (% change since 2000)
Races - Hispanic (%)
Races - Hispanic (% change since 2000)
Races - Native Hawaiian and Other Pacific Islander alone (%)
Races - Native Hawaiian and Other Pacific Islander alone (% change since 2000)
Races - Two or more races (%)
Races - Two or more races (% change since 2000)
Races - Other race alone (%)
Races - Other race alone (% change since 2000)
Racial diversity
Unemployment (%)
Unemployment (% change since 2000)
Unemployment (%) - White
Unemployment (%) - Black or African American
Unemployment (%) - Asian
Unemployment (%) - Hispanic or Latino
Unemployment (%) - American Indian and Alaska Native
Unemployment (%) - Multirace
Unemployment (%) - Other Race
Population density (people per square mile)
Population - Males (%)
Population - Females (%)
Population - Males (%) - White
Population - Males (%) - Black or African American
Population - Males (%) - Asian
Population - Males (%) - Hispanic or Latino
Population - Males (%) - American Indian and Alaska Native
Population - Males (%) - Multirace
Population - Males (%) - Other Race
Population - Females (%) - White
Population - Females (%) - Black or African American
Population - Females (%) - Asian
Population - Females (%) - Hispanic or Latino
Population - Females (%) - American Indian and Alaska Native
Population - Females (%) - Multirace
Population - Females (%) - Other Race
Coronavirus confirmed cases (Apr 27, 2024)
Deaths caused by coronavirus (Apr 27, 2024)
Coronavirus confirmed cases (per 100k population) (Apr 27, 2024)
Deaths caused by coronavirus (per 100k population) (Apr 27, 2024)
Daily increase in number of cases (Apr 27, 2024)
Weekly increase in number of cases (Apr 27, 2024)
Cases doubled (in days) (Apr 27, 2024)
Hospitalized patients (Apr 18, 2022)
Negative test results (Apr 18, 2022)
Total test results (Apr 18, 2022)
COVID Vaccine doses distributed (per 100k population) (Sep 19, 2023)
COVID Vaccine doses administered (per 100k population) (Sep 19, 2023)
COVID Vaccine doses distributed (Sep 19, 2023)
COVID Vaccine doses administered (Sep 19, 2023)
Likely homosexual households (%)
Likely homosexual households (% change since 2000)
Likely homosexual households - Lesbian couples (%)
Likely homosexual households - Lesbian couples (% change since 2000)
Likely homosexual households - Gay men (%)
Likely homosexual households - Gay men (% change since 2000)
Cost of living index
Median gross rent ($)
Median contract rent ($)
Median monthly housing costs ($)
Median house or condo value ($)
Median house or condo value ($ change since 2000)
Mean house or condo value by units in structure - 1, detached ($)
Mean house or condo value by units in structure - 1, attached ($)
Mean house or condo value by units in structure - 2 ($)
Mean house or condo value by units in structure by units in structure - 3 or 4 ($)
Mean house or condo value by units in structure - 5 or more ($)
Mean house or condo value by units in structure - Boat, RV, van, etc. ($)
Mean house or condo value by units in structure - Mobile home ($)
Median house or condo value ($) - White
Median house or condo value ($) - Black or African American
Median house or condo value ($) - Asian
Median house or condo value ($) - Hispanic or Latino
Median house or condo value ($) - American Indian and Alaska Native
Median house or condo value ($) - Multirace
Median house or condo value ($) - Other Race
Median resident age
Resident age diversity
Median resident age - Males
Median resident age - Females
Median resident age - White
Median resident age - Black or African American
Median resident age - Asian
Median resident age - Hispanic or Latino
Median resident age - American Indian and Alaska Native
Median resident age - Multirace
Median resident age - Other Race
Median resident age - Males - White
Median resident age - Males - Black or African American
Median resident age - Males - Asian
Median resident age - Males - Hispanic or Latino
Median resident age - Males - American Indian and Alaska Native
Median resident age - Males - Multirace
Median resident age - Males - Other Race
Median resident age - Females - White
Median resident age - Females - Black or African American
Median resident age - Females - Asian
Median resident age - Females - Hispanic or Latino
Median resident age - Females - American Indian and Alaska Native
Median resident age - Females - Multirace
Median resident age - Females - Other Race
Commute - mean travel time to work (minutes)
Travel time to work - Less than 5 minutes (%)
Travel time to work - Less than 5 minutes (% change since 2000)
Travel time to work - 5 to 9 minutes (%)
Travel time to work - 5 to 9 minutes (% change since 2000)
Travel time to work - 10 to 19 minutes (%)
Travel time to work - 10 to 19 minutes (% change since 2000)
Travel time to work - 20 to 29 minutes (%)
Travel time to work - 20 to 29 minutes (% change since 2000)
Travel time to work - 30 to 39 minutes (%)
Travel time to work - 30 to 39 minutes (% change since 2000)
Travel time to work - 40 to 59 minutes (%)
Travel time to work - 40 to 59 minutes (% change since 2000)
Travel time to work - 60 to 89 minutes (%)
Travel time to work - 60 to 89 minutes (% change since 2000)
Travel time to work - 90 or more minutes (%)
Travel time to work - 90 or more minutes (% change since 2000)
Marital status - Never married (%)
Marital status - Now married (%)
Marital status - Separated (%)
Marital status - Widowed (%)
Marital status - Divorced (%)
Median family income ($)
Median family income (% change since 2000)
Median non-family income ($)
Median non-family income (% change since 2000)
Median per capita income ($)
Median per capita income (% change since 2000)
Median family income ($) - White
Median family income ($) - Black or African American
Median family income ($) - Asian
Median family income ($) - Hispanic or Latino
Median family income ($) - American Indian and Alaska Native
Median family income ($) - Multirace
Median family income ($) - Other Race
Median year house/condo built
Median year apartment built
Year house built - Built 2005 or later (%)
Year house built - Built 2000 to 2004 (%)
Year house built - Built 1990 to 1999 (%)
Year house built - Built 1980 to 1989 (%)
Year house built - Built 1970 to 1979 (%)
Year house built - Built 1960 to 1969 (%)
Year house built - Built 1950 to 1959 (%)
Year house built - Built 1940 to 1949 (%)
Year house built - Built 1939 or earlier (%)
Average household size
Household density (households per square mile)
Average household size - White
Average household size - Black or African American
Average household size - Asian
Average household size - Hispanic or Latino
Average household size - American Indian and Alaska Native
Average household size - Multirace
Average household size - Other Race
Occupied housing units (%)
Vacant housing units (%)
Owner occupied housing units (%)
Renter occupied housing units (%)
Vacancy status - For rent (%)
Vacancy status - For sale only (%)
Vacancy status - Rented or sold, not occupied (%)
Vacancy status - For seasonal, recreational, or occasional use (%)
Vacancy status - For migrant workers (%)
Vacancy status - Other vacant (%)
Residents with income below the poverty level (%)
Residents with income below 50% of the poverty level (%)
Children below poverty level (%)
Poor families by family type - Married-couple family (%)
Poor families by family type - Male, no wife present (%)
Poor families by family type - Female, no husband present (%)
Poverty status for native-born residents (%)
Poverty status for foreign-born residents (%)
Poverty among high school graduates not in families (%)
Poverty among people who did not graduate high school not in families (%)
Residents with income below the poverty level (%) - White
Residents with income below the poverty level (%) - Black or African American
Residents with income below the poverty level (%) - Asian
Residents with income below the poverty level (%) - Hispanic or Latino
Residents with income below the poverty level (%) - American Indian and Alaska Native
Residents with income below the poverty level (%) - Multirace
Residents with income below the poverty level (%) - Other Race
Air pollution - Air Quality Index (AQI)
Air pollution - CO
Air pollution - NO2
Air pollution - SO2
Air pollution - Ozone
Air pollution - PM10
Air pollution - PM25
Air pollution - Pb
Crime - Murders per 100,000 population
Crime - Rapes per 100,000 population
Crime - Robberies per 100,000 population
Crime - Assaults per 100,000 population
Crime - Burglaries per 100,000 population
Crime - Thefts per 100,000 population
Crime - Auto thefts per 100,000 population
Crime - Arson per 100,000 population
Crime - City-data.com crime index
Crime - Violent crime index
Crime - Property crime index
Crime - Murders per 100,000 population (5 year average)
Crime - Rapes per 100,000 population (5 year average)
Crime - Robberies per 100,000 population (5 year average)
Crime - Assaults per 100,000 population (5 year average)
Crime - Burglaries per 100,000 population (5 year average)
Crime - Thefts per 100,000 population (5 year average)
Crime - Auto thefts per 100,000 population (5 year average)
Crime - Arson per 100,000 population (5 year average)
Crime - City-data.com crime index (5 year average)
Crime - Violent crime index (5 year average)
Crime - Property crime index (5 year average)
1996 Presidential Elections Results (%) - Democratic Party (Clinton)
1996 Presidential Elections Results (%) - Republican Party (Dole)
1996 Presidential Elections Results (%) - Other
2000 Presidential Elections Results (%) - Democratic Party (Gore)
2000 Presidential Elections Results (%) - Republican Party (Bush)
2000 Presidential Elections Results (%) - Other
2004 Presidential Elections Results (%) - Democratic Party (Kerry)
2004 Presidential Elections Results (%) - Republican Party (Bush)
2004 Presidential Elections Results (%) - Other
2008 Presidential Elections Results (%) - Democratic Party (Obama)
2008 Presidential Elections Results (%) - Republican Party (McCain)
2008 Presidential Elections Results (%) - Other
2012 Presidential Elections Results (%) - Democratic Party (Obama)
2012 Presidential Elections Results (%) - Republican Party (Romney)
2012 Presidential Elections Results (%) - Other
2016 Presidential Elections Results (%) - Democratic Party (Clinton)
2016 Presidential Elections Results (%) - Republican Party (Trump)
2016 Presidential Elections Results (%) - Other
2020 Presidential Elections Results (%) - Democratic Party (Biden)
2020 Presidential Elections Results (%) - Republican Party (Trump)
2020 Presidential Elections Results (%) - Other
Ancestries Reported - Arab (%)
Ancestries Reported - Czech (%)
Ancestries Reported - Danish (%)
Ancestries Reported - Dutch (%)
Ancestries Reported - English (%)
Ancestries Reported - French (%)
Ancestries Reported - French Canadian (%)
Ancestries Reported - German (%)
Ancestries Reported - Greek (%)
Ancestries Reported - Hungarian (%)
Ancestries Reported - Irish (%)
Ancestries Reported - Italian (%)
Ancestries Reported - Lithuanian (%)
Ancestries Reported - Norwegian (%)
Ancestries Reported - Polish (%)
Ancestries Reported - Portuguese (%)
Ancestries Reported - Russian (%)
Ancestries Reported - Scotch-Irish (%)
Ancestries Reported - Scottish (%)
Ancestries Reported - Slovak (%)
Ancestries Reported - Subsaharan African (%)
Ancestries Reported - Swedish (%)
Ancestries Reported - Swiss (%)
Ancestries Reported - Ukrainian (%)
Ancestries Reported - United States (%)
Ancestries Reported - Welsh (%)
Ancestries Reported - West Indian (%)
Ancestries Reported - Other (%)
Educational Attainment - No schooling completed (%)
Educational Attainment - Less than high school (%)
Educational Attainment - High school or equivalent (%)
Educational Attainment - Less than 1 year of college (%)
Educational Attainment - 1 or more years of college (%)
Educational Attainment - Associate degree (%)
Educational Attainment - Bachelor's degree (%)
Educational Attainment - Master's degree (%)
Educational Attainment - Professional school degree (%)
Educational Attainment - Doctorate degree (%)
School Enrollment - Nursery, preschool (%)
School Enrollment - Kindergarten (%)
School Enrollment - Grade 1 to 4 (%)
School Enrollment - Grade 5 to 8 (%)
School Enrollment - Grade 9 to 12 (%)
School Enrollment - College undergrad (%)
School Enrollment - Graduate or professional (%)
School Enrollment - Not enrolled in school (%)
School enrollment - Public schools (%)
School enrollment - Private schools (%)
School enrollment - Not enrolled (%)
Median number of rooms in houses and condos
Median number of rooms in apartments
Housing units lacking complete plumbing facilities (%)
Housing units lacking complete kitchen facilities (%)
Density of houses
Urban houses (%)
Rural houses (%)
Households with people 60 years and over (%)
Households with people 65 years and over (%)
Households with people 75 years and over (%)
Households with one or more nonrelatives (%)
Households with no nonrelatives (%)
Population in households (%)
Family households (%)
Nonfamily households (%)
Population in families (%)
Family households with own children (%)
Median number of bedrooms in owner occupied houses
Mean number of bedrooms in owner occupied houses
Median number of bedrooms in renter occupied houses
Mean number of bedrooms in renter occupied houses
Median number of vehichles in owner occupied houses
Mean number of vehichles in owner occupied houses
Median number of vehichles in renter occupied houses
Mean number of vehichles in renter occupied houses
Mortgage status - with mortgage (%)
Mortgage status - with second mortgage (%)
Mortgage status - with home equity loan (%)
Mortgage status - with both second mortgage and home equity loan (%)
Mortgage status - without a mortgage (%)
Average family size
Average family size - White
Average family size - Black or African American
Average family size - Asian
Average family size - Hispanic or Latino
Average family size - American Indian and Alaska Native
Average family size - Multirace
Average family size - Other Race
Geographical mobility - Same house 1 year ago (%)
Geographical mobility - Moved within same county (%)
Geographical mobility - Moved from different county within same state (%)
Geographical mobility - Moved from different state (%)
Geographical mobility - Moved from abroad (%)
Place of birth - Born in state of residence (%)
Place of birth - Born in other state (%)
Place of birth - Native, outside of US (%)
Place of birth - Foreign born (%)
Housing units in structures - 1, detached (%)
Housing units in structures - 1, attached (%)
Housing units in structures - 2 (%)
Housing units in structures - 3 or 4 (%)
Housing units in structures - 5 to 9 (%)
Housing units in structures - 10 to 19 (%)
Housing units in structures - 20 to 49 (%)
Housing units in structures - 50 or more (%)
Housing units in structures - Mobile home (%)
Housing units in structures - Boat, RV, van, etc. (%)
House/condo owner moved in on average (years ago)
Renter moved in on average (years ago)
Year householder moved into unit - Moved in 1999 to March 2000 (%)
Year householder moved into unit - Moved in 1995 to 1998 (%)
Year householder moved into unit - Moved in 1990 to 1994 (%)
Year householder moved into unit - Moved in 1980 to 1989 (%)
Year householder moved into unit - Moved in 1970 to 1979 (%)
Year householder moved into unit - Moved in 1969 or earlier (%)
Means of transportation to work - Drove car alone (%)
Means of transportation to work - Carpooled (%)
Means of transportation to work - Public transportation (%)
Means of transportation to work - Bus or trolley bus (%)
Means of transportation to work - Streetcar or trolley car (%)
Means of transportation to work - Subway or elevated (%)
Means of transportation to work - Railroad (%)
Means of transportation to work - Ferryboat (%)
Means of transportation to work - Taxicab (%)
Means of transportation to work - Motorcycle (%)
Means of transportation to work - Bicycle (%)
Means of transportation to work - Walked (%)
Means of transportation to work - Other means (%)
Working at home (%)
Industry diversity
Most Common Industries - Agriculture, forestry, fishing and hunting, and mining (%)
Most Common Industries - Agriculture, forestry, fishing and hunting (%)
Most Common Industries - Mining, quarrying, and oil and gas extraction (%)
Most Common Industries - Construction (%)
Most Common Industries - Manufacturing (%)
Most Common Industries - Wholesale trade (%)
Most Common Industries - Retail trade (%)
Most Common Industries - Transportation and warehousing, and utilities (%)
Most Common Industries - Transportation and warehousing (%)
Most Common Industries - Utilities (%)
Most Common Industries - Information (%)
Most Common Industries - Finance and insurance, and real estate and rental and leasing (%)
Most Common Industries - Finance and insurance (%)
Most Common Industries - Real estate and rental and leasing (%)
Most Common Industries - Professional, scientific, and management, and administrative and waste management services (%)
Most Common Industries - Professional, scientific, and technical services (%)
Most Common Industries - Management of companies and enterprises (%)
Most Common Industries - Administrative and support and waste management services (%)
Most Common Industries - Educational services, and health care and social assistance (%)
Most Common Industries - Educational services (%)
Most Common Industries - Health care and social assistance (%)
Most Common Industries - Arts, entertainment, and recreation, and accommodation and food services (%)
Most Common Industries - Arts, entertainment, and recreation (%)
Most Common Industries - Accommodation and food services (%)
Most Common Industries - Other services, except public administration (%)
Most Common Industries - Public administration (%)
Occupation diversity
Most Common Occupations - Management, business, science, and arts occupations (%)
Most Common Occupations - Management, business, and financial occupations (%)
Most Common Occupations - Management occupations (%)
Most Common Occupations - Business and financial operations occupations (%)
Most Common Occupations - Computer, engineering, and science occupations (%)
Most Common Occupations - Computer and mathematical occupations (%)
Most Common Occupations - Architecture and engineering occupations (%)
Most Common Occupations - Life, physical, and social science occupations (%)
Most Common Occupations - Education, legal, community service, arts, and media occupations (%)
Most Common Occupations - Community and social service occupations (%)
Most Common Occupations - Legal occupations (%)
Most Common Occupations - Education, training, and library occupations (%)
Most Common Occupations - Arts, design, entertainment, sports, and media occupations (%)
Most Common Occupations - Healthcare practitioners and technical occupations (%)
Most Common Occupations - Health diagnosing and treating practitioners and other technical occupations (%)
Most Common Occupations - Health technologists and technicians (%)
Most Common Occupations - Service occupations (%)
Most Common Occupations - Healthcare support occupations (%)
Most Common Occupations - Protective service occupations (%)
Most Common Occupations - Fire fighting and prevention, and other protective service workers including supervisors (%)
Most Common Occupations - Law enforcement workers including supervisors (%)
Most Common Occupations - Food preparation and serving related occupations (%)
Most Common Occupations - Building and grounds cleaning and maintenance occupations (%)
Most Common Occupations - Personal care and service occupations (%)
Most Common Occupations - Sales and office occupations (%)
Most Common Occupations - Sales and related occupations (%)
Most Common Occupations - Office and administrative support occupations (%)
Most Common Occupations - Natural resources, construction, and maintenance occupations (%)
Most Common Occupations - Farming, fishing, and forestry occupations (%)
Most Common Occupations - Construction and extraction occupations (%)
Most Common Occupations - Installation, maintenance, and repair occupations (%)
Most Common Occupations - Production, transportation, and material moving occupations (%)
Most Common Occupations - Production occupations (%)
Most Common Occupations - Transportation occupations (%)
Most Common Occupations - Material moving occupations (%)
People in Group quarters - Institutionalized population (%)
People in Group quarters - Correctional institutions (%)
People in Group quarters - Federal prisons and detention centers (%)
People in Group quarters - Halfway houses (%)
People in Group quarters - Local jails and other confinement facilities (including police lockups) (%)
People in Group quarters - Military disciplinary barracks (%)
People in Group quarters - State prisons (%)
People in Group quarters - Other types of correctional institutions (%)
People in Group quarters - Nursing homes (%)
People in Group quarters - Hospitals/wards, hospices, and schools for the handicapped (%)
People in Group quarters - Hospitals/wards and hospices for chronically ill (%)
People in Group quarters - Hospices or homes for chronically ill (%)
People in Group quarters - Military hospitals or wards for chronically ill (%)
People in Group quarters - Other hospitals or wards for chronically ill (%)
People in Group quarters - Hospitals or wards for drug/alcohol abuse (%)
People in Group quarters - Mental (Psychiatric) hospitals or wards (%)
People in Group quarters - Schools, hospitals, or wards for the mentally retarded (%)
People in Group quarters - Schools, hospitals, or wards for the physically handicapped (%)
People in Group quarters - Institutions for the deaf (%)
People in Group quarters - Institutions for the blind (%)
People in Group quarters - Orthopedic wards and institutions for the physically handicapped (%)
People in Group quarters - Wards in general hospitals for patients who have no usual home elsewhere (%)
People in Group quarters - Wards in military hospitals for patients who have no usual home elsewhere (%)
People in Group quarters - Juvenile institutions (%)
People in Group quarters - Long-term care (%)
People in Group quarters - Homes for abused, dependent, and neglected children (%)
People in Group quarters - Residential treatment centers for emotionally disturbed children (%)
People in Group quarters - Training schools for juvenile delinquents (%)
People in Group quarters - Short-term care, detention or diagnostic centers for delinquent children (%)
People in Group quarters - Type of juvenile institution unknown (%)
People in Group quarters - Noninstitutionalized population (%)
People in Group quarters - College dormitories (includes college quarters off campus) (%)
People in Group quarters - Military quarters (%)
People in Group quarters - On base (%)
People in Group quarters - Barracks, unaccompanied personnel housing (UPH), (Enlisted/Officer), ;and similar group living quarters for military personnel (%)
People in Group quarters - Transient quarters for temporary residents (%)
People in Group quarters - Military ships (%)
People in Group quarters - Group homes (%)
People in Group quarters - Homes or halfway houses for drug/alcohol abuse (%)
People in Group quarters - Homes for the mentally ill (%)
People in Group quarters - Homes for the mentally retarded (%)
People in Group quarters - Homes for the physically handicapped (%)
People in Group quarters - Other group homes (%)
People in Group quarters - Religious group quarters (%)
People in Group quarters - Dormitories (%)
People in Group quarters - Agriculture workers' dormitories on farms (%)
People in Group quarters - Job Corps and vocational training facilities (%)
People in Group quarters - Other workers' dormitories (%)
People in Group quarters - Crews of maritime vessels (%)
People in Group quarters - Other nonhousehold living situations (%)
People in Group quarters - Other noninstitutional group quarters (%)
Residents speaking English at home (%)
Residents speaking English at home - Born in the United States (%)
Residents speaking English at home - Native, born elsewhere (%)
Residents speaking English at home - Foreign born (%)
Residents speaking Spanish at home (%)
Residents speaking Spanish at home - Born in the United States (%)
Residents speaking Spanish at home - Native, born elsewhere (%)
Residents speaking Spanish at home - Foreign born (%)
Residents speaking other language at home (%)
Residents speaking other language at home - Born in the United States (%)
Residents speaking other language at home - Native, born elsewhere (%)
Residents speaking other language at home - Foreign born (%)
Class of Workers - Employee of private company (%)
Class of Workers - Self-employed in own incorporated business (%)
Class of Workers - Private not-for-profit wage and salary workers (%)
Class of Workers - Local government workers (%)
Class of Workers - State government workers (%)
Class of Workers - Federal government workers (%)
Class of Workers - Self-employed workers in own not incorporated business and Unpaid family workers (%)
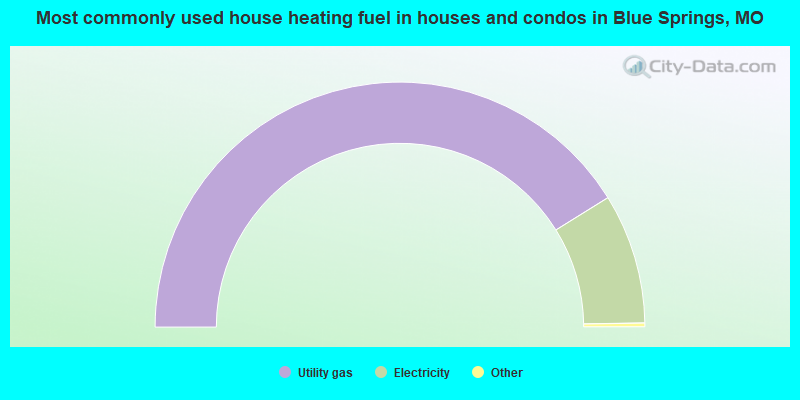
House heating fuel used in houses and condos - Utility gas (%)
House heating fuel used in houses and condos - Bottled, tank, or LP gas (%)
House heating fuel used in houses and condos - Electricity (%)
House heating fuel used in houses and condos - Fuel oil, kerosene, etc. (%)
House heating fuel used in houses and condos - Coal or coke (%)
House heating fuel used in houses and condos - Wood (%)
House heating fuel used in houses and condos - Solar energy (%)
House heating fuel used in houses and condos - Other fuel (%)
House heating fuel used in houses and condos - No fuel used (%)
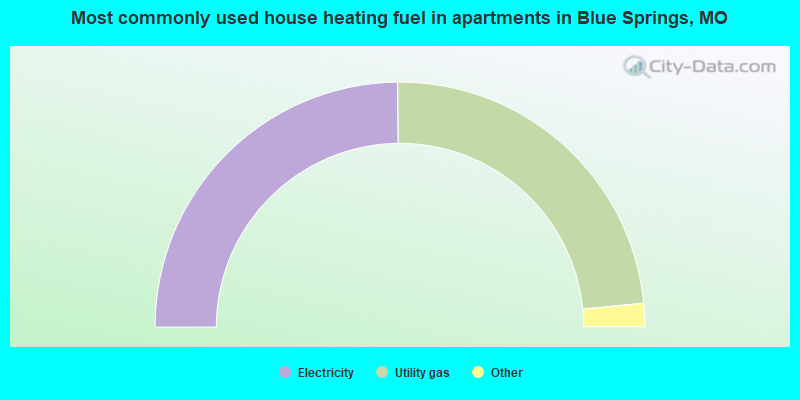
House heating fuel used in apartments - Utility gas (%)
House heating fuel used in apartments - Bottled, tank, or LP gas (%)
House heating fuel used in apartments - Electricity (%)
House heating fuel used in apartments - Fuel oil, kerosene, etc. (%)
House heating fuel used in apartments - Coal or coke (%)
House heating fuel used in apartments - Wood (%)
House heating fuel used in apartments - Solar energy (%)
House heating fuel used in apartments - Other fuel (%)
House heating fuel used in apartments - No fuel used (%)
Armed forces status - In Armed Forces (%)
Armed forces status - Civilian (%)
Armed forces status - Civilian - Veteran (%)
Armed forces status - Civilian - Nonveteran (%)
Fatal accidents locations in years 2005-2021
Fatal accidents locations in 2005
Fatal accidents locations in 2006
Fatal accidents locations in 2007
Fatal accidents locations in 2008
Fatal accidents locations in 2009
Fatal accidents locations in 2010
Fatal accidents locations in 2011
Fatal accidents locations in 2012
Fatal accidents locations in 2013
Fatal accidents locations in 2014
Fatal accidents locations in 2015
Fatal accidents locations in 2016
Fatal accidents locations in 2017
Fatal accidents locations in 2018
Fatal accidents locations in 2019
Fatal accidents locations in 2020
Fatal accidents locations in 2021
Alcohol use - People drinking some alcohol every month (%)
Alcohol use - People not drinking at all (%)
Alcohol use - Average days/month drinking alcohol
Alcohol use - Average drinks/week
Alcohol use - Average days/year people drink much
Audiometry - Average condition of hearing (%)
Audiometry - People that can hear a whisper from across a quiet room (%)
Audiometry - People that can hear normal voice from across a quiet room (%)
Audiometry - Ears ringing, roaring, buzzing (%)
Audiometry - Had a job exposure to loud noise (%)
Audiometry - Had off-work exposure to loud noise (%)
Blood Pressure & Cholesterol - Has high blood pressure (%)
Blood Pressure & Cholesterol - Checking blood pressure at home (%)
Blood Pressure & Cholesterol - Frequently checking blood cholesterol (%)
Blood Pressure & Cholesterol - Has high cholesterol level (%)
Consumer Behavior - Money monthly spent on food at supermarket/grocery store
Consumer Behavior - Money monthly spent on food at other stores
Consumer Behavior - Money monthly spent on eating out
Consumer Behavior - Money monthly spent on carryout/delivered foods
Consumer Behavior - Income spent on food at supermarket/grocery store (%)
Consumer Behavior - Income spent on food at other stores (%)
Consumer Behavior - Income spent on eating out (%)
Consumer Behavior - Income spent on carryout/delivered foods (%)
Current Health Status - General health condition (%)
Current Health Status - Blood donors (%)
Current Health Status - Has blood ever tested for HIV virus (%)
Current Health Status - Left-handed people (%)
Dermatology - People using sunscreen (%)
Diabetes - Diabetics (%)
Diabetes - Had a blood test for high blood sugar (%)
Diabetes - People taking insulin (%)
Diet Behavior & Nutrition - Diet health (%)
Diet Behavior & Nutrition - Milk product consumption (# of products/month)
Diet Behavior & Nutrition - Meals not home prepared (#/week)
Diet Behavior & Nutrition - Meals from fast food or pizza place (#/week)
Diet Behavior & Nutrition - Ready-to-eat foods (#/month)
Diet Behavior & Nutrition - Frozen meals/pizza (#/month)
Drug Use - People that ever used marijuana or hashish (%)
Drug Use - Ever used hard drugs (%)
Drug Use - Ever used any form of cocaine (%)
Drug Use - Ever used heroin (%)
Drug Use - Ever used methamphetamine (%)
Health Insurance - People covered by health insurance (%)
Kidney Conditions-Urology - Avg. # of times urinating at night
Medical Conditions - People with asthma (%)
Medical Conditions - People with anemia (%)
Medical Conditions - People with psoriasis (%)
Medical Conditions - People with overweight (%)
Medical Conditions - Elderly people having difficulties in thinking or remembering (%)
Medical Conditions - People who ever received blood transfusion (%)
Medical Conditions - People having trouble seeing even with glass/contacts (%)
Medical Conditions - People with arthritis (%)
Medical Conditions - People with gout (%)
Medical Conditions - People with congestive heart failure (%)
Medical Conditions - People with coronary heart disease (%)
Medical Conditions - People with angina pectoris (%)
Medical Conditions - People who ever had heart attack (%)
Medical Conditions - People who ever had stroke (%)
Medical Conditions - People with emphysema (%)
Medical Conditions - People with thyroid problem (%)
Medical Conditions - People with chronic bronchitis (%)
Medical Conditions - People with any liver condition (%)
Medical Conditions - People who ever had cancer or malignancy (%)
Mental Health - People who have little interest in doing things (%)
Mental Health - People feeling down, depressed, or hopeless (%)
Mental Health - People who have trouble sleeping or sleeping too much (%)
Mental Health - People feeling tired or having little energy (%)
Mental Health - People with poor appetite or overeating (%)
Mental Health - People feeling bad about themself (%)
Mental Health - People who have trouble concentrating on things (%)
Mental Health - People moving or speaking slowly or too fast (%)
Mental Health - People having thoughts they would be better off dead (%)
Oral Health - Average years since last visit a dentist
Oral Health - People embarrassed because of mouth (%)
Oral Health - People with gum disease (%)
Oral Health - General health of teeth and gums (%)
Oral Health - Average days a week using dental floss/device
Oral Health - Average days a week using mouthwash for dental problem
Oral Health - Average number of teeth
Pesticide Use - Households using pesticides to control insects (%)
Pesticide Use - Households using pesticides to kill weeds (%)
Physical Activity - People doing vigorous-intensity work activities (%)
Physical Activity - People doing moderate-intensity work activities (%)
Physical Activity - People walking or bicycling (%)
Physical Activity - People doing vigorous-intensity recreational activities (%)
Physical Activity - People doing moderate-intensity recreational activities (%)
Physical Activity - Average hours a day doing sedentary activities
Physical Activity - Average hours a day watching TV or videos
Physical Activity - Average hours a day using computer
Physical Functioning - People having limitations keeping them from working (%)
Physical Functioning - People limited in amount of work they can do (%)
Physical Functioning - People that need special equipment to walk (%)
Physical Functioning - People experiencing confusion/memory problems (%)
Physical Functioning - People requiring special healthcare equipment (%)
Prescription Medications - Average number of prescription medicines taking
Preventive Aspirin Use - Adults 40+ taking low-dose aspirin (%)
Reproductive Health - Vaginal deliveries (%)
Reproductive Health - Cesarean deliveries (%)
Reproductive Health - Deliveries resulted in a live birth (%)
Reproductive Health - Pregnancies resulted in a delivery (%)
Reproductive Health - Women breastfeeding newborns (%)
Reproductive Health - Women that had a hysterectomy (%)
Reproductive Health - Women that had both ovaries removed (%)
Reproductive Health - Women that have ever taken birth control pills (%)
Reproductive Health - Women taking birth control pills (%)
Reproductive Health - Women that have ever used Depo-Provera or injectables (%)
Reproductive Health - Women that have ever used female hormones (%)
Sexual Behavior - People 18+ that ever had sex (vaginal, anal, or oral) (%)
Sexual Behavior - Males 18+ that ever had vaginal sex with a woman (%)
Sexual Behavior - Males 18+ that ever performed oral sex on a woman (%)
Sexual Behavior - Males 18+ that ever had anal sex with a woman (%)
Sexual Behavior - Males 18+ that ever had any sex with a man (%)
Sexual Behavior - Females 18+ that ever had vaginal sex with a man (%)
Sexual Behavior - Females 18+ that ever performed oral sex on a man (%)
Sexual Behavior - Females 18+ that ever had anal sex with a man (%)
Sexual Behavior - Females 18+ that ever had any kind of sex with a woman (%)
Sexual Behavior - Average age people first had sex
Sexual Behavior - Average number of female sex partners in lifetime (males 18+)
Sexual Behavior - Average number of female vaginal sex partners in lifetime (males 18+)
Sexual Behavior - Average age people first performed oral sex on a woman (18+)
Sexual Behavior - Average number of woman performed oral sex on in lifetime (18+)
Sexual Behavior - Average number of male sex partners in lifetime (males 18+)
Sexual Behavior - Average number of male anal sex partners in lifetime (males 18+)
Sexual Behavior - Average age people first performed oral sex on a man (18+)
Sexual Behavior - Average number of male oral sex partners in lifetime (18+)
Sexual Behavior - People using protection when performing oral sex (%)
Sexual Behavior - Average number of times people have vaginal or anal sex a year
Sexual Behavior - People having sex without condom (%)
Sexual Behavior - Average number of male sex partners in lifetime (females 18+)
Sexual Behavior - Average number of male vaginal sex partners in lifetime (females 18+)
Sexual Behavior - Average number of female sex partners in lifetime (females 18+)
Sexual Behavior - Circumcised males 18+ (%)
Sleep Disorders - Average hours sleeping at night
Sleep Disorders - People that has trouble sleeping (%)
Smoking-Cigarette Use - People smoking cigarettes (%)
Taste & Smell - People 40+ having problems with smell (%)
Taste & Smell - People 40+ having problems with taste (%)
Taste & Smell - People 40+ that ever had wisdom teeth removed (%)
Taste & Smell - People 40+ that ever had tonsils teeth removed (%)
Taste & Smell - People 40+ that ever had a loss of consciousness because of a head injury (%)
Taste & Smell - People 40+ that ever had a broken nose or other serious injury to face or skull (%)
Taste & Smell - People 40+ that ever had two or more sinus infections (%)
Weight - Average height (inches)
Weight - Average weight (pounds)
Weight - Average BMI
Weight - People that are obese (%)
Weight - People that ever were obese (%)
Weight - People trying to lose weight (%)
According to our research of Missouri and other state lists, there were 68 registered sex offenders living in Blue Springs, Missouri as of April 27, 2024 . The ratio of all residents to sex offenders in Blue Springs is 798 to 1.The ratio of registered sex offenders to all residents in this city is lower than the state average.
Officers per 1,000 residents here:
1.73Missouri average:
2.48
Latest news from Blue Springs, MO collected exclusively by city-data.com from local newspapers, TV, and radio stations
Ancestries: European (20.1%), German (14.2%), English (8.5%), American (7.2%), Irish (5.7%), Italian (2.7%).
Current Local Time:
Land area: 18.2 square miles.
Population density: 3,271 people per square mile (average).
1,145 residents are foreign born
This city:
1.9%Missouri:
4.2%
Median real estate property taxes paid for housing units with mortgages in 2022: $2,845 (1.1%)Median real estate property taxes paid for housing units with no mortgage in 2022: $2,886 (1.2%)
Nearest city with pop. 50,000+: Independence, MO
Nearest city with pop. 200,000+: Kansas City, MO
Nearest city with pop. 1,000,000+: Chicago, IL
Nearest cities:
Unity Village, MO (2.9 miles),
Latitude: 39.02 N, Longitude: 94.27 W
Daytime population change due to commuting: -8,420 (-14.3%)Workers who live and work in this city: 9,864 (34.0%)
Property values in Blue Springs, MO
Single-family new house construction building permits:
2022: 153 buildings , average cost: $92,0002021: 177 buildings , average cost: $122,2002020: 352 buildings , average cost: $103,3002019: 142 buildings , average cost: $118,0002018: 231 buildings , average cost: $99,9002017: 173 buildings , average cost: $118,5002016: 172 buildings , average cost: $132,0002015: 156 buildings , average cost: $122,0002014: 121 buildings , average cost: $122,3002013: 81 buildings , average cost: $127,4002012: 59 buildings , average cost: $119,7002011: 48 buildings , average cost: $118,1002010: 45 buildings , average cost: $116,2002009: 32 buildings , average cost: $126,3002008: 58 buildings , average cost: $111,1002007: 131 buildings , average cost: $113,0002006: 84 buildings , average cost: $129,7002005: 148 buildings , average cost: $128,7002004: 201 buildings , average cost: $125,8002003: 147 buildings , average cost: $122,1002002: 223 buildings , average cost: $105,3002001: 307 buildings , average cost: $104,9002000: 306 buildings , average cost: $104,2001999: 354 buildings , average cost: $106,5001998: 277 buildings , average cost: $102,6001997: 295 buildings , average cost: $87,700Unemployment in December 2023:
Population change in the 1990s: +7,430 (+18.3%).
Most common occupations in Blue Springs, MO (%)
Both Males Females
Other management occupations, except farmers and farm managers (5.1%)
Other office and administrative support workers, including supervisors (5.1%)
Other sales and related occupations, including supervisors (4.1%)
Computer specialists (3.8%)
Sales representatives, services, wholesale and manufacturing (3.6%)
Preschool, kindergarten, elementary, and middle school teachers (3.6%)
Electrical equipment mechanics and other installation, maintenance, and repair workers, including supervisors (3.4%)
Electrical equipment mechanics and other installation, maintenance, and repair workers, including supervisors (6.3%)
Other management occupations, except farmers and farm managers (5.8%)
Computer specialists (5.2%)
Other sales and related occupations, including supervisors (5.0%)
Sales representatives, services, wholesale and manufacturing (4.7%)
Driver/sales workers and truck drivers (4.3%)
Other production occupations, including supervisors (3.5%)
Other office and administrative support workers, including supervisors (8.6%)
Preschool, kindergarten, elementary, and middle school teachers (6.7%)
Secretaries and administrative assistants (6.3%)
Other management occupations, except farmers and farm managers (4.3%)
Registered nurses (3.9%)
Information and record clerks, except customer service representatives (3.8%)
Retail sales workers, except cashiers (3.3%)
Tornado activity:
Blue Springs-area historical tornado activity is slightly above Missouri state average. It is 88% greater than the overall U.S. average.
On 5/20/1957, a category F5 (max. wind speeds 261-318 mph) tornado 7.2 miles away from the Blue Springs city center killed 44 people and injured 207 people and caused between $500,000 and $5,000,000 in damages.
On 5/4/1977, a category F4 (max. wind speeds 207-260 mph) tornado 14.1 miles away from the city center injured 5 people and caused between $500,000 and $5,000,000 in damages.
Earthquake activity:
Blue Springs-area historical earthquake activity is significantly above Missouri state average. It is 489% greater than the overall U.S. average. On 9/3/2016 at 12:02:44, a magnitude 5.8 (5.8 MW, Depth: 3.5 mi, Class: Moderate, Intensity: VI - VII) earthquake occurred 230.7 miles away from Blue Springs center On 11/6/2011 at 03:53:10, a magnitude 5.7 (5.7 MW, Depth: 3.2 mi) earthquake occurred 277.3 miles away from Blue Springs center On 11/12/2014 at 21:40:00, a magnitude 4.9 (4.9 MW, Depth: 2.5 mi, Class: Light, Intensity: IV - V) earthquake occurred 218.4 miles away from the city center On 11/7/2016 at 01:44:24, a magnitude 5.0 (5.0 MW, Depth: 2.8 mi) earthquake occurred 251.1 miles away from the city center On 4/18/2008 at 09:36:59, a magnitude 5.4 (5.1 MB, 4.8 MS, 5.4 MW, 5.2 MW) earthquake occurred 346.8 miles away from the city center On 2/13/2016 at 17:07:06, a magnitude 5.1 (5.1 MW, Depth: 5.2 mi) earthquake occurred 298.9 miles away from Blue Springs center Magnitude types: body-wave magnitude (MB), surface-wave magnitude (MS), moment magnitude (MW) Natural disasters: The number of natural disasters in Jackson County (24) is greater than the US average (15).Major Disasters (Presidential) Declared: 17Emergencies Declared: 5Floods: 18, Storms: 15, Tornadoes: 8, Winter Storms: 2, Drought: 1, Heavy Rain: 1, Hurricane: 1, Ice Storm: 1, Wind: 1, Other: 1 (Note: some incidents may be assigned to more than one category). Hospitals and medical centers in Blue Springs: CARONDELET HOSPICE (206 MOCK) ST MARY'S MEDICAL CENTER (Voluntary non-profit - Church, 201 NW R D MIZE RD) SHANGRI-LA REHAB AND LIVING CENTER (930 NE DUNCAN ROAD)
ST MARYS MANOR (111 MOCK AVENUE)
BLUE SPRINGS DIALYSIS CENTER (205 NW R D MIZE RD #205)
Amtrak stations near Blue Springs: 10 miles: LEE'S SUMMIT (220 S. MAIN ST.) Services: enclosed waiting area, public payphones, free short-term parking, free long-term parking, call for taxi service.
10 miles: INDEPENDENCE (600 S. GRAND AVE.) Services: free short-term parking, call for taxi service.
18 miles: KANSAS CITY (2200 MAIN ST.) Services: ticket office, fully wheelchair accessible, enclosed waiting area, public restrooms, public payphones, snack bar, free short-term parking, paid long-term parking, call for car rental service, taxi stand, public transit connection.
College/University in Blue Springs: House of Heavilin Beauty College-Blue Springs Full-time enrollment: 127; Location: 2000 SW State Route 7; Private, for-profit; Website: kc-hair.com)
Colleges/universities with over 2000 students nearest to Blue Springs:
Rockhurst University (about 16 miles; Kansas City, MO ; Full-time enrollment: 2,013)
University of Missouri-Kansas City (about 17 miles; Kansas City, MO ; FT enrollment: 10,544)
Metropolitan Community College-Kansas City (about 18 miles; Kansas City, MO ; FT enrollment: 12,834)
Wright Career College (about 23 miles; Overland Park, KS ; FT enrollment: 3,107)
Park University (about 25 miles; Parkville, MO ; FT enrollment: 9,131)
Johnson County Community College (about 26 miles; Overland Park, KS ; FT enrollment: 11,976)
Grantham University (about 27 miles; Kansas City, MO ; FT enrollment: 8,385)
Public high schools in Blue Springs: BLUE SPRINGS HIGH Students: 1,751, Location: 2000 NW ASHTON DR, Grades: 9-12)BLUE SPRINGS SOUTH HIGH Students: 1,409, Location: 1200 SE ADAMS DAIRY PKWY, Grades: 9-12)FRESHMAN CTR. - G. BAKER BLDG. Students: 1,049, Location: 2103 NW VESPER, Grades: 9)LIGGETT TRAIL EDUCATION CENTER Students: 206, Location: 3575 SW LIGGETT RD, Grades: PK-12)VALLEY VIEW HIGH Location: 5000 NW VALLEY VIEW RD, Grades: 9-12)Private high schools in Blue Springs: PLAZA HEIGHTS CHRISTIAN ACADEMY Students: 225, Location: 1500 SW CLARK RD, Grades: PK-12)
RAINBOW CENTER FOR COMMUNICATIVE DISORDERS Students: 45, Location: 900 NW WOODS CHAPEL RD, Grades: UG-12)
MARILLAC Students: 32, Location: 5000 NW VALLEY VIEW RD, Grades: 2-10)
Biggest public elementary/middle schools in Blue Springs: MORELAND RIDGE MIDDLE Students: 912, Location: 900 SW BISHOP DR, Grades: 6-8)BRITTANY HILL MIDDLE Students: 844, Location: 2701 NW 1ST ST, Grades: 6-8)LUCY FRANKLIN ELEM. Students: 628, Location: 111 NE ROANOKE DR, Grades: PK-5)WILLIAM BRYANT ELEM. Students: 533, Location: 1101 SE SUNNYSIDE SCHOOL RD, Grades: PK-5)SUNNY POINTE ELEM. Students: 521, Location: 3920 SOUTH R D MIZE RD, Grades: PK-5)JAMES LEWIS ELEM. Students: 502, Location: 717 NW PARK RD, Grades: PK-5)CORDILL-MASON ELEM. Students: 488, Location: 4001 SW CHRISTIANSEN RD, Grades: PK-5)JAMES WALKER ELEM. Students: 443, Location: 201 SE SUNNYSIDE SCHOOL RD, Grades: PK-5)JOHN NOWLIN ELEM. Students: 441, Location: 5020 NW VALLEY VIEW RD, Grades: PK-5)DANIEL YOUNG ELEM. Students: 435, Location: 505 SE SHAMROCK LN, Grades: PK-5)Private elementary/middle schools in Blue Springs: ST JOHN LALANDE SCHOOL Students: 315, Location: 801 NW R D MIZE RD, Grades: PK-8)
TIMOTHY LUTHERAN SCHOOL Students: 58, Location: 301 SW WYATT RD, Grades: KG-8)
CREATIVE WORLD ELEMENTARY SCHOOL Students: 8, Location: 19701 SW EAST US HIGHWAY 40, Grades: KG-1)
See full list of schools located in Blue Springs
Notable locations in Blue Springs: (A) , Parker Center (B) , Stop Shop Center (C) , Central Jackson County Fire Protection District Headquarters Station 3 (D) , Central Jackson County Fire Protection District Station 1 (E) , Missouri Department of Conservation Forestry Kansas City Regional Field Fire Office Blue Springs (F) , Central Jackson County Fire Protection District Station 2 (G) . Display/hide their locations on the map
Shopping Centers: (1) , White Oak Plaza Shopping Center (2) , Interstate Seventy Shopping Center (3) , Jackson Grove Shopping Center (4) , Haymarket Shopping Center (5) , Kings Ridge Shopping Center (6) . Display/hide their locations on the map
Church in Blue Springs: (A) . Display/hide its location on the map
Cemetery: (1) . Display/hide its location on the map
Reservoirs: (A) , Christiansen Lake (B) . Display/hide their locations on the map
Park in Blue Springs: (1) . Display/hide its location on the map
Tourist attractions: (1) , Lunar Bowl (Amusement & Theme Parks; 2001 Northwest Highway 7) (2) , Family Golf Park (Amusement & Theme Parks; 1501 Northeast 40 Highway) (3) , Dell's Honda (Tours & Charters; 3105 Southwest US40 Highway Westbo) (4) . Display/hide their approximate locations on the map
Hotels: (1) , Days Inn and Suites (3120 Northwest Jefferson Street) (2) , Econo Lodge Blue Springs (1110 North 7 Highway) (3) , Ks City/Blue Springs Super 8 Motel (1501 NW North Ridge Dr Ofc I-70) (4) , Interstate Inn (3400 Northwest Jefferson Street) (5) , Courtyard by Marriott Kansas City East (1500 Northeast Coronado) (6) , Days Inn and Suites Kansas (3120 Northwest Jefferson Street) (7) , Motel 6 (901 Northwest Jefferson Street) (8) . Display/hide their approximate locations on the map
Court: (1) . Display/hide its approximate location on the map
Birthplace of: Bryan Pratt - Politician, John Ott (fighter) - Martial artist, Ladell Betts - 2005 NFL player (Washington Redskins, born : Aug 27, 1979).
Jackson County has a predicted average indoor radon screening level greater than 4 pCi/L (pico curies per liter) - Highest Potential Drinking water stations with addresses in Blue Springs and their reported violations in the past:
BENDER CREEK APARTMENTS (Serves TX, Population served: 330, Groundwater):
Past monitoring violations:
Monitoring and Reporting (DBP) - Between APR-2013 and JUN-2013, Contaminant: Chlorine. Follow-up actions: St Public Notif requested (NOV-14-2013), St Violation/Reminder Notice (NOV-14-2013), St Compliance achieved (JUL-17-2014)
Monitoring and Reporting (DBP) - Between JAN-2013 and MAR-2013, Contaminant: Chlorine. Follow-up actions: St Public Notif requested (NOV-14-2013), St Violation/Reminder Notice (NOV-14-2013), St Compliance achieved (JUL-17-2014)
Monitoring and Reporting (DBP) - Between OCT-2008 and DEC-2008, Contaminant: Chlorine. Follow-up actions: St Public Notif requested (MAR-27-2009), St Violation/Reminder Notice (MAR-27-2009), St Compliance achieved (JAN-24-2011)
Monitoring and Reporting (DBP) - Between JAN-2007 and MAR-2007, Contaminant: Chlorine. Follow-up actions: St Public Notif requested (JUL-19-2007), St Violation/Reminder Notice (JUL-19-2007), St Compliance achieved (JAN-24-2011)
Monitoring and Reporting (DBP) - Between OCT-2006 and DEC-2006, Contaminant: Chlorine. Follow-up actions: St Public Notif requested (JUL-19-2007), St Violation/Reminder Notice (JUL-19-2007), St Compliance achieved (JAN-24-2011)
7 other older monitoring violations
Population served: 50, Groundwater):
Past health violations:
MCL, Monthly (TCR) - In JUN-2014, Contaminant: Coliform. Follow-up actions: St Formal NOV issued (JUN-20-2014), St Public Notif requested (JUN-20-2014)
MCL, Monthly (TCR) - In MAY-2014, Contaminant: Coliform. Follow-up actions: St Formal NOV issued (JUN-16-2014), St Public Notif requested (JUN-16-2014)
MCL, Monthly (TCR) - In DEC-2013, Contaminant: Coliform. Follow-up actions: St Public Notif requested (JAN-03-2014), St Formal NOV issued (JAN-03-2014), St Public Notif received (JAN-14-2014), St Compliance achieved (APR-15-2014)
MCL, Monthly (TCR) - In OCT-2013, Contaminant: Coliform. Follow-up actions: St Public Notif requested (NOV-06-2013), St Formal NOV issued (NOV-06-2013), St Public Notif received (NOV-15-2013), St Compliance achieved (JAN-22-2014)
MCL, Monthly (TCR) - In JUL-2011, Contaminant: Coliform. Follow-up actions: St Violation/Reminder Notice (AUG-22-2011), St Public Notif requested (AUG-22-2011), St Public Notif received (AUG-30-2011), St Compliance achieved (JAN-22-2014)
MCL, Monthly (TCR) - In OCT-2010, Contaminant: Coliform. Follow-up actions: St Public Notif requested (NOV-10-2010), St Violation/Reminder Notice (NOV-10-2010), St Compliance achieved (AUG-12-2011)
Past monitoring violations:
One minor monitoring violation
Average household size: This city:
2.7 peopleMissouri:
2.5 people
Percentage of family households: This city:
74.1%Whole state:
65.3%
Percentage of households with unmarried partners: This city:
6.9%Whole state:
6.7%
Likely homosexual households (counted as self-reported same-sex unmarried-partner households)
Lesbian couples: 0.3% of all households Gay men: 0.2% of all households
People in group quarters in Blue Springs in 2010:
182 people in nursing facilities/skilled-nursing facilities
32 people in group homes intended for adults
4 people in workers' group living quarters and job corps centers
People in group quarters in Blue Springs in 2000:
206 people in nursing homes
20 people in other noninstitutional group quarters
12 people in homes for the mentally retarded
6 people in homes for the physically handicapped
2 people in religious group quarters
Banks with most branches in Blue Springs (2011 data):
UMB Bank, National Association: Blue Springs Branch at 3500 South Outer Road, branch established on 1974/04/29; 7 Highway Branch at 301 Nw State Route 7, branch established on 1977/11/21. Info updated 2007/12/13: Bank assets: $11,205.9 mil, Deposits: $8,538.8 mil, headquarters in Kansas City, MO, positive income , 107 total offices , Holding Company: Umb Financial Corporation
Bank of America, National Association: Blue Springs Instore Branch at 1305 North 7th Highway, branch established on 1992/12/05; Blue Springs South Branch at 1104 Sw St Hwy 7, branch established on 1995/10/02. Info updated 2009/11/18: Bank assets: $1,451,969.3 mil, Deposits: $1,077,176.8 mil, headquarters in Charlotte, NC, positive income , 5782 total offices , Holding Company: Bank Of America Corporation
Blue Ridge Bank and Trust Co.: Parkwood Branch at 606 Sw Parkwood Drive, branch established on 2001/07/16; Blue Springs North Branch at 621 Duncan Road, branch established on 2002/03/04. Info updated 2011/06/13: Bank assets: $469.9 mil, Deposits: $424.5 mil, headquarters in Independence, MO, negative income in the last year , Commercial Lending Specialization, 11 total offices , Holding Company: Blue Ridge Bancshares, Inc.
Metcalf Bank: Blue Springs North at 1505 N 7 Hwy, branch established on 1976/07/28; Bank Of Jacomo Branch at 909 South 7 Highway, branch established on 1970/05/26. Info updated 2010/10/05: Bank assets: $1,124.6 mil, Deposits: $891.8 mil, headquarters in Lees Summit, MO, positive income , Commercial Lending Specialization, 26 total offices , Holding Company: Central Bancompany
Commerce Bank: Blue Springs Banking Center Branch at 503 N Hwy 7, branch established on 1991/02/20; Blue Springs 40 Hwy Branch at 613 West 40 Highway, branch established on 1991/07/11. Info updated 2011/07/07: Bank assets: $20,493.6 mil, Deposits: $16,805.3 mil, headquarters in Kansas City, MO, positive income , 206 total offices , Holding Company: Commerce Bancshares, Inc.
U.S. Bank National Association: Blue Springs Branch at 701 West Main Street, branch established on 1985/09/11; Blue Springs North Branch at 1500 Nw State Route 7, branch established on 1918/01/01. Info updated 2012/01/30: Bank assets: $330,470.8 mil, Deposits: $236,091.5 mil, headquarters in Cincinnati, OH, positive income , 3121 total offices , Holding Company: U.S. Bancorp
Bank Midwest, National Association: Blue Springs Branch at 1100 N.W. Outer Road, branch established on 1995/11/01. Info updated 2012/03/19: Bank assets: $6,237.6 mil, Deposits: $5,064.6 mil, headquarters in Kansas City, MO, positive income , 138 total offices , Holding Company: Nbh Holdings Corp.
Adams Dairy Bank: at 651 Ne Coronado Drive, branch established on 2008/01/03. Info updated 2011/07/21: Bank assets: $55.3 mil, Deposits: $43.1 mil, local headquarters , negative income in the last year , Commercial Lending Specialization, 1 total offices
Bank of the West: Blue Springs at 3121 South 7 Hwy, branch established on 1989/05/01. Info updated 2009/11/16: Bank assets: $62,408.3 mil, Deposits: $43,995.2 mil, headquarters in San Francisco, CA, positive income , 647 total offices , Holding Company: Bnp Paribas
2 other banks with 2 local branches
For population 15 years and over in Blue Springs:
Never married: 28.0%Now married: 54.9%Separated: 1.5%Widowed: 4.4%Divorced: 11.2% For population 25 years and over in Blue Springs:
High school or higher: 96.0%Bachelor's degree or higher: 33.7%Graduate or professional degree: 12.1%Unemployed: 3.2%Mean travel time to work (commute): 21.4 minutes
Education Gini index (Inequality in education) Here:
9.5Missouri average:
11.1
Religion statistics for Blue Springs, MO (based on Jackson County data)
Religion Adherents Congregations Evangelical Protestant 154,390 404 Catholic 69,441 52 Mainline Protestant 61,299 159 Other 34,880 110 Black Protestant 34,722 84 Orthodox 1,235 3 None 318,191 -
Source: Clifford Grammich, Kirk Hadaway, Richard Houseal, Dale E.Jones, Alexei Krindatch, Richie Stanley and Richard H.Taylor. 2012. 2010 U.S.Religion Census: Religious Congregations & Membership Study. Association of Statisticians of American Religious Bodies. Jones, Dale E., et al. 2002. Congregations and Membership in the United States 2000. Nashville, TN: Glenmary Research Center. Graphs represent county-level data
Food Environment Statistics: Number of grocery stores : 109This county :
1.64 / 10,000 pop.State :
1.88 / 10,000 pop.
Number of supercenters and club stores : 10This county :
0.15 / 10,000 pop.Missouri :
0.18 / 10,000 pop.
Number of convenience stores (no gas) : 40Here :
0.60 / 10,000 pop.State :
0.60 / 10,000 pop.
Number of convenience stores (with gas) : 185Jackson County :
2.78 / 10,000 pop.Missouri :
4.34 / 10,000 pop.
Number of full-service restaurants : 460Jackson County :
6.91 / 10,000 pop.Missouri :
7.37 / 10,000 pop.
Adult diabetes rate : Jackson County :
9.1%Missouri :
8.8%
Low-income preschool obesity rate : Health and Nutrition: Healthy diet rate : This city:
51.0%Missouri:
50.9%
Average overall health of teeth and gums : Blue Springs:
50.0%Missouri:
48.6%
People feeling badly about themselves : People not drinking alcohol at all : This city:
9.3%Missouri:
10.1%
Average hours sleeping at night : Blue Springs:
6.8Missouri:
6.8
Overweight people : Blue Springs:
34.6%Missouri:
34.3%
General health condition : Average condition of hearing : Blue Springs:
80.7%State:
79.3%
More about Health and Nutrition of Blue Springs, MO Residents
Local government employment and payroll (March 2022)
Function
Full-time employees
Monthly full-time payroll
Average yearly full-time wage
Part-time employees
Monthly part-time payroll
Police Protection - Officers
91 $559,674 $73,803 0 $0 Police - Other
30 $115,689 $46,276 5 $1,751 Financial Administration
25 $129,797 $62,303 0 $0 Parks and Recreation
23 $89,857 $46,882 67 $70,186 Streets and Highways
21 $106,387 $60,793 0 $0 Housing and Community Development (Local)
19 $85,299 $53,873 0 $0 Water Supply
15 $53,965 $43,172 0 $0 Judicial and Legal
6 $13,245 $26,490 3 $2,230 Correction
5 $20,097 $48,233 0 $0 Sewerage
4 $21,776 $65,328 0 $0 Other Government Administration
3 $14,402 $57,608 7 $3,769
Totals for Government
242 $1,210,188 $60,009 82 $77,936
Blue Springs government finances - Expenditure in 2021 (per resident):
Construction - General - Other: $3,892,000 ($65.39)
Water Utilities: $251,000 ($4.22)Parks and Recreation: $184,000 ($3.09)Sewerage: $121,000 ($2.03)Current Operations - Police Protection: $17,165,000 ($288.40)
Water Utilities: $8,462,000 ($142.18)Sewerage: $6,850,000 ($115.09)Parks and Recreation: $5,666,000 ($95.20)Regular Highways: $4,029,000 ($67.69)General - Other: $2,397,000 ($40.27)Central Staff Services: $1,931,000 ($32.44)Housing and Community Development: $869,000 ($14.60)Protective Inspection and Regulation - Other: $832,000 ($13.98)Judicial and Legal Services: $815,000 ($13.69)General Public Buildings: $804,000 ($13.51)Financial Administration: $585,000 ($9.83)General - Interest on Debt: $4,028,000 ($67.68)
Other Capital Outlay - General - Other: $509,000 ($8.55)
Blue Springs government finances - Revenue in 2021 (per resident):
Charges - Sewerage: $8,362,000 ($140.50)
Other: $3,578,000 ($60.12)Parks and Recreation: $2,373,000 ($39.87)Miscellaneous - Fines and Forfeits: $917,000 ($15.41)
Interest Earnings: $556,000 ($9.34)General Revenue - Other: $364,000 ($6.12)Donations From Private Sources: $34,000 ($0.57)Revenue - Water Utilities: $9,899,000 ($166.32)
State Intergovernmental - General Local Government Support: $2,772,000 ($46.57)
Other: $985,000 ($16.55)Tax - General Sales and Gross Receipts: $18,824,000 ($316.27)
Property: $6,978,000 ($117.24)Occupation and Business License - Other: $5,537,000 ($93.03)Motor Vehicle License: $2,103,000 ($35.33)Other License: $1,115,000 ($18.73)Other Selective Sales: $673,000 ($11.31)Other: $467,000 ($7.85)
Blue Springs government finances - Debt in 2021 (per resident):
Long Term Debt - Beginning Outstanding - Unspecified Public Purpose: $109,268,000 ($1835.88)
Outstanding Unspecified Public Purpose: $104,509,000 ($1755.92)Retired Unspecified Public Purpose: $4,759,000 ($79.96)
Blue Springs government finances - Cash and Securities in 2021 (per resident):
Other Funds - Cash and Securities: $49,203,000 ($826.69)
Sinking Funds - Cash and Securities: $1,433,000 ($24.08)
7.09% of this county's 2021 resident taxpayers lived in other counties in 2020 ($55,298 average adjusted gross income )
Here:
7.09%Missouri average:
7.67%
0.01% of residents moved from foreign countries ($84 average AGI )Jackson County:
0.01%Missouri average:
0.02%
Top counties from which taxpayers relocated into this county between 2020 and 2021:
7.47% of this county's 2020 resident taxpayers moved to other counties in 2021 ($66,055 average adjusted gross income )
Here:
7.47%Missouri average:
7.51%
0.01% of residents moved to foreign countries ($37 average AGI )Jackson County:
0.01%Missouri average:
0.01%
Top counties to which taxpayers relocated from this county between 2020 and 2021:
Businesses in Blue Springs, MO
Name Count Name Count
AT&T 1 La-Z-Boy 1 Ace Hardware 2 Long John Silver's 1 Advance Auto Parts 1 Marriott 1 Applebee's 1 Maurices 1 Arby's 1 McDonald's 4 AutoZone 1 Motel 6 1 Baskin-Robbins 1 Motherhood Maternity 1 Blockbuster 2 Nissan 1 Burger King 1 Office Depot 1 CVS 2 Olive Garden 1 Chevrolet 1 Panda Express 1 Chipotle 1 Panera Bread 1 Church's Chicken 1 Papa John's Pizza 1 Comfort Inn 1 Payless 1 Cricket Wireless 1 Penske 1 Dairy Queen 1 Pizza Hut 3 Days Inn 1 Quality 1 Dennys 1 Quiznos 1 Domino's Pizza 1 RadioShack 1 Dressbarn 1 SONIC Drive-In 4 Famous Footwear 1 Sprint Nextel 1 FedEx 7 Starbucks 2 Firestone Complete Auto Care 1 Subway 5 Ford 1 Super 8 1 GNC 1 T-Mobile 3 GameStop 1 Taco Bell 3 Gap 1 Target 1 Goodwill 2 U-Haul 3 H&R Block 3 UPS 14 Hilton 1 Verizon Wireless 3 Hobby Lobby 1 Waffle House 1 Home Depot 1 Walgreens 2 Jimmy John's 1 Walmart 1 KFC 2 Wendy's 1 Kohl's 1 YMCA 1 La Quinta 1
Strongest AM radio stations in Blue Springs:
KCWJ (1030 AM; 1 kW; BLUE SPRINGS, MO; Owner: CHRISTIAN BROADCASTING ASSOCIATES, LP)
WHB (810 AM; 50 kW; KANSAS CITY, MO; Owner: UNION BROADCASTING, INC.)
KKHK (1250 AM; 25 kW; KANSAS CITY, KS)
KCTE (1510 AM; daytime; 10 kW; INDEPENDENCE, MO; Owner: UNION BROADCASTING, INC.)
KCCV (760 AM; daytime; 6 kW; OVERLAND PARK, KS; Owner: BOTT BROADCASTING COMPANY)
KPHN (1190 AM; 5 kW; KANSAS CITY, MO; Owner: ABC, INC.)
KCMO (710 AM; 10 kW; KANSAS CITY, MO; Owner: SUSQUEHANNA KANSAS CITY PARTNERSHIP)
KCSP (610 AM; 5 kW; KANSAS CITY, MO; Owner: ENTERCOM KANSAS CITY LICENSE, LLC)
KXTR (1660 AM; 10 kW; KANSAS CITY, KS; Owner: ENTERCOM KANSAS CITY LICENSE, LLC)
KMBZ (980 AM; 5 kW; KANSAS CITY, MO; Owner: ENTERCOM KANSAS CITY LICENSE, LLC)
KGGN (890 AM; daytime; 1 kW; GLADSTONE, MO; Owner: MORTENSON BROADCASTING COMPANY, INC.)
KCNW (1380 AM; 2 kW; FAIRWAY, KS; Owner: KANSAS CITY RADIO, INC.)
KPRT (1590 AM; 1 kW; KANSAS CITY, MO; Owner: CARTER BROADCAST GROUP, INC.)
Strongest FM radio stations in Blue Springs:
KSRC (102.1 FM; KANSAS CITY, MO; Owner: INFINITY RADIO OPERATIONS INC.)
WDAF-FM (106.5 FM; LIBERTY, MO; Owner: ENTERCOM KANSAS CITY LICENSE, LLC)
KUDL (98.1 FM; KANSAS CITY, KS; Owner: ENTERCOM KANSAS CITY LICENSE, LLC)
KMXV (93.3 FM; KANSAS CITY, MO; Owner: INFINITY RADIO OPERATIONS INC.)
KQRC-FM (98.9 FM; LEAVENWORTH, KS; Owner: ENTERCOM KANSAS CITY LICENSE, LLC)
KRBZ (96.5 FM; KANSAS CITY, MO; Owner: ENTERCOM KANSAS CITY LICENSE, LLC)
KYYS (99.7 FM; KANSAS CITY, MO; Owner: ENTERCOM KANSAS CITY LICENSE, LLC)
KBEQ-FM (104.3 FM; KANSAS CITY, MO; Owner: INFINITY RADIO SUBSIDIARY OPERATIONS INC.)
KPRS (103.3 FM; KANSAS CITY, MO; Owner: CARTER BROADCAST GROUP, INC.)
KCUR-FM (89.3 FM; KANSAS CITY, MO; Owner: CURATORS OF UNIVERSITY OF MISSOURI)
KLJC (88.5 FM; KANSAS CITY, MO; Owner: CALVARY BIBLE COLLEGE)
KCMO-FM (94.9 FM; KANSAS CITY, MO; Owner: SUSQUEHANNA KANSAS CITY PARTNERSHIP)
KZPL (97.3 FM; LEE'S SUMMIT, MO; Owner: UNION FIRST BROADCASTING, LLC)
KMJK (107.3 FM; LEXINGTON, MO; Owner: ALLUR-KANSAS CITY, INC.)
KKFI (90.1 FM; KANSAS CITY, MO; Owner: MID-COAST RADIO PROJECT, INC.)
KCFX (101.1 FM; HARRISONVILLE, MO; Owner: SUSQUEHANNA KANSAS CITY PARTNERSHIP)
KFKF-FM (94.1 FM; KANSAS CITY, KS; Owner: INFINITY RADIO SUBSIDIARY OPERATIONS INC.)
KAYX (92.5 FM; RICHMOND, MO; Owner: BOTT COMMUNICATIONS, INC.)
KTBG (90.9 FM; WARRENSBURG, MO; Owner: CENTRAL MISSOURI STATE UNIVERSITY)
KCCV-FM (92.3 FM; OLATHE, KS; Owner: BOTT BROADCASTING COMPANY)
TV broadcast stations around Blue Springs:
KCPT (Channel 19; KANSAS CITY, MO; Owner: PUBLIC TELEVISION 19, INC.)
KMBC-TV (Channel 9; KANSAS CITY, MO; Owner: KMBC HEARST-ARGYLE TELEVISION, INC.)
KSMO-TV (Channel 62; KANSAS CITY, MO; Owner: KSMO LICENSEE, INC.)
KPXE (Channel 50; KANSAS CITY, MO; Owner: PAXSON KANSAS CITY LICENSE, INC.)
KMCI (Channel 38; LAWRENCE, KS; Owner: SCRIPPS HOWARD BROADCASTING COMPANY)
KCWE (Channel 29; KANSAS CITY, MO; Owner: KCWE-TV, INC.)
K48FS (Channel 48; KANSAS CITY, MO; Owner: WORD OF GOD FELLOWSHIP, INC.)
KCTV (Channel 5; KANSAS CITY, MO; Owner: MEREDITH CORPORATION)
K35CT (Channel 35; KANSAS CITY, MO; Owner: WORD OF GOD FELLOWSHIP, INC.)
KSHB-TV (Channel 41; KANSAS CITY, MO; Owner: SCRIPPS HOWARD BROADCASTING COMPANY)
WDAF-TV (Channel 4; KANSAS CITY, MO; Owner: WDAF LICENSE, INC.)
K26CR (Channel 26; KANSAS CITY, MO; Owner: VENTANA TELEVISION, INC.)
National Bridge Inventory (NBI) Statistics 30 Number of bridges348ft / 106m Total length $832,000 Total costs807,970 Total average daily traffic152,088 Total average daily truck traffic
New bridges - historical statistics
2 1940-1949 13 1960-1969 1 1970-1979 4 1980-1989 7 1990-1999 2 2000-2009 1 2020-2022
See full National Bridge Inventory statistics for Blue Springs, MO
Home Mortgage Disclosure Act Aggregated Statistics For Year 2009(Based on 1 full and 7 partial tracts) A) FHA, FSA/RHS & VA B) Conventional C) Refinancings D) Home Improvement Loans E) Loans on Dwellings For 5+ Families F) Non-occupant Loans on G) Loans On Manufactured Number Average Value Number Average Value Number Average Value Number Average Value Number Average Value Number Average Value Number Average Value
LOANS ORIGINATED 297 $128,065 159 $126,109 899 $142,743 47 $55,396 2 $1,401,495 65 $99,723 1 $80,150 APPLICATIONS APPROVED, NOT ACCEPTED 17 $137,297 10 $108,505 83 $146,053 5 $38,412 0 $0 5 $140,454 1 $25,020 APPLICATIONS DENIED 29 $126,998 24 $144,808 266 $156,227 38 $22,413 0 $0 9 $95,956 0 $0 APPLICATIONS WITHDRAWN 25 $139,422 27 $250,828 239 $146,336 6 $63,535 0 $0 7 $97,077 0 $0 FILES CLOSED FOR INCOMPLETENESS 5 $118,510 1 $199,870 46 $143,733 1 $20,190 0 $0 1 $63,800 0 $0
Aggregated Statistics For Year 2008(Based on 1 full and 7 partial tracts) A) FHA, FSA/RHS & VA B) Conventional C) Refinancings D) Home Improvement Loans E) Loans on Dwellings For 5+ Families F) Non-occupant Loans on G) Loans On Manufactured Number Average Value Number Average Value Number Average Value Number Average Value Number Average Value Number Average Value Number Average Value
LOANS ORIGINATED 228 $127,827 255 $132,361 547 $134,327 67 $38,174 1 $2,360,110 114 $116,647 0 $0 APPLICATIONS APPROVED, NOT ACCEPTED 22 $121,135 21 $126,163 83 $135,289 14 $27,349 0 $0 5 $190,016 3 $31,803 APPLICATIONS DENIED 30 $135,570 28 $146,408 361 $144,276 105 $50,592 0 $0 19 $130,578 3 $50,433 APPLICATIONS WITHDRAWN 19 $149,828 26 $134,965 158 $145,189 20 $126,679 0 $0 9 $121,187 0 $0 FILES CLOSED FOR INCOMPLETENESS 10 $135,036 4 $127,015 32 $150,544 3 $59,873 0 $0 1 $128,000 0 $0
Aggregated Statistics For Year 2007(Based on 1 full and 7 partial tracts) A) FHA, FSA/RHS & VA B) Conventional C) Refinancings D) Home Improvement Loans E) Loans on Dwellings For 5+ Families F) Non-occupant Loans on G) Loans On Manufactured Number Average Value Number Average Value Number Average Value Number Average Value Number Average Value Number Average Value Number Average Value
LOANS ORIGINATED 61 $134,085 552 $126,269 625 $128,181 117 $45,157 4 $685,960 154 $134,707 1 $39,670 APPLICATIONS APPROVED, NOT ACCEPTED 5 $120,326 52 $126,259 149 $127,306 32 $38,553 0 $0 13 $176,118 1 $51,340 APPLICATIONS DENIED 10 $136,566 121 $139,984 478 $135,906 124 $77,683 1 $167,080 48 $184,089 2 $71,965 APPLICATIONS WITHDRAWN 7 $132,350 53 $119,187 260 $132,245 30 $91,951 0 $0 28 $118,955 0 $0 FILES CLOSED FOR INCOMPLETENESS 2 $100,385 18 $123,797 61 $158,179 4 $39,080 0 $0 4 $163,795 0 $0
Aggregated Statistics For Year 2006(Based on 1 full and 7 partial tracts) A) FHA, FSA/RHS & VA B) Conventional C) Refinancings D) Home Improvement Loans E) Loans on Dwellings For 5+ Families F) Non-occupant Loans on G) Loans On Manufactured Number Average Value Number Average Value Number Average Value Number Average Value Number Average Value Number Average Value Number Average Value
LOANS ORIGINATED 86 $138,182 878 $116,481 812 $117,320 121 $41,638 3 $262,250 300 $131,731 1 $8,040 APPLICATIONS APPROVED, NOT ACCEPTED 5 $125,140 96 $109,731 196 $125,328 31 $32,631 0 $0 30 $138,677 2 $31,315 APPLICATIONS DENIED 13 $124,535 151 $123,518 528 $122,465 98 $57,804 0 $0 67 $142,365 4 $50,912 APPLICATIONS WITHDRAWN 10 $137,093 96 $124,519 397 $123,668 26 $103,385 1 $482,490 40 $139,395 0 $0 FILES CLOSED FOR INCOMPLETENESS 1 $89,350 24 $133,966 118 $129,213 5 $71,704 0 $0 5 $181,904 0 $0
Aggregated Statistics For Year 2005(Based on 1 full and 7 partial tracts) A) FHA, FSA/RHS & VA B) Conventional C) Refinancings D) Home Improvement Loans E) Loans on Dwellings For 5+ Families F) Non-occupant Loans on G) Loans On Manufactured Number Average Value Number Average Value Number Average Value Number Average Value Number Average Value Number Average Value Number Average Value
LOANS ORIGINATED 109 $133,309 893 $108,774 1,065 $115,172 109 $41,790 3 $252,027 205 $122,832 3 $17,910 APPLICATIONS APPROVED, NOT ACCEPTED 5 $132,828 98 $106,377 169 $110,536 23 $32,914 0 $0 24 $122,162 2 $72,850 APPLICATIONS DENIED 8 $111,656 156 $97,210 573 $123,225 127 $31,411 0 $0 44 $99,767 6 $50,893 APPLICATIONS WITHDRAWN 5 $139,406 117 $107,534 462 $125,972 57 $120,635 1 $418,160 30 $111,650 1 $6,520 FILES CLOSED FOR INCOMPLETENESS 1 $132,390 15 $87,502 84 $127,505 4 $48,082 0 $0 10 $95,514 0 $0
Aggregated Statistics For Year 2004(Based on 1 full and 7 partial tracts) A) FHA, FSA/RHS & VA B) Conventional C) Refinancings D) Home Improvement Loans E) Loans on Dwellings For 5+ Families F) Non-occupant Loans on G) Loans On Manufactured Number Average Value Number Average Value Number Average Value Number Average Value Number Average Value Number Average Value Number Average Value
LOANS ORIGINATED 118 $126,611 774 $110,115 1,297 $113,464 87 $41,654 2 $168,620 169 $120,646 5 $38,452 APPLICATIONS APPROVED, NOT ACCEPTED 8 $94,602 92 $96,485 235 $117,588 19 $34,352 0 $0 33 $120,976 3 $59,803 APPLICATIONS DENIED 19 $127,784 173 $108,740 574 $117,562 75 $31,333 0 $0 47 $139,426 3 $16,737 APPLICATIONS WITHDRAWN 6 $127,082 74 $113,297 411 $121,202 21 $42,804 0 $0 34 $125,011 1 $138,930 FILES CLOSED FOR INCOMPLETENESS 6 $114,965 18 $179,937 139 $126,217 6 $55,285 0 $0 10 $110,721 0 $0
Aggregated Statistics For Year 2003(Based on 1 full and 7 partial tracts) A) FHA, FSA/RHS & VA B) Conventional C) Refinancings D) Home Improvement Loans E) Loans on Dwellings For 5+ Families F) Non-occupant Loans on Number Average Value Number Average Value Number Average Value Number Average Value Number Average Value Number Average Value
LOANS ORIGINATED 145 $118,381 520 $117,490 2,459 $109,406 54 $19,316 4 $968,820 167 $118,086 APPLICATIONS APPROVED, NOT ACCEPTED 6 $117,523 54 $123,622 241 $111,866 10 $21,715 0 $0 12 $126,060 APPLICATIONS DENIED 14 $134,713 86 $110,109 606 $118,215 52 $34,128 0 $0 34 $117,399 APPLICATIONS WITHDRAWN 13 $125,251 68 $118,911 448 $115,351 8 $24,348 0 $0 17 $106,764 FILES CLOSED FOR INCOMPLETENESS 2 $105,465 20 $114,407 84 $126,758 4 $19,568 0 $0 5 $127,346
Aggregated Statistics For Year 2002(Based on 4 partial tracts) A) FHA, FSA/RHS & VA B) Conventional C) Refinancings D) Home Improvement Loans E) Loans on Dwellings For 5+ Families F) Non-occupant Loans on Number Average Value Number Average Value Number Average Value Number Average Value Number Average Value Number Average Value
LOANS ORIGINATED 75 $113,985 210 $111,852 780 $110,244 26 $17,282 1 $194,210 63 $114,897 APPLICATIONS APPROVED, NOT ACCEPTED 1 $98,910 20 $107,894 97 $104,946 9 $25,044 0 $0 3 $124,947 APPLICATIONS DENIED 9 $117,139 25 $100,376 174 $108,712 25 $16,948 0 $0 8 $92,588 APPLICATIONS WITHDRAWN 4 $139,168 25 $111,514 176 $106,156 5 $17,238 0 $0 5 $90,338 FILES CLOSED FOR INCOMPLETENESS 2 $75,500 13 $97,865 52 $107,335 1 $84,320 0 $0 4 $86,682
Aggregated Statistics For Year 2001(Based on 4 partial tracts) A) FHA, FSA/RHS & VA B) Conventional C) Refinancings D) Home Improvement Loans E) Loans on Dwellings For 5+ Families F) Non-occupant Loans on Number Average Value Number Average Value Number Average Value Number Average Value Number Average Value Number Average Value
LOANS ORIGINATED 131 $106,463 228 $118,534 596 $101,832 48 $32,096 4 $1,589,145 59 $98,462 APPLICATIONS APPROVED, NOT ACCEPTED 1 $108,960 18 $174,822 59 $93,423 11 $18,333 0 $0 1 $85,720 APPLICATIONS DENIED 6 $101,907 27 $114,899 170 $92,238 28 $13,957 0 $0 6 $93,107 APPLICATIONS WITHDRAWN 5 $80,326 21 $102,127 129 $100,495 8 $34,099 0 $0 6 $127,165 FILES CLOSED FOR INCOMPLETENESS 1 $40,210 4 $162,865 31 $120,274 1 $31,380 0 $0 1 $149,840
Aggregated Statistics For Year 2000(Based on 4 partial tracts) A) FHA, FSA/RHS & VA B) Conventional C) Refinancings D) Home Improvement Loans E) Loans on Dwellings For 5+ Families F) Non-occupant Loans on Number Average Value Number Average Value Number Average Value Number Average Value Number Average Value Number Average Value
LOANS ORIGINATED 90 $102,675 198 $99,227 159 $85,206 37 $15,518 2 $1,576,990 31 $77,068 APPLICATIONS APPROVED, NOT ACCEPTED 1 $82,200 19 $95,339 28 $83,854 12 $19,325 0 $0 2 $70,405 APPLICATIONS DENIED 4 $87,778 25 $84,071 68 $77,445 20 $15,034 0 $0 2 $74,565 APPLICATIONS WITHDRAWN 2 $91,880 15 $115,773 54 $76,335 6 $76,743 0 $0 3 $73,593 FILES CLOSED FOR INCOMPLETENESS 2 $73,895 6 $95,973 23 $87,006 2 $27,970 0 $0 0 $0
Aggregated Statistics For Year 1999(Based on 1 full and 4 partial tracts) A) FHA, FSA/RHS & VA B) Conventional C) Refinancings D) Home Improvement Loans E) Loans on Dwellings For 5+ Families F) Non-occupant Loans on Number Average Value Number Average Value Number Average Value Number Average Value Number Average Value Number Average Value
LOANS ORIGINATED 222 $93,439 354 $92,493 538 $80,815 93 $12,886 3 $239,757 58 $77,469 APPLICATIONS APPROVED, NOT ACCEPTED 4 $108,130 39 $91,909 105 $75,210 28 $21,792 0 $0 6 $58,942 APPLICATIONS DENIED 8 $105,916 70 $69,019 200 $74,583 49 $15,808 1 $2,367,680 11 $74,091 APPLICATIONS WITHDRAWN 8 $104,610 37 $87,631 136 $77,555 12 $49,738 0 $0 2 $89,550 FILES CLOSED FOR INCOMPLETENESS 1 $40,310 5 $111,178 28 $80,402 0 $0 0 $0 2 $132,705
Detailed HMDA statistics for the following Tracts:
0141.01
, 0141.04 , 0141.05 , 0141.07 , 0141.08 , 0148.02 , 0149.04 , 0149.05
Private Mortgage Insurance Companies Aggregated Statistics For Year 2009(Based on 1 full and 7 partial tracts) A) Conventional B) Refinancings C) Non-occupant Loans on Number Average Value Number Average Value Number Average Value
LOANS ORIGINATED 30 $149,535 38 $157,527 0 $0 APPLICATIONS APPROVED, NOT ACCEPTED 7 $160,887 19 $155,395 1 $203,640 APPLICATIONS DENIED 7 $164,330 5 $124,574 0 $0 APPLICATIONS WITHDRAWN 4 $122,638 6 $153,500 1 $64,610 FILES CLOSED FOR INCOMPLETENESS 2 $200,870 2 $188,000 2 $85,650
Aggregated Statistics For Year 2008(Based on 1 full and 7 partial tracts) A) Conventional B) Refinancings C) Non-occupant Loans on Number Average Value Number Average Value Number Average Value
LOANS ORIGINATED 102 $137,641 77 $157,434 15 $119,335 APPLICATIONS APPROVED, NOT ACCEPTED 26 $170,262 34 $160,583 4 $215,908 APPLICATIONS DENIED 5 $139,290 6 $172,185 2 $141,355 APPLICATIONS WITHDRAWN 3 $149,417 7 $157,517 1 $56,750 FILES CLOSED FOR INCOMPLETENESS 3 $161,067 3 $141,773 2 $138,065
Aggregated Statistics For Year 2007(Based on 1 full and 7 partial tracts) A) Conventional B) Refinancings C) Non-occupant Loans on Number Average Value Number Average Value Number Average Value
LOANS ORIGINATED 214 $140,870 101 $153,779 15 $148,289 APPLICATIONS APPROVED, NOT ACCEPTED 19 $142,923 27 $140,669 2 $152,805 APPLICATIONS DENIED 2 $147,315 2 $211,745 3 $146,233 APPLICATIONS WITHDRAWN 17 $147,174 5 $149,906 1 $301,260 FILES CLOSED FOR INCOMPLETENESS 0 $0 1 $137,600 0 $0
Aggregated Statistics For Year 2006(Based on 1 full and 7 partial tracts) A) Conventional B) Refinancings C) Non-occupant Loans on Number Average Value Number Average Value Number Average Value
LOANS ORIGINATED 133 $141,158 62 $149,431 11 $115,998 APPLICATIONS APPROVED, NOT ACCEPTED 7 $154,673 11 $146,592 0 $0 APPLICATIONS DENIED 0 $0 1 $160,220 0 $0 APPLICATIONS WITHDRAWN 3 $139,803 6 $147,853 0 $0 FILES CLOSED FOR INCOMPLETENESS 0 $0 1 $115,280 0 $0
Aggregated Statistics For Year 2005(Based on 1 full and 7 partial tracts) A) Conventional B) Refinancings C) Non-occupant Loans on Number Average Value Number Average Value Number Average Value
LOANS ORIGINATED 109 $138,907 91 $145,808 11 $110,325 APPLICATIONS APPROVED, NOT ACCEPTED 15 $120,699 25 $141,741 1 $168,930 APPLICATIONS DENIED 0 $0 4 $147,702 3 $166,140 APPLICATIONS WITHDRAWN 5 $115,488 6 $115,517 1 $171,840 FILES CLOSED FOR INCOMPLETENESS 3 $109,123 1 $243,610 1 $193,020
Aggregated Statistics For Year 2004(Based on 1 full and 7 partial tracts) A) Conventional B) Refinancings C) Non-occupant Loans on Number Average Value Number Average Value Number Average Value
LOANS ORIGINATED 153 $128,772 151 $133,700 22 $113,159 APPLICATIONS APPROVED, NOT ACCEPTED 26 $138,135 51 $129,119 7 $159,984 APPLICATIONS DENIED 2 $90,050 0 $0 0 $0 APPLICATIONS WITHDRAWN 10 $173,729 10 $133,439 3 $156,767 FILES CLOSED FOR INCOMPLETENESS 1 $142,140 2 $102,000 0 $0
Aggregated Statistics For Year 2003(Based on 1 full and 7 partial tracts) A) Conventional B) Refinancings C) Non-occupant Loans on Number Average Value Number Average Value Number Average Value
LOANS ORIGINATED 175 $133,502 342 $126,215 17 $117,208 APPLICATIONS APPROVED, NOT ACCEPTED 31 $134,117 105 $126,292 9 $128,044 APPLICATIONS DENIED 0 $0 4 $127,720 1 $158,150 APPLICATIONS WITHDRAWN 9 $122,824 17 $125,370 3 $158,837 FILES CLOSED FOR INCOMPLETENESS 0 $0 1 $145,270 0 $0
Aggregated Statistics For Year 2002(Based on 4 partial tracts) A) Conventional B) Refinancings C) Non-occupant Loans on Number Average Value Number Average Value Number Average Value
LOANS ORIGINATED 75 $116,160 99 $126,154 8 $108,671 APPLICATIONS APPROVED, NOT ACCEPTED 6 $122,888 21 $120,583 2 $187,140 APPLICATIONS DENIED 1 $178,840 3 $136,950 2 $92,400 APPLICATIONS WITHDRAWN 6 $108,095 8 $119,731 1 $136,860 FILES CLOSED FOR INCOMPLETENESS 1 $198,140 1 $127,200 0 $0
Aggregated Statistics For Year 2001(Based on 4 partial tracts) A) Conventional B) Refinancings C) Non-occupant Loans on Number Average Value Number Average Value Number Average Value
LOANS ORIGINATED 88 $121,695 82 $118,023 5 $79,788 APPLICATIONS APPROVED, NOT ACCEPTED 10 $124,587 10 $108,701 2 $51,375 APPLICATIONS DENIED 2 $87,475 1 $90,720 0 $0 APPLICATIONS WITHDRAWN 2 $117,340 1 $101,290 0 $0 FILES CLOSED FOR INCOMPLETENESS 1 $41,990 0 $0 0 $0
Aggregated Statistics For Year 2000(Based on 4 partial tracts) A) Conventional B) Refinancings C) Non-occupant Loans on Number Average Value Number Average Value Number Average Value
LOANS ORIGINATED 61 $102,906 18 $114,026 8 $94,518 APPLICATIONS APPROVED, NOT ACCEPTED 6 $138,910 3 $96,110 0 $0 APPLICATIONS DENIED 3 $112,867 0 $0 0 $0 APPLICATIONS WITHDRAWN 2 $65,670 2 $172,600 0 $0 FILES CLOSED FOR INCOMPLETENESS 0 $0 0 $0 0 $0
Aggregated Statistics For Year 1999(Based on 1 full and 4 partial tracts) A) Conventional B) Refinancings C) Non-occupant Loans on Number Average Value Number Average Value Number Average Value
LOANS ORIGINATED 131 $102,625 50 $92,949 5 $61,662 APPLICATIONS APPROVED, NOT ACCEPTED 7 $112,864 11 $78,332 1 $28,480 APPLICATIONS DENIED 4 $91,672 1 $59,110 1 $46,220 APPLICATIONS WITHDRAWN 3 $104,293 0 $0 0 $0 FILES CLOSED FOR INCOMPLETENESS 0 $0 1 $61,040 0 $0
Detailed PMIC statistics for the following Tracts:
0141.01
, 0141.04 , 0141.05 , 0141.07 , 0141.08 , 0148.02 , 0149.04 , 0149.05 Fire-safe hotels and motels in Blue Springs, Missouri:
Quality Inn, 701 NW S Outer Rd, Blue Springs, Missouri 64015 Phone: (816) 220-7400, Fax: (816) 220-7474
Days Inn, 451 NW Jefferson St, Blue Springs, Missouri 64014 Phone: (816) 224-1199, Fax: (816) 224-1183
Americas Best Value Inn, 1110 N Mo 7, Blue Springs, Missouri 64014 Phone: (816) 229-6363, Fax: (816) 228-7299
Quality Inn & Suites - Blue Springs, 3120 NW Jefferson St, Blue Springs, Missouri 64105 Phone: (816) 224-1122, Fax: (816) 228-1958
Comfort Inn, 1501 NW Northridge Dr, Blue Springs, Missouri 64015 Phone: (816) 224-2899, Fax: (816) 224-2008
Hampton Inn, 900 NW S Outer Rd, Blue Springs, Missouri 64015 Phone: (816) 220-3844, Fax: (816) 220-3461
La Quinta Inn & Suites, 3402 NW Jefferson St, Blue Springs, Missouri 64015 Phone: (816) 988-9980, Fax: (816) 988-9981
Drury Inn & Suites Kansas City Independence, 20300 E 42nd St S, Blue Springs, Missouri 64015 Phone: (816) 795-9393
2 other hotels and motels
All 10 fire-safe hotels and motels in Blue Springs, Missouri
Most common first names in Blue Springs, MO among deceased individuals Name Count Lived (average)
Mary 162 78.8 years William 134 73.0 years John 127 72.7 years Robert 114 71.8 years James 112 70.9 years Charles 92 75.4 years Dorothy 75 78.7 years Helen 68 81.0 years George 57 77.1 years Betty 52 72.9 years
Most common last names in Blue Springs, MO among deceased individuals Last name Count Lived (average)
Smith 70 73.5 years Brown 46 76.5 years Johnson 42 79.2 years Miller 38 75.1 years Martin 32 72.8 years Williams 31 76.6 years Wilson 29 75.4 years Jones 28 81.5 years Davis 28 73.6 years White 28 74.6 years
Blue Springs compared to Missouri state average:
Unemployed percentage significantly below state average. Hispanic race population percentage above state average. Foreign-born population percentage below state average. Length of stay since moving in significantly above state average. House age below state average. Percentage of population with a bachelor's degree or higher above state average. Blue Springs on our top lists :
#6 on the list of "Top 101 cities with the highest percentage of English-only speaking households, population 50,000+"
#13 on the list of "Top 101 cities with largest percentage of workers with very short commute times (9 minutes or less) (population 50,000+)"
#20 on the list of "Top 101 cities with largest percentage of females in industries: finance and insurance (population 50,000+)"
#40 on the list of "Top 101 cities with the smallest percentage of likely homosexual households (counted as self-reported same-sex unmarried-partner households) (population 50,000+)"
#40 on the list of "Top 101 cities with the largest city-data.com crime index increase from 2011 to 2012 (population 50,000+)"
#44 on the list of "Top 100 cities with lowest ratio of median house value to median household income (pop. 50,000+)"
#64 on the list of "Top 101 cities with the smallest differences between morning and afternoon humidity (population 50,000+)"
#64 on the list of "Top 101 cities with the smallest humidity differences during a year (population 50,000+)"
#66 on the list of "Top 101 cities that people commute from (largest negative percentage daily daytime population change due to commuting) (population 50,000+)"
#73 on the list of "Top 100 cities with highest median household income and median resident age less than 35 (pop. 50,000+)"
#82 on the list of "Top 101 cities with largest percentage of males in occupations: law enforcement workers including supervisors (population 50,000+)"
#82 on the list of "Top 101 cities with the largest temperature differences during a year (population 50,000+)"
#83 on the list of "Top 101 cities with the smallest household incomes disparities (population 50,000+)"
#83 on the list of "Top 101 cities with the smallest percentage of elementary and middle school students in private schools (5,000+ students)"
#93 on the list of "Top 101 cities with the lowest cost per building permit (population 50,000+)"
#95 on the list of "Top 101 cities with the most residents born in Europe, n.e.c. (population 500+)"
#98 on the list of "Top 100 least racially diverse cities (pop. 50,000+)"
#100 on the list of "Top 100 high-educated but low-earning cities (pop. 50,000+)"
#4 on the list of "Top 101 counties with the highest Sulfur Oxides Annual air pollution readings in 2012 (µg/m3 )"
#20 on the list of "Top 101 counties with the highest Particulate Matter (PM10 ) Annual air pollution readings in 2012 (µg/m3 )"
#25 on the list of "Top 101 counties with the most Black Protestant adherents"
#26 on the list of "Top 101 counties with the most Black Protestant congregations"
#37 on the list of "Top 101 counties with the lowest surface withdrawal of fresh water for public supply (pop. 50,000+)"
Top Patent Applicants
Mark Alan Fanara (13)
Nicholas Nicas (9)
Mark Joseph Bartonek (7)
Bon F. Shaw (7)
Benjamin Paul Church (6)
Bradford T. Stilwell (5)
Robert D. Haler (5)
Donald S. Nadler (5)
Sara J. Boswell (4)
Stephen Mcgarry Hatch (4)
Total of 183 patent applications in 2008-2024.
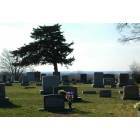
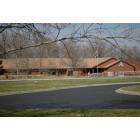

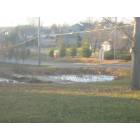
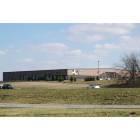
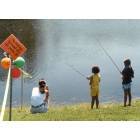
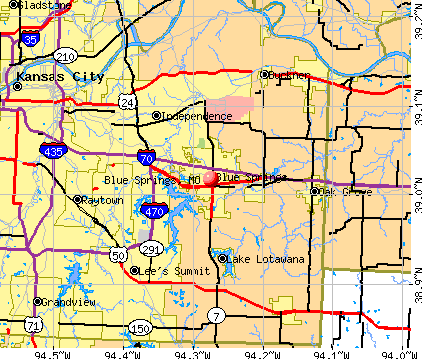


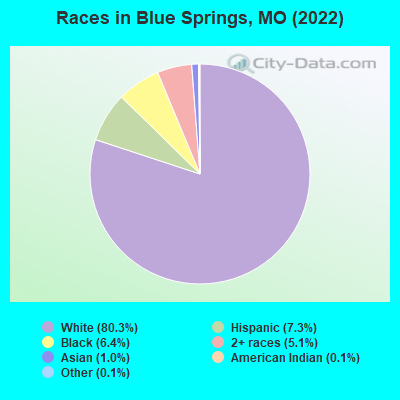
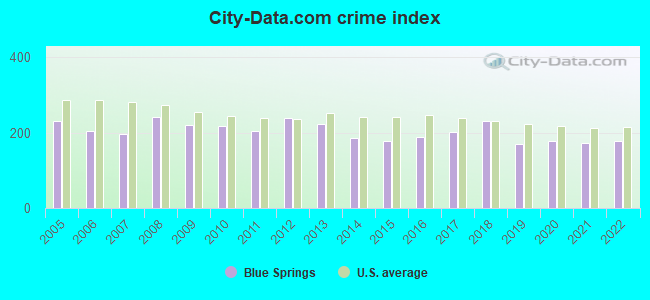
 Recent articles from our blog. Our writers, many of them Ph.D. graduates or candidates, create easy-to-read articles on a wide variety of topics.

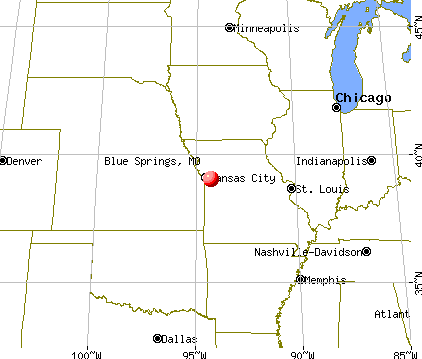
 (8.3 miles
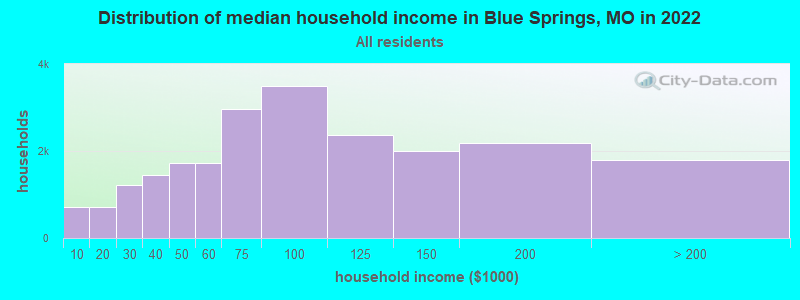
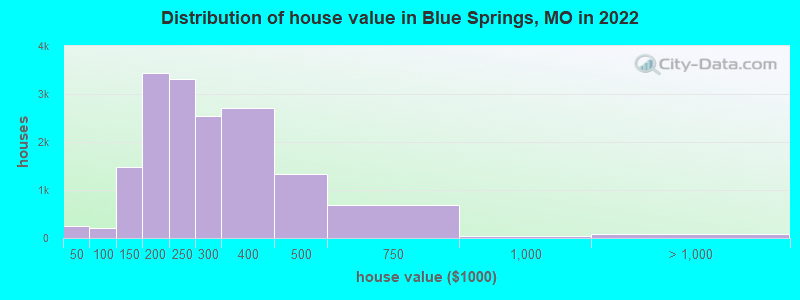
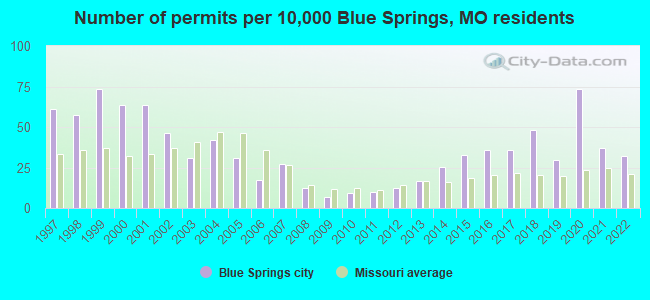
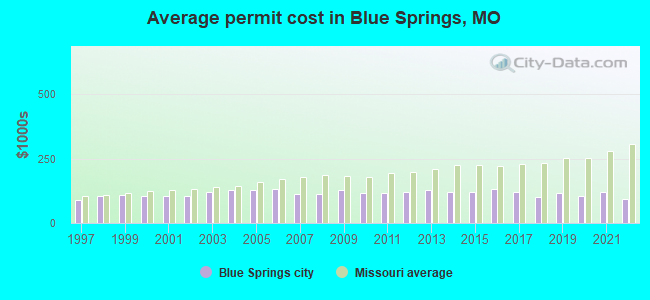
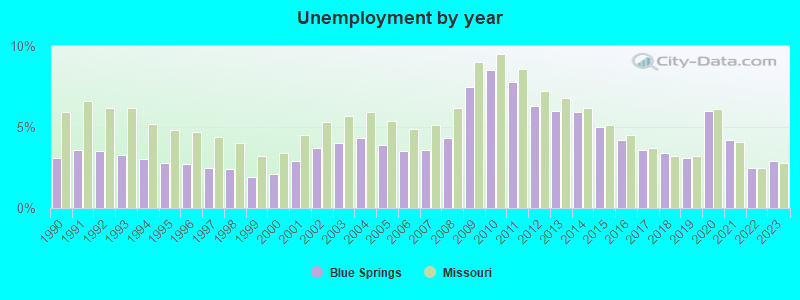
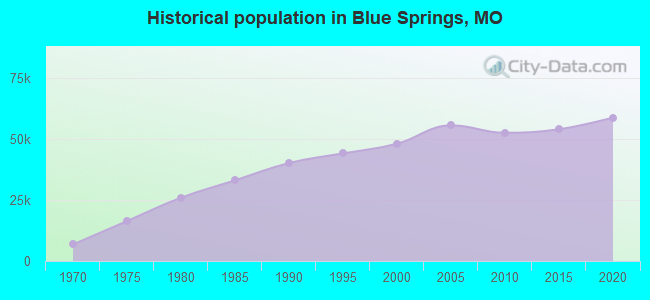
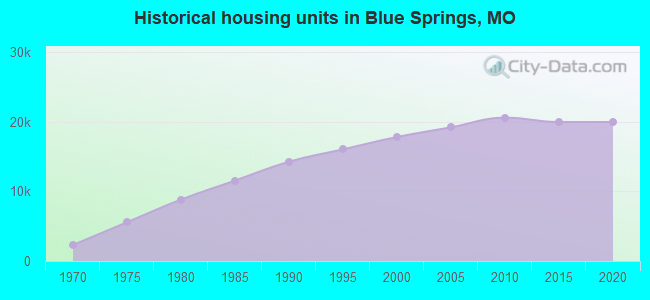
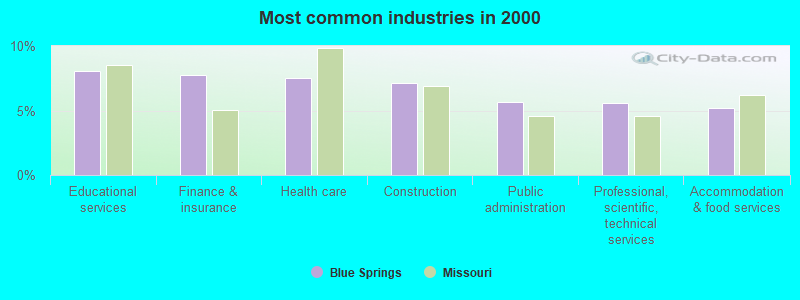
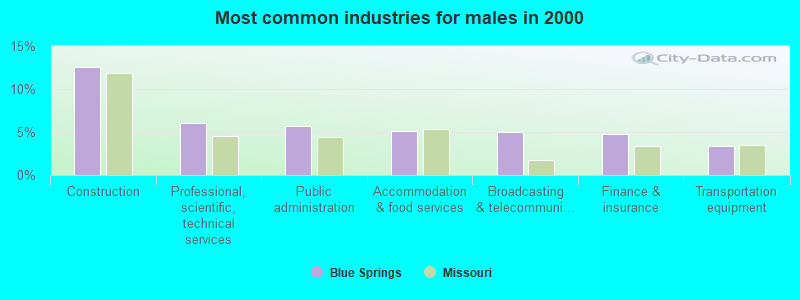
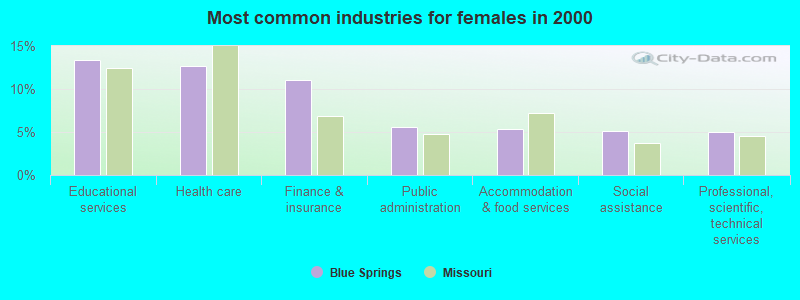
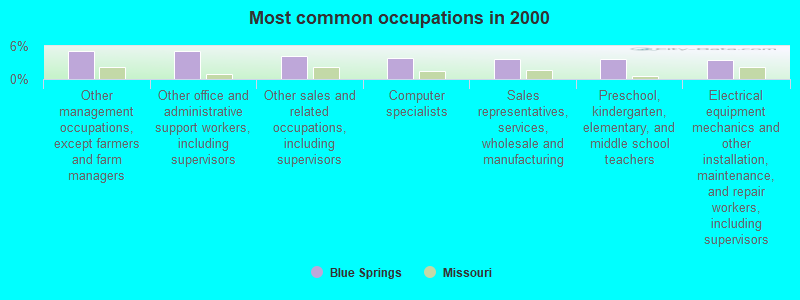
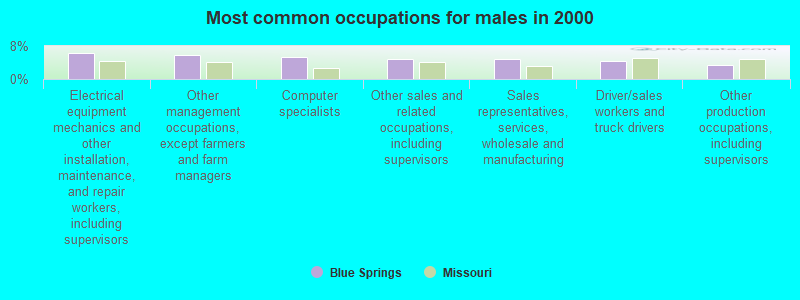
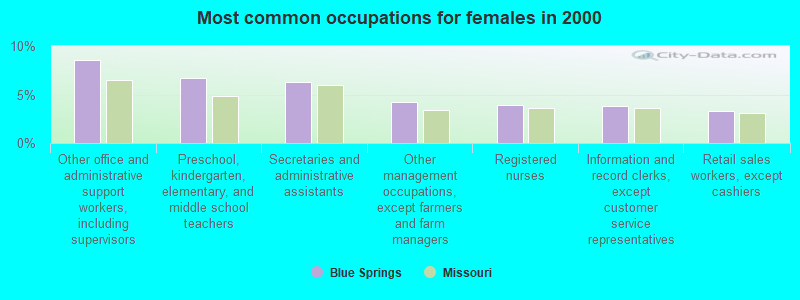
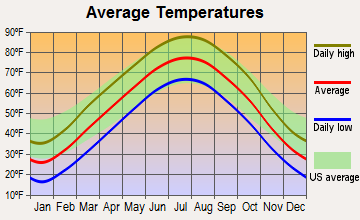
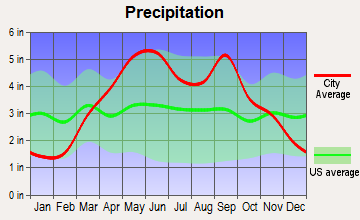
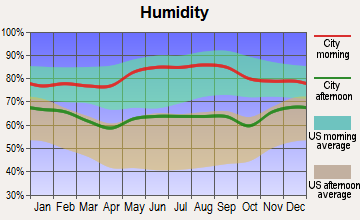
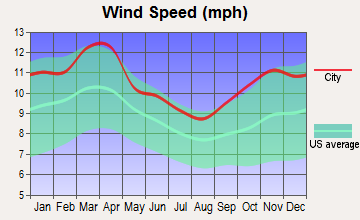
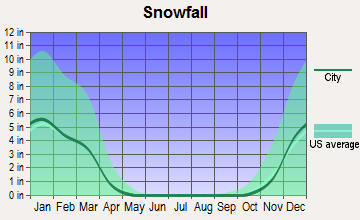
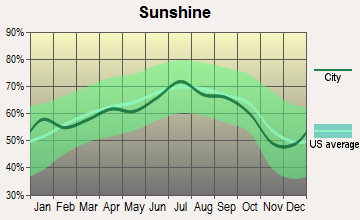
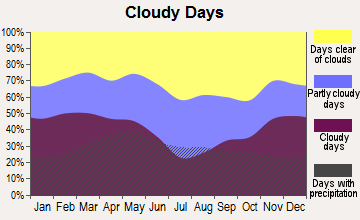
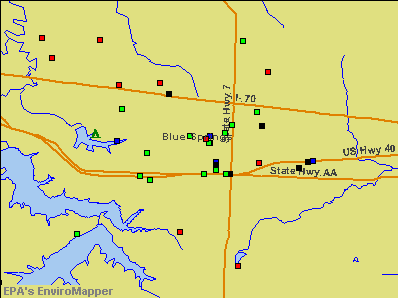


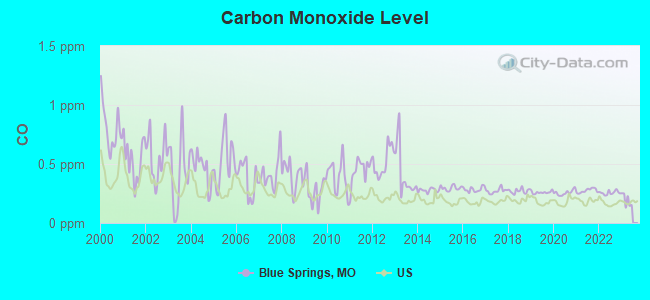
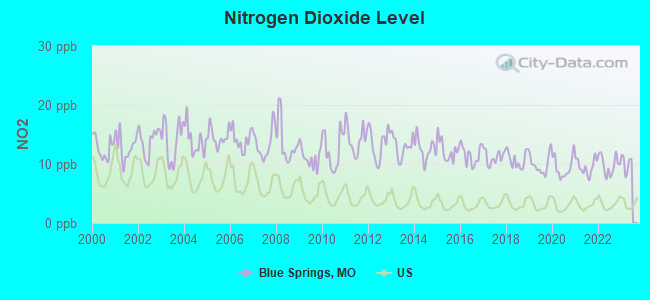
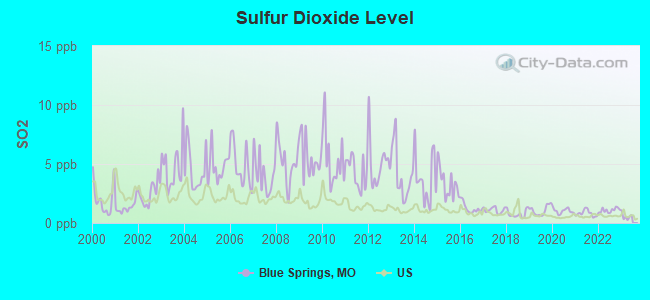
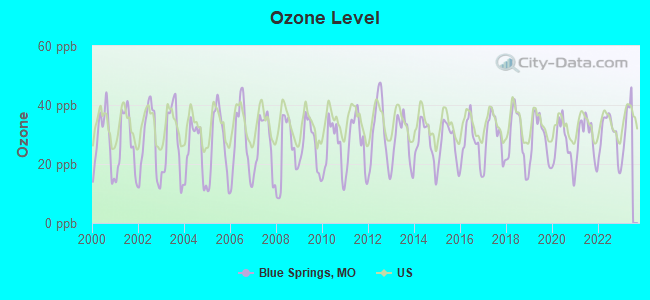
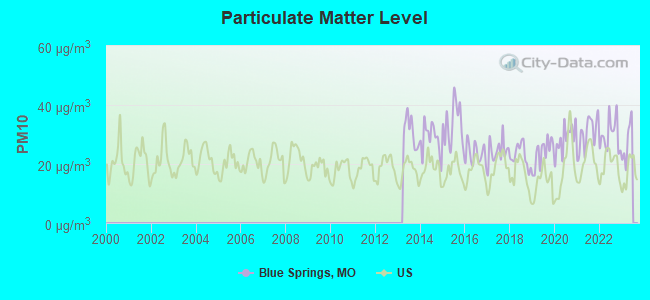
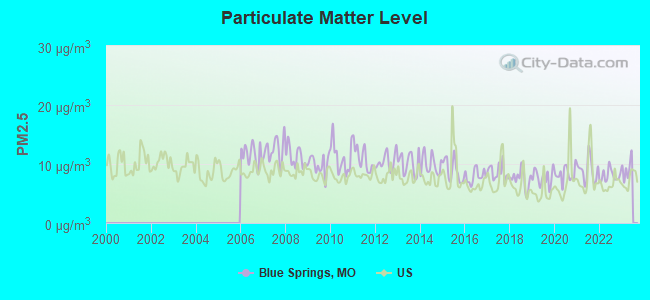

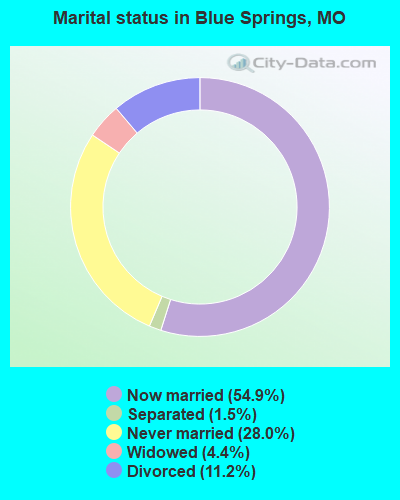
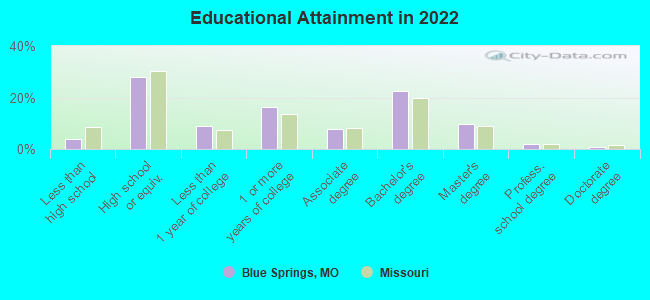
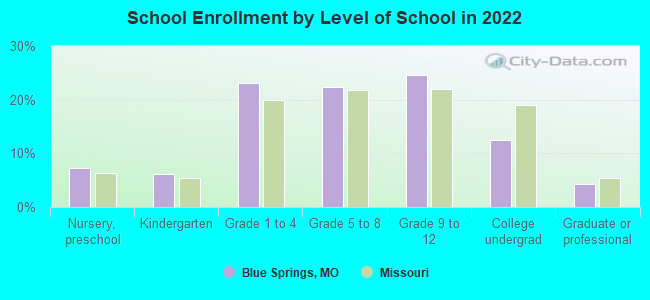
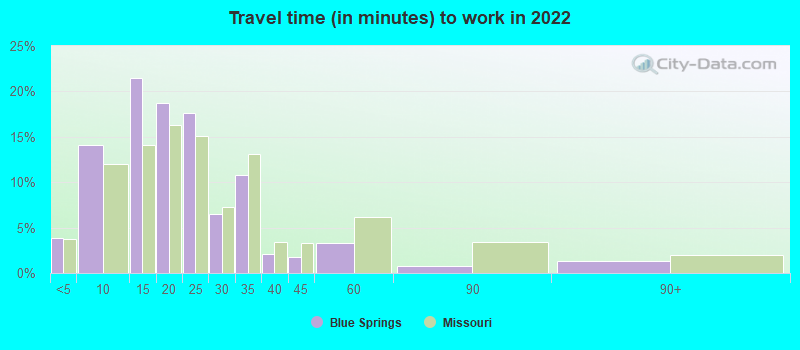
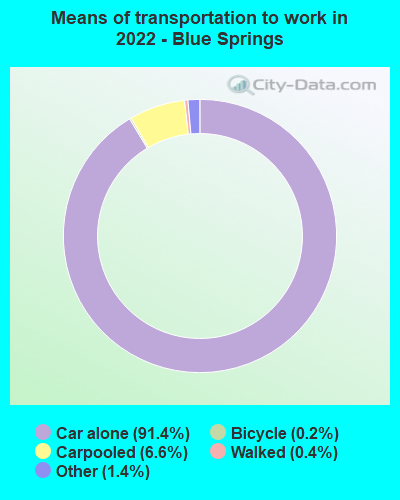
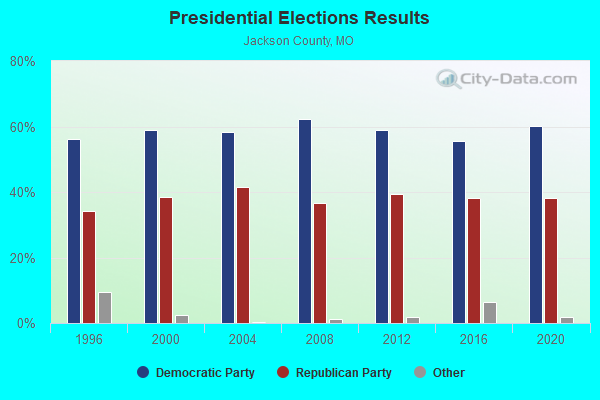
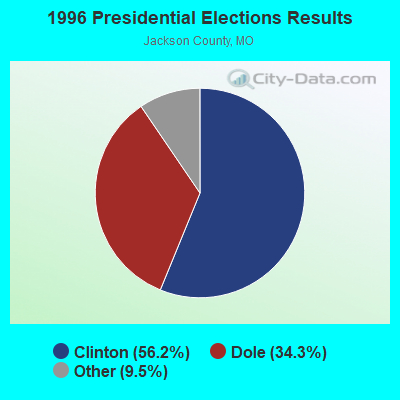
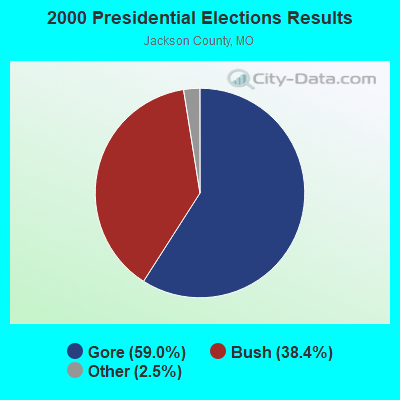
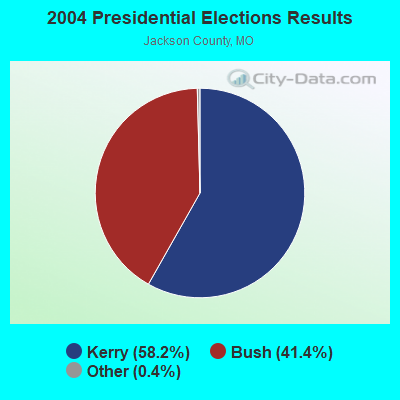
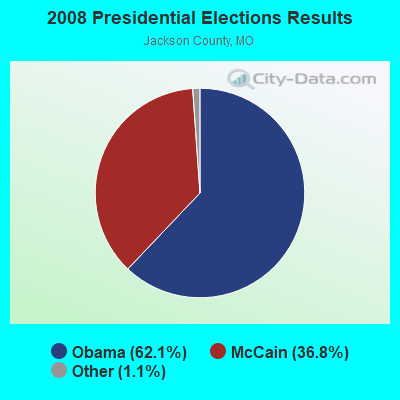
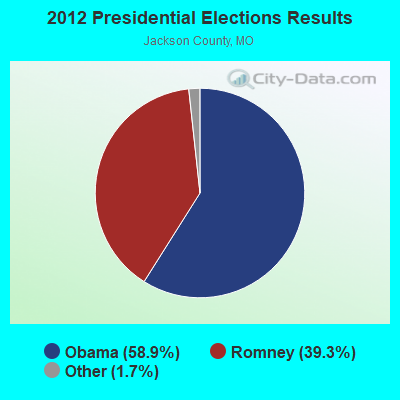
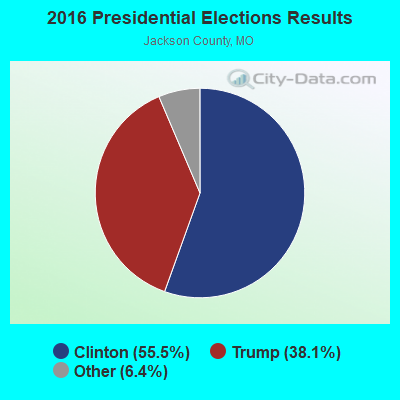
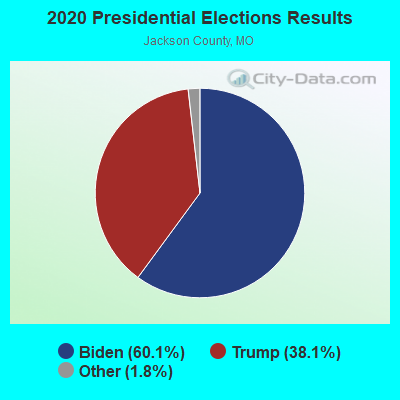
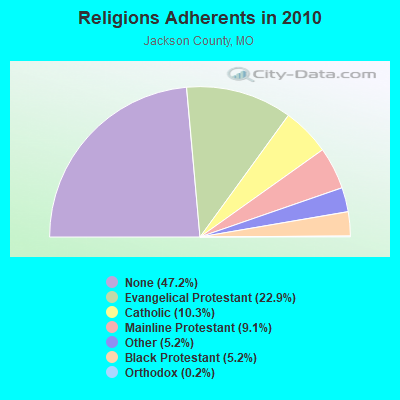
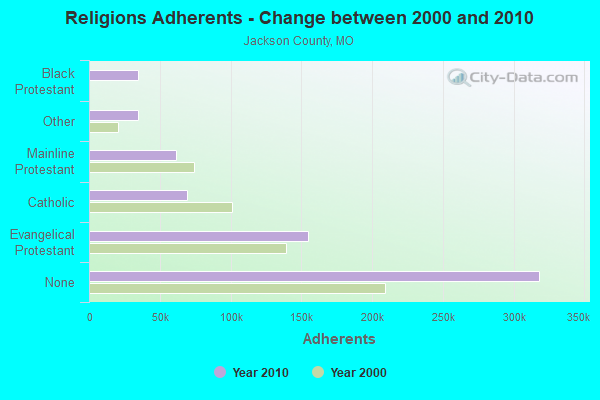
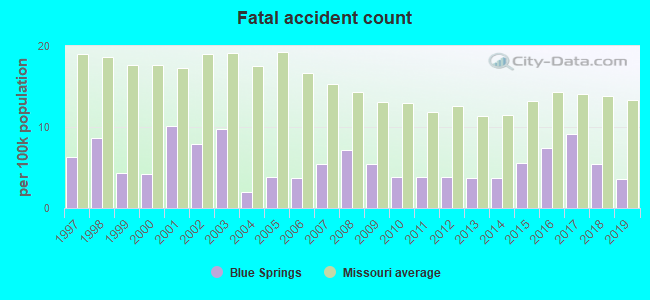
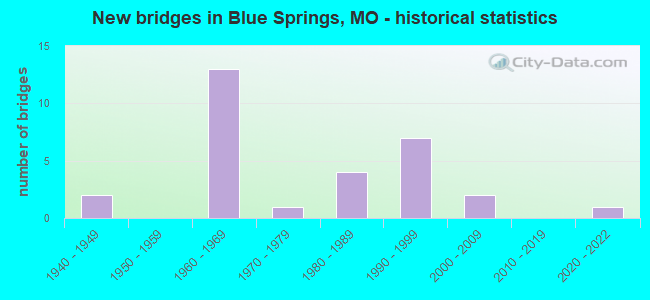
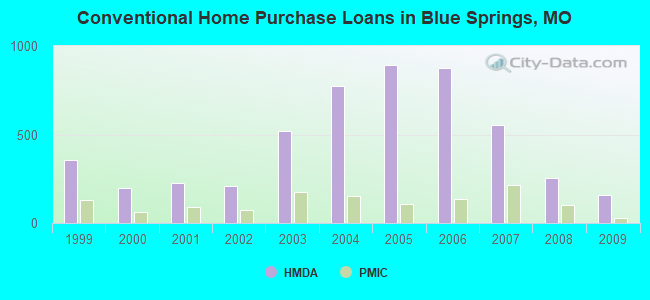
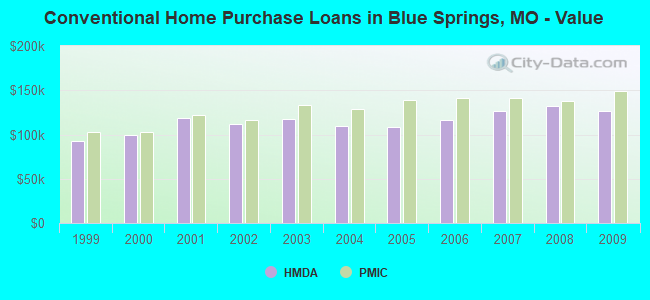
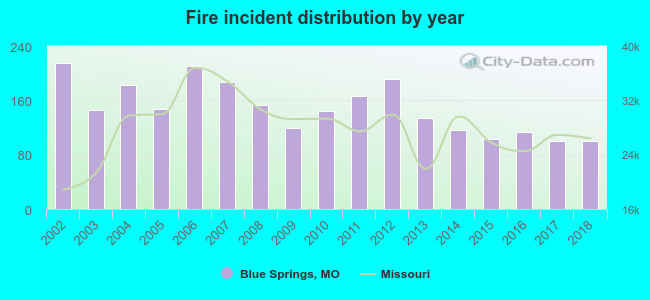 According to the data from the years 2002 - 2018 the average number of fire incidents per year is 149. The highest number of reported fire incidents - 215 took place in 2002, and the least - 100 in 2017. The data has a dropping trend.
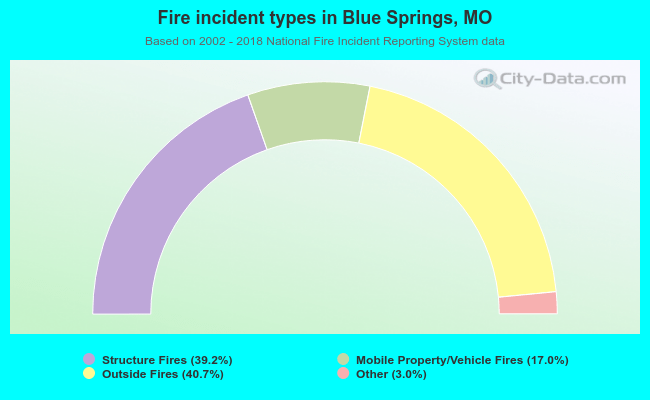 When looking into fire subcategories, the most incidents belonged to: Outside Fires (40.7%), and Structure Fires (39.2%).