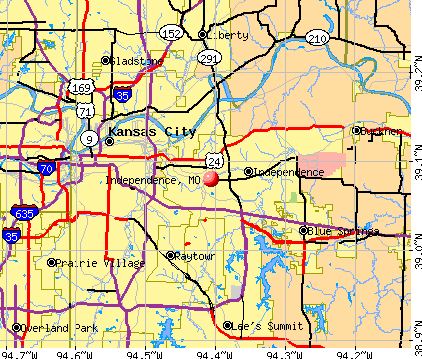
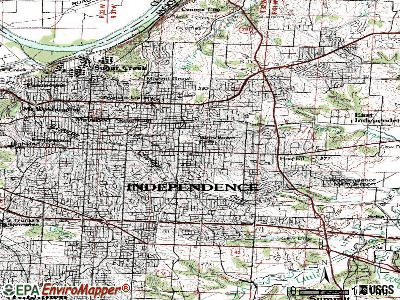
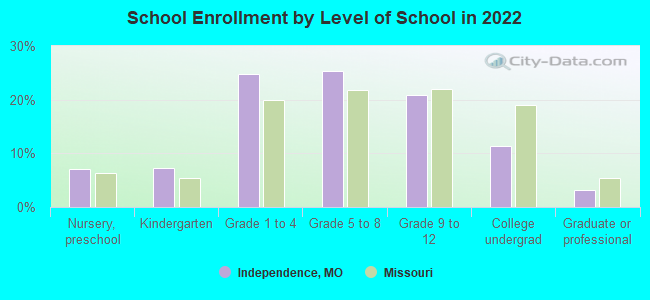
Independence, Missouri
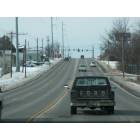
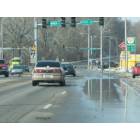
Independence: Independence Ave (Hwy 24)
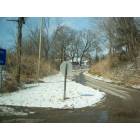
Independence: February 2008 Snow
Independence: Independence Ave (Hwy 24)
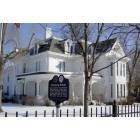
Independence: Truman House
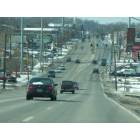
Independence: Independence Ave (Hwy 24) becomes Winner Road
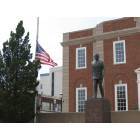
Independence: Truman statue
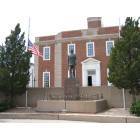
Independence: Truman statue and court house

Independence: Picture of a sunset from my house in East Indepence.
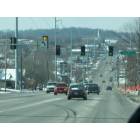
Independence: Independence Ave (Hwy 24) and Kansas City skyline in the distance
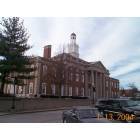
Independence: Old Courthouse on the Square
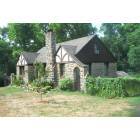
Independence: Golden Acres - Historic Subdivision from 1936
- see
20
more - add
your
Submit your own pictures of this city and show them to the world
- OSM Map
- General Map
- Google Map
- MSN Map
Population change since 2000: +7.0%
 |
| Males: 59,476 | |
| Females: 61,726 |
| Median resident age: | 40.2 years |
| Missouri median age: | 39.1 years |
Zip codes: 64050, 64052, 64053, 64054, 64055, 64056, 64058, 64120, 64133, 64136.
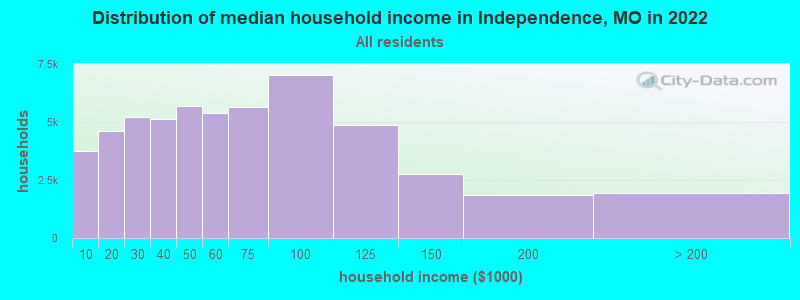
Independence Zip Code Map| Independence: | $53,082 |
| MO: | $64,811 |
Estimated per capita income in 2022: $31,714 (it was $19,384 in 2000)
Independence city income, earnings, and wages data
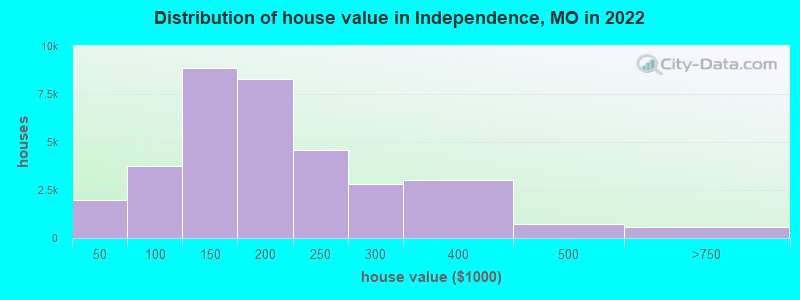
Estimated median house or condo value in 2022: $165,200 (it was $76,000 in 2000)
| Independence: | $165,200 |
| MO: | $221,200 |
Mean prices in 2022: all housing units: $181,537; detached houses: $185,340; townhouses or other attached units: $175,497; in 2-unit structures: $143,622; in 5-or-more-unit structures: $164,614; mobile homes: $36,231
Median gross rent in 2022: $1,036.
(13.6% for White Non-Hispanic residents, 29.9% for Black residents, 22.7% for Hispanic or Latino residents, 25.1% for American Indian residents, 29.0% for other race residents, 21.1% for two or more races residents)
Detailed information about poverty and poor residents in Independence, MO


Compare current foreclosures in Independence, MO:
| Photo | Address | Area | Beds / Baths | Price | Details |
|---|---|---|---|---|---|

|
#1
E 34th St S
Independence, MO 64052
|
1,656 sq. feet
|
1 baths 3 beds |
$235,000
|
show details |

|
#2
E Susquehanna Dr
Independence, MO 64056
|
6,462 sq. feet
|
10 baths 12 beds |
show details | |

|
#3
S Ash Ave
Independence, MO 64052
|
922 sq. feet
|
1 baths 2 beds |
show details | |

|
#4
S Greenwich Ln
Independence, MO 64055
|
1,000 sq. feet
|
1 baths 3 beds |
show details | |

|
#5
E 8th St N
Independence, MO 64056
|
967 sq. feet
|
1 baths 3 beds |
show details | |

|
#6
E 47th Ter S
Independence, MO 64055
|
950 sq. feet
|
1 baths 2 beds |
show details | |

|
#7
E Blackhawk Trl
Independence, MO 64056
|
1,334 sq. feet
|
2 baths 3 beds |
show details | |

|
#8
N Ponca Dr
Independence, MO 64058
|
725 sq. feet
|
1 baths 2 beds |
show details | |

|
#9
N Union St
Independence, MO 64050
|
912 sq. feet
|
2 baths 3 beds |
show details | |

|
#10
Bryn Mawr Dr
Independence, MO 64057
|
1,296 sq. feet
|
2 baths 3 beds |
show details |
| Photo | Address | Area | Beds / Baths | Price | Details |
|---|---|---|---|---|---|

|
#11
E Millhaven St
Independence, MO 64056
|
1,060 sq. feet
|
1 baths 3 beds |
show details | |

|
#12
E 9th St S
Independence, MO 64054
|
864 sq. feet
|
2 baths 2 beds |
show details | |

|
#13
E 14th Ter N
Independence, MO 64058
|
713 sq. feet
|
1 baths 3 beds |
show details | |

|
#14
E 15th St S
Independence, MO 64052
|
624 sq. feet
|
1 baths 2 beds |
show details | |

|
#15
S Turner Ave
Independence, MO 64056
|
1,205 sq. feet
|
1 baths 2 beds |
show details | |

|
#16
Woodbury St
Independence, MO 64055
|
1,078 sq. feet
|
1 baths 3 beds |
show details | |

|
#17
N Viking Dr
Independence, MO 64056
|
950 sq. feet
|
1 baths 3 beds |
show details | |

|
#18
N Pearl St
Independence, MO 64050
|
792 sq. feet
|
1 baths 2 beds |
show details | |

|
#19
S Leslie Ave
Independence, MO 64055
|
1,116 sq. feet
|
2 baths 2 beds |
show details | |

|
#20
S Debra St
Independence, MO 64055
|
1,053 sq. feet
|
3 baths 3 beds |
show details |
| Photo | Address | Area | Beds / Baths | Price | Details |
|---|---|---|---|---|---|

|
#21
S Leslie St
Independence, MO 64050
|
735 sq. feet
|
1 baths 2 beds |
show details | |

|
#22
E Lexington Ave
Independence, MO 64054
|
1,418 sq. feet
|
2 baths 3 beds |
show details | |

|
#23
E 37th St S
Independence, MO 64055
|
1,047 sq. feet
|
1 baths 2 beds |
show details | |

|
#24
E 39th Ter S
Independence, MO 64052
|
1,676 sq. feet
|
2 baths 3 beds |
show details | |

|
#25
E Crackerneck Rd
Independence, MO 64055
|
999 sq. feet
|
3 baths 3 beds |
show details | |

|
#26
James Downey Rd
Independence, MO 64057
|
1,240 sq. feet
|
1 baths 3 beds |
show details | |

|
#27
E 39th Ter S
Independence, MO 64052
|
854 sq. feet
|
1 baths 2 beds |
show details | |

|
#28
S Grand Ave
Independence, MO 64055
|
1,160 sq. feet
|
3 baths 3 beds |
show details | |

|
#29
N Aztec Ave
Independence, MO 64056
|
1,325 sq. feet
|
2 baths 3 beds |
show details | |

|
#30
S Hunter St
Independence, MO 64050
|
1,056 sq. feet
|
1 baths 3 beds |
show details |
| Photo | Address | Area | Beds / Baths | Price | Details |
|---|---|---|---|---|---|

|
#31
N Emery St
Independence, MO 64050
|
1,056 sq. feet
|
2 baths 3 beds |
show details | |

|
#32
N Vermont St
Independence, MO 64054
|
1,329 sq. feet
|
1 baths 3 beds |
show details | |

|
#33
S Lacy Rd
Independence, MO 64050
|
1,126 sq. feet
|
2 baths 3 beds |
show details | |

|
#34
N Vista Dr
Independence, MO 64056
|
1,050 sq. feet
|
1 baths 3 beds |
show details | |

|
#35
N Cherokee St
Independence, MO 64058
|
875 sq. feet
|
1 baths 3 beds |
show details | |

|
#36
E Gudgell Ave
Independence, MO 64055
|
1,624 sq. feet
|
2 baths 4 beds |
show details | |

|
#37
Appleton Ave
Independence, MO 64052
|
888 sq. feet
|
1 baths 3 beds |
show details | |

|
#38
N Whitney Rd
Independence, MO 64058
|
1,048 sq. feet
|
1 baths 2 beds |
show details | |

|
#39
N Jennings Rd
Independence, MO 64058
|
972 sq. feet
|
1 baths 3 beds |
show details | |

|
#40
Broadway St
Independence, MO 64050
|
1,040 sq. feet
|
1 baths 3 beds |
show details |
| Photo | Address | Area | Beds / Baths | Price | Details |
|---|---|---|---|---|---|

|
#41
E R D Mize Rd
Independence, MO 64057
|
1,284 sq. feet
|
1 baths 3 beds |
show details | |

|
#42
E 25th St S
Independence, MO 64055
|
964 sq. feet
|
1 baths 3 beds |
show details | |

|
#43
E 37th Ter S
Independence, MO 64055
|
1,440 sq. feet
|
2 baths 3 beds |
show details | |

|
#44
E 39th Ter S
Independence, MO 64055
|
1,046 sq. feet
|
2 baths 4 beds |
show details | |

|
#45
N Cherokee St
Independence, MO 64056
|
1,004 sq. feet
|
2 baths 3 beds |
show details | |

|
#46
E 42nd Ter S
Independence, MO 64055
|
1,162 sq. feet
|
2 baths 3 beds |
show details | |

|
#47
Belmont Blvd
Independence, MO 64057
|
938 sq. feet
|
2 baths 3 beds |
show details | |

|
#48
E South Ave
Independence, MO 64050
|
1,076 sq. feet
|
2 baths 3 beds |
show details | |

|
#49
N Geronimo Dr
Independence, MO 64056
|
900 sq. feet
|
1 baths 3 beds |
show details | |

|
Check over 1 million property listings on Foreclosure.com!
|
browse all offers | |||


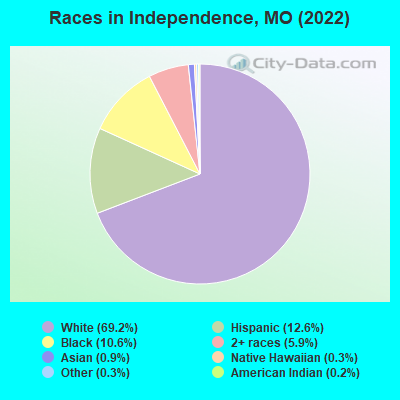
- 83,87569.2%White alone
- 15,21412.6%Hispanic
- 12,85010.6%Black alone
- 7,1795.9%Two or more races
- 1,0570.9%Asian alone
- 3990.3%Native Hawaiian and Other
Pacific Islander alone - 3980.3%Other race alone
- 2390.2%American Indian alone
Races in Independence detailed stats: ancestries, foreign born residents, place of birth
According to our research of Missouri and other state lists, there were 444 registered sex offenders living in Independence, Missouri as of April 27, 2024.
The ratio of all residents to sex offenders in Independence is 267 to 1.
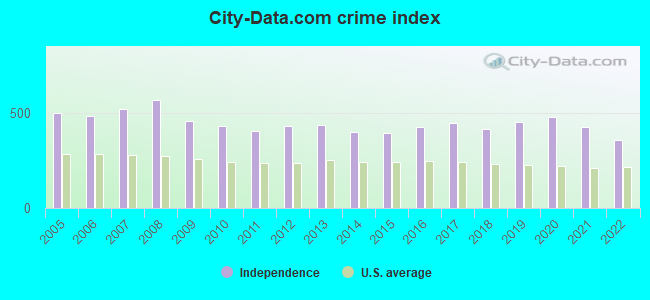
The City-Data.com crime index weighs serious crimes and violent crimes more heavily. Higher means more crime, U.S. average is 246.1. It adjusts for the number of visitors and daily workers commuting into cities.
- means the value is smaller than the state average.- means the value is about the same as the state average.
- means the value is bigger than the state average.
- means the value is much bigger than the state average.
Crime rate in Independence detailed stats: murders, rapes, robberies, assaults, burglaries, thefts, arson
Full-time law enforcement employees in 2021, including police officers: 267 (191 officers - 169 male; 22 female).
| Officers per 1,000 residents here: | 1.64 |
| Missouri average: | 2.54 |
 Recent articles from our blog. Our writers, many of them Ph.D. graduates or candidates, create easy-to-read articles on a wide variety of topics.

 | Independence Square Katz Building (2 replies) |
| Questions about Independence (53 replies) |
| Thinking about moving to independence (3 replies) |
| Looking for up to date info about High Schools in KC and Independence (21 replies) |
| Independence parks, etc (5 replies) |
| Old house Independence, MO (7 replies) |
Latest news from Independence, MO collected exclusively by city-data.com from local newspapers, TV, and radio stations
Ancestries: European (14.3%), German (11.7%), American (9.4%), Irish (7.9%), English (5.8%), Scottish (2.2%).
Current Local Time: CST time zone
Incorporated in 1849
Elevation: 1033 feet
Land area: 78.3 square miles.
Population density: 1,547 people per square mile (low).
5,122 residents are foreign born (2.6% Latin America, 0.8% Asia, 0.5% Europe).
| This city: | 4.2% |
| Missouri: | 4.2% |
Median real estate property taxes paid for housing units with mortgages in 2022: $1,777 (1.0%)
Median real estate property taxes paid for housing units with no mortgage in 2022: $1,652 (1.1%)
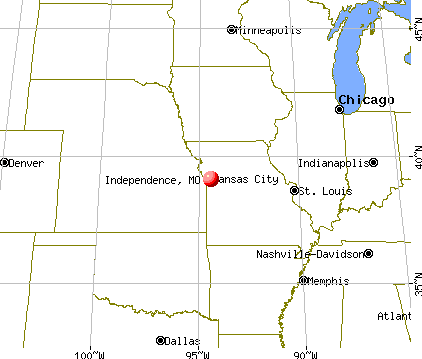
Nearest city with pop. 200,000+: Kansas City, MO  (8.0 miles , pop. 441,545).
Nearest city with pop. 1,000,000+: Chicago, IL (402.1 miles , pop. 2,896,016).
Nearest cities:
), ), ), Latitude: 39.08 N, Longitude: 94.41 W
Daytime population change due to commuting: -17,049 (-14.1%)
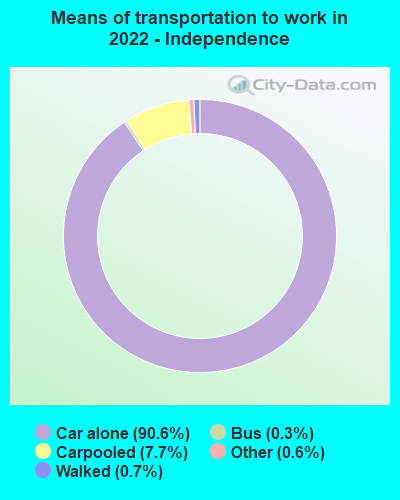
Workers who live and work in this city: 18,226 (32.4%)
Area code commonly used in this area: 816
Property values in Independence, MO
Independence, Missouri accommodation & food services, waste management - Economy and Business Data
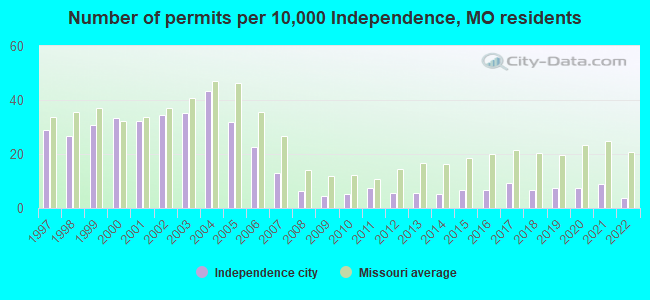
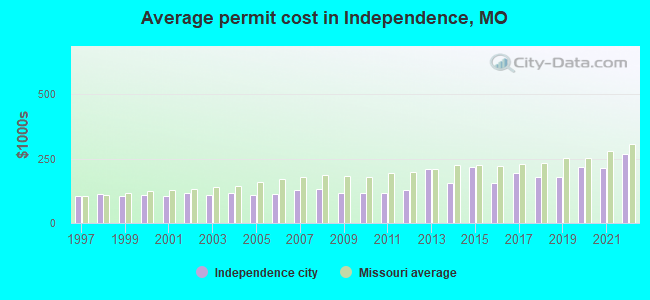
Single-family new house construction building permits:
- 2022: 40 buildings, average cost: $266,200
- 2021: 99 buildings, average cost: $212,000
- 2020: 82 buildings, average cost: $216,200
- 2019: 86 buildings, average cost: $180,200
- 2018: 77 buildings, average cost: $176,700
- 2017: 103 buildings, average cost: $195,000
- 2016: 75 buildings, average cost: $155,100
- 2015: 77 buildings, average cost: $218,700
- 2014: 60 buildings, average cost: $153,700
- 2013: 65 buildings, average cost: $210,400
- 2012: 65 buildings, average cost: $126,200
- 2011: 84 buildings, average cost: $115,200
- 2010: 60 buildings, average cost: $114,600
- 2009: 52 buildings, average cost: $114,700
- 2008: 70 buildings, average cost: $130,000
- 2007: 148 buildings, average cost: $128,900
- 2006: 257 buildings, average cost: $111,000
- 2005: 360 buildings, average cost: $109,200
- 2004: 492 buildings, average cost: $115,000
- 2003: 399 buildings, average cost: $109,300
- 2002: 392 buildings, average cost: $117,800
- 2001: 363 buildings, average cost: $103,600
- 2000: 376 buildings, average cost: $107,600
- 1999: 349 buildings, average cost: $104,000
- 1998: 302 buildings, average cost: $111,200
- 1997: 329 buildings, average cost: $104,000
| Here: | 3.4% |
| Missouri: | 2.8% |
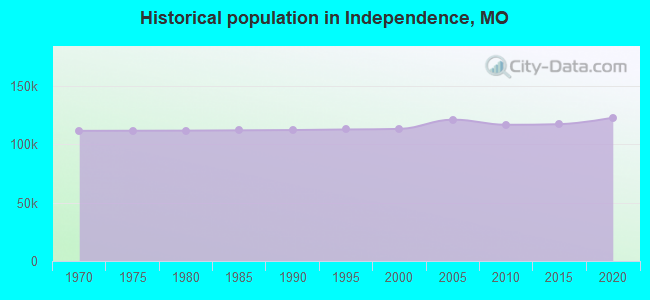
Population change in the 1990s: +910 (+0.8%).
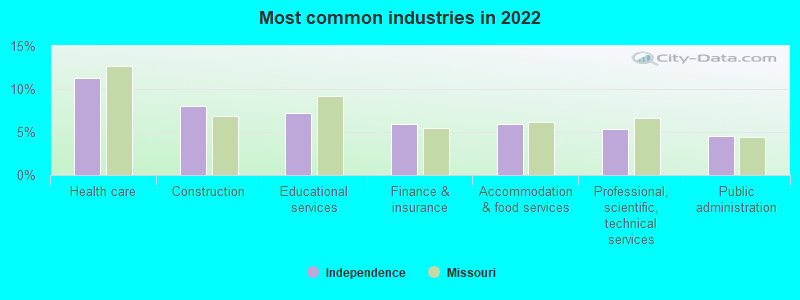
- Health care (11.3%)
- Construction (8.0%)
- Educational services (7.2%)
- Finance & insurance (6.0%)
- Accommodation & food services (5.9%)
- Professional, scientific, technical services (5.3%)
- Public administration (4.5%)
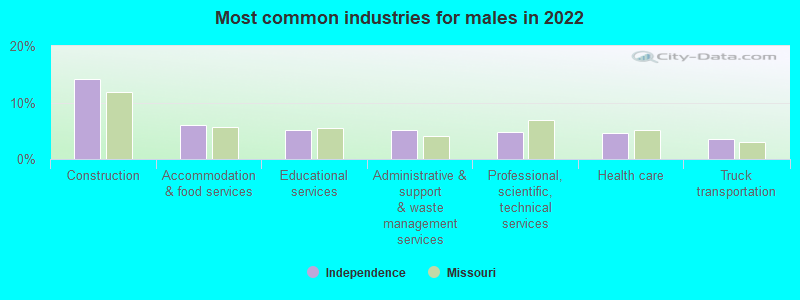
- Construction (14.2%)
- Accommodation & food services (6.0%)
- Educational services (5.1%)
- Administrative & support & waste management services (5.1%)
- Professional, scientific, technical services (4.7%)
- Health care (4.6%)
- Truck transportation (3.6%)
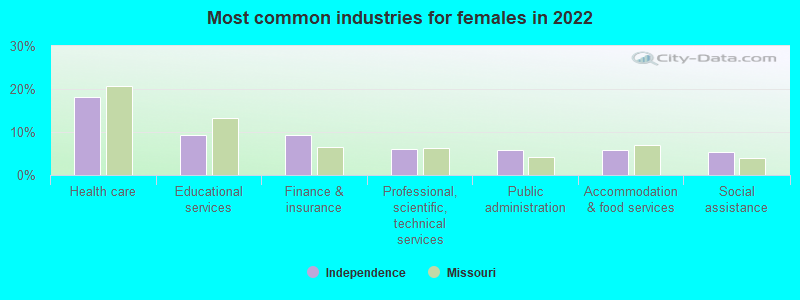
- Health care (18.1%)
- Educational services (9.3%)
- Finance & insurance (9.2%)
- Professional, scientific, technical services (6.0%)
- Public administration (5.8%)
- Accommodation & food services (5.8%)
- Social assistance (5.5%)
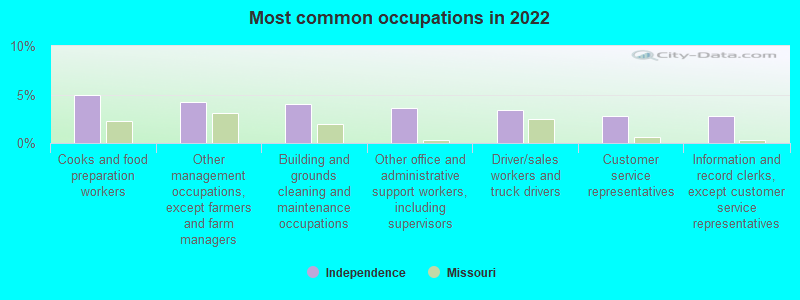
- Cooks and food preparation workers (5.0%)
- Other management occupations, except farmers and farm managers (4.2%)
- Building and grounds cleaning and maintenance occupations (4.1%)
- Other office and administrative support workers, including supervisors (3.7%)
- Driver/sales workers and truck drivers (3.4%)
- Customer service representatives (2.8%)
- Information and record clerks, except customer service representatives (2.8%)
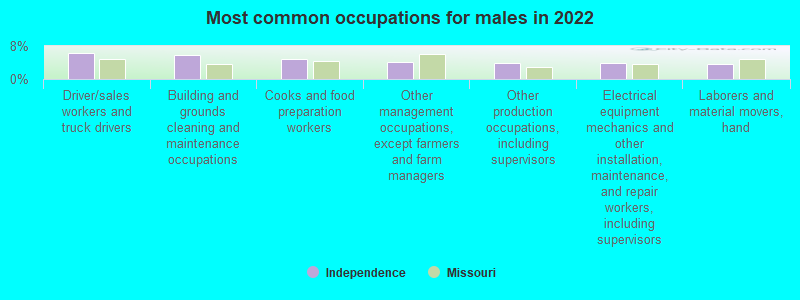
- Driver/sales workers and truck drivers (6.3%)
- Building and grounds cleaning and maintenance occupations (5.9%)
- Cooks and food preparation workers (4.8%)
- Other management occupations, except farmers and farm managers (4.0%)
- Other production occupations, including supervisors (3.9%)
- Electrical equipment mechanics and other installation, maintenance, and repair workers, including supervisors (3.8%)
- Laborers and material movers, hand (3.7%)
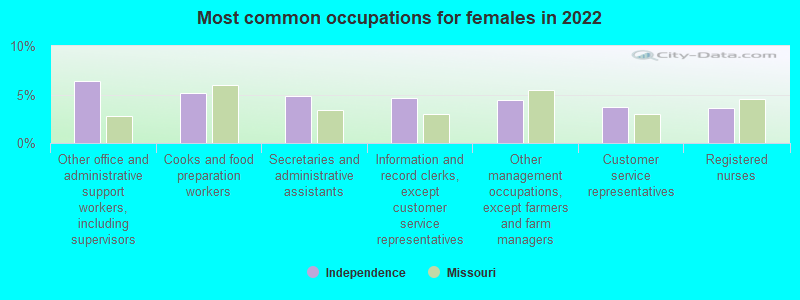
- Other office and administrative support workers, including supervisors (6.4%)
- Cooks and food preparation workers (5.2%)
- Secretaries and administrative assistants (4.9%)
- Information and record clerks, except customer service representatives (4.6%)
- Other management occupations, except farmers and farm managers (4.4%)
- Customer service representatives (3.7%)
- Registered nurses (3.6%)
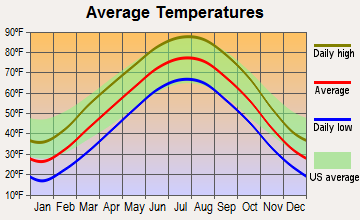
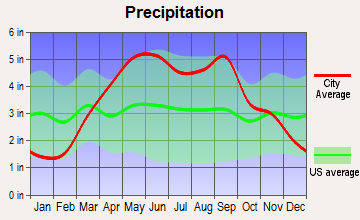
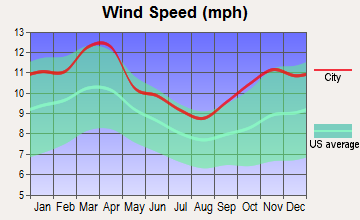
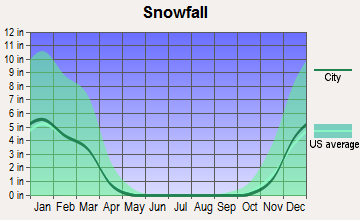
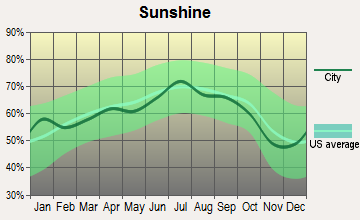
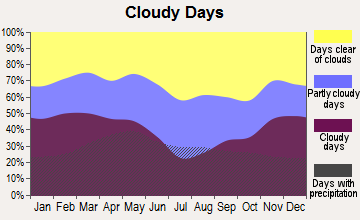
Average climate in Independence, Missouri
Based on data reported by over 4,000 weather stations
|
|


(lower is better)
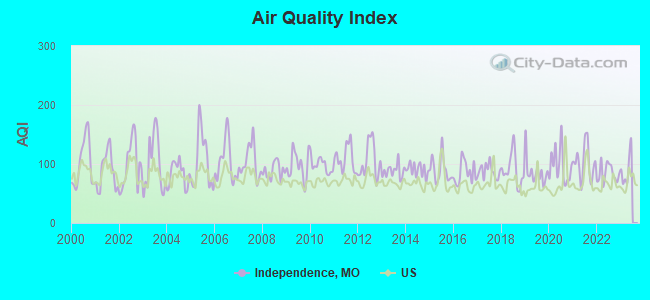
Air Quality Index (AQI) level in 2022 was 84.1. This is about average.
| City: | 84.1 |
| U.S.: | 72.6 |
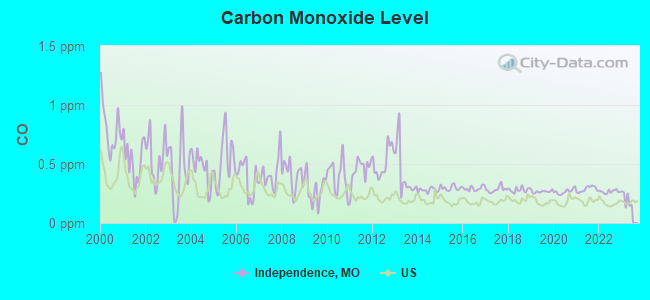
Carbon Monoxide (CO) [ppm] level in 2022 was 0.266. This is about average. Closest monitor was 2.1 miles away from the city center.
| City: | 0.266 |
| U.S.: | 0.251 |
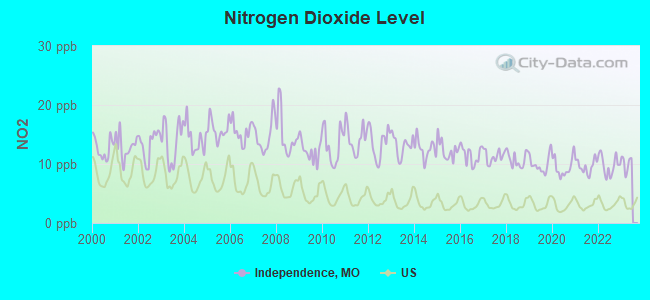
Nitrogen Dioxide (NO2) [ppb] level in 2022 was 9.80. This is significantly worse than average. Closest monitor was 0.9 miles away from the city center.
| City: | 9.80 |
| U.S.: | 5.11 |
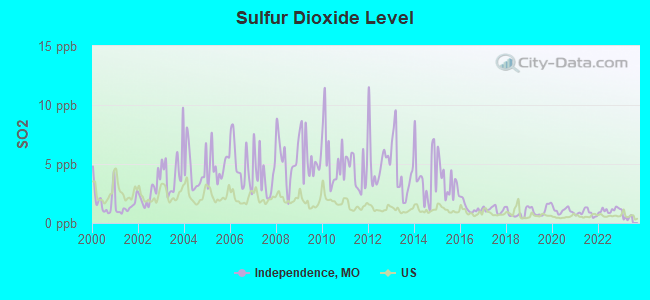
Sulfur Dioxide (SO2) [ppb] level in 2022 was 1.09. This is better than average. Closest monitor was 0.9 miles away from the city center.
| City: | 1.09 |
| U.S.: | 1.51 |

Ozone [ppb] level in 2022 was 30.2. This is about average. Closest monitor was 8.7 miles away from the city center.
| City: | 30.2 |
| U.S.: | 33.3 |
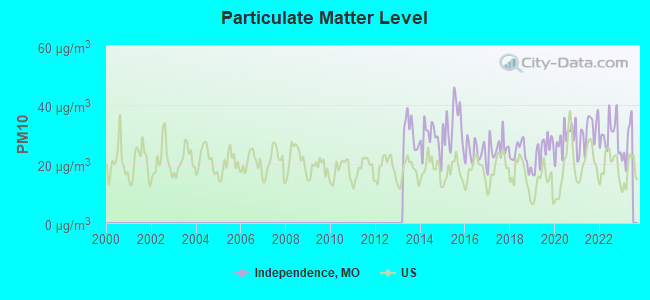
Particulate Matter (PM10) [µg/m3] level in 2022 was 29.9. This is significantly worse than average. Closest monitor was 4.9 miles away from the city center.
| City: | 29.9 |
| U.S.: | 19.2 |
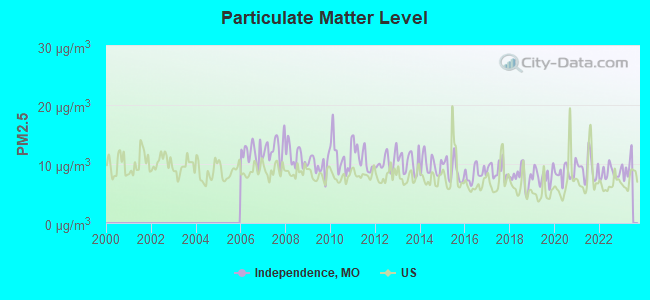
Particulate Matter (PM2.5) [µg/m3] level in 2022 was 8.42. This is about average. Closest monitor was 2.7 miles away from the city center.
| City: | 8.42 |
| U.S.: | 8.11 |
Tornado activity:
Independence-area historical tornado activity is slightly above Missouri state average. It is 95% greater than the overall U.S. average.
On 5/20/1957, a category F5 (max. wind speeds 261-318 mph) tornado 6.9 miles away from the Independence city center killed 44 people and injured 207 people and caused between $500,000 and $5,000,000 in damages.
On 5/4/2003, a category F4 (max. wind speeds 207-260 mph) tornado 10.9 miles away from the city center injured 13 people and caused $31 million in damages.
Earthquake activity:
Independence-area historical earthquake activity is significantly above Missouri state average. It is 490% greater than the overall U.S. average.On 9/3/2016 at 12:02:44, a magnitude 5.8 (5.8 MW, Depth: 3.5 mi, Class: Moderate, Intensity: VI - VII) earthquake occurred 229.6 miles away from the city center
On 11/6/2011 at 03:53:10, a magnitude 5.7 (5.7 MW, Depth: 3.2 mi) earthquake occurred 277.6 miles away from the city center
On 11/12/2014 at 21:40:00, a magnitude 4.9 (4.9 MW, Depth: 2.5 mi, Class: Light, Intensity: IV - V) earthquake occurred 214.9 miles away from Independence center
On 11/7/2016 at 01:44:24, a magnitude 5.0 (5.0 MW, Depth: 2.8 mi) earthquake occurred 250.8 miles away from the city center
On 2/13/2016 at 17:07:06, a magnitude 5.1 (5.1 MW, Depth: 5.2 mi) earthquake occurred 295.6 miles away from Independence center
On 4/18/2008 at 09:36:59, a magnitude 5.4 (5.1 MB, 4.8 MS, 5.4 MW, 5.2 MW) earthquake occurred 354.2 miles away from the city center
Magnitude types: body-wave magnitude (MB), surface-wave magnitude (MS), moment magnitude (MW)
Natural disasters:
The number of natural disasters in Jackson County (24) is greater than the US average (15).Major Disasters (Presidential) Declared: 17
Emergencies Declared: 5
Causes of natural disasters: Floods: 18, Storms: 15, Tornadoes: 8, Winter Storms: 2, Drought: 1, Heavy Rain: 1, Hurricane: 1, Ice Storm: 1, Wind: 1, Other: 1 (Note: some incidents may be assigned to more than one category).
Hospitals in Independence:
- CENTERPOINT MEDICAL CENTER (Voluntary non-profit - Private, provides emergency services, 19600 EAST 39TH STREET)
- GROVES COMMUNITY HOSPICE (1515 WEST WHITE OAK)
- HOSPICE OF INDEPENDENCE REGIONAL (1515 W TRUMAN RD)
- MEDICAL CENTER OF INDEPENDENCE (provides emergency services, 17203 E 23RD ST)
- VITAS HEALTHCARE CORPORATION MIDWEST (4041 SOUTH LYNN COURT DRIVE)
Nursing Homes in Independence:
- CARMEL HILLS HEALTHCARE AND REHABILITATION CENTER (810 EAST WALNUT)
- GOLDEN LIVINGCENTER-INDEPENDENCE (17451 EAST MEDICAL CENTER PARKWAY)
- INDEPENDENCE MANOR CARE CENTER (1600 SOUTH KINGSHIGHWAY)
- INDEPENDENCE REGIONAL HEALTH CENTER (1509 WEST TRUMAN ROAD)
- MAYWOOD TERRACE LIVING CENTER (10300 EAST TRUMAN RD)
- MONTEREY PARK NURSING CENTER (4600 LITTLE BLUE PARKWAY)
- REHABILITATION CENTER OF INDEPENDENCE, THE (1800 S SWOPE DRIVE)
- ROSEWOOD HEALTH AND REHAB CENTER (1415 WEST WHITE OAK)
- VILLAGES OF JACKSON CREEK, THE (3980 SOUTH JACKSON DRIVE)
Dialysis Facilities in Independence:
- EASTLAND DIALYSIS (19101 E VALLEY VIEW PKWY STE E)
- FMC - CENTERPOINT (19401 E 37TH TERRACE COURT SOUTH SUITE 200)
- INDEPENDENCE DIALYSIS CENTER (1135 S. CLAREMONT)
Home Health Centers in Independence:
Heliports located in Independence:
Colleges/Universities in Independence:
- National American University-Independence (Full-time enrollment: 501; Location: 3620 South Arrowhead Avenue; Private, for-profit; Website: www.national.edu/locations/missouri/independence)
- Independence College of Cosmetology (Full-time enrollment: 117; Location: 815 W 23rd St; Private, for-profit; Website: www.hair-skin-nails.com)
Colleges/universities with over 2000 students nearest to Independence:
- Rockhurst University (about 10 miles; Kansas City, MO; Full-time enrollment: 2,013)
- University of Missouri-Kansas City (about 10 miles; Kansas City, MO; FT enrollment: 10,544)
- Metropolitan Community College-Kansas City (about 10 miles; Kansas City, MO; FT enrollment: 12,834)
- Park University (about 17 miles; Parkville, MO; FT enrollment: 9,131)
- Wright Career College (about 18 miles; Overland Park, KS; FT enrollment: 3,107)
- Grantham University (about 19 miles; Kansas City, MO; FT enrollment: 8,385)
- Kansas City Kansas Community College (about 19 miles; Kansas City, KS; FT enrollment: 4,718)
Public high schools in Independence:
- WILLIAM CHRISMAN HIGH (Students: 1,733, Location: 1223 N NOLAND RD, Grades: 9-12)
- TRUMAN HIGH (Students: 1,692, Location: 3301 S NOLAND RD, Grades: 9-12)
- FORT OSAGE HIGH (Students: 1,539, Location: 2101 N TWYMAN RD, Grades: 9-12)
- INDEPENDENCE ACADEMY (Students: 78, Location: 600 W MECHANIC AVE, Grades: 9-12)
- MCCUNE SCHOOL FOR BOYS (Students: 58, Location: 24001 E US HWY 24, Grades: 7-12)
- CAR. TECH. CTR. AT FT. OSAGE (Location: 2101 N TWYMAN RD, Grades: 11-12)
- LEWIS AND CLARK LEARNING CTR. (Location: 2101 N TWYMAN RD, Grades: KG-12)
- DAY TREATMENT (Location: 600 W MECHANIC AVE, Grades: KG-12)
Private high schools in Independence:
- CENTER PLACE RESTORATION SCHOOL (Students: 215, Location: 819 W WALDO AVE, Grades: KG-12)
- ST MARYS HIGH SCHOOL BUNDSCHU MEMORIAL (Students: 115, Location: 622 N MAIN ST, Grades: 9-12)
- NOVA CENTER (Students: 52, Location: 2425 S HARDY AVE, Grades: KG-12)
- SHELTERWOOD SCHOOL (Students: 42, Location: 3205 N TWYMAN RD, Grades: 8-12)
Biggest public elementary/middle schools in Independence:
- BRIDGER MIDDLE (Students: 903, Location: 18200 E M-78 HWY, Grades: 6)
- PIONEER RIDGE MIDDLE (Students: 825, Location: 1656 S SPECK RD, Grades: 7-8)
- OSAGE TRAIL MIDDLE (Students: 732, Location: 2101 N TWYMAN RD, Grades: 7-8)
- FIRE PRAIRIE MIDDLE (Students: 701, Location: 24801 E 24 HWY, Grades: 5-6)
- BINGHAM MIDDLE (Students: 661, Location: 1716 S SPECK RD, Grades: 7-8)
- CLIFFORD H. NOWLIN MIDDLE (Students: 649, Location: 2800 S HARDY AVE, Grades: 6-8)
- BLACKBURN ELEM. (Students: 604, Location: 17302 E R D MIZE RD, Grades: PK-5)
- WILLIAM SOUTHERN ELEM. (Students: 518, Location: 4300 S PHELPS RD, Grades: PK-5)
- SYCAMORE HILLS ELEM. (Students: 516, Location: 15208 E 39TH ST S, Grades: PK-5)
- BLUE HILLS ELEM. (Students: 494, Location: 1911 N BLUE MILLS RD, Grades: KG-4)
Private elementary/middle schools in Independence:
Library in Independence:
- CONSOLIDATED LIBRARY DISTRICT #3 (Operating income: $41,865,938; Location: 15616 E. US HIGHWAY 24; 2,972,090 books; 695 e-books; 199,301 audio materials; 136,986 video materials; 200 local licensed databases; 14 state licensed databases; 39 other licensed databases; 7,285 print serial subscriptions; 11 electronic serial subscriptions)
User-submitted facts and corrections:
- Independence, Missouri is the site founded by Joseph Smith in a revelation as the New Jerusalem, or Zion.
Points of interest:
Notable locations in Independence: Camp Mo-Kan (A), Rockwood Country Club (B), Crackerneck Country Club (C), Fairmount Station (D), Lake City Junction (E), Independence Center (F), Harry S Truman Railroad Station (G), Gaslight Square (H), Noland Plaza (I), Noland Road Retail Center (J), Noland Fashion Square (K), Alton Plaza (L), Chrisman Plaza (M), Independence Square (N), Thirty-ninth and Noland Center (O), Harry S Truman Home (P), Bingham-Waggoner Estate (Q), 1827 Jackson County Log Courthouse (R), Independence Fire Department Headquarters (S), Vaile Mansion (T). Display/hide their locations on the map
Shopping Centers: Far View Shopping Center (1), Hub Shopping Center (2), Independence Corners Shopping Center (3), Independence North Shopping Center (4), Noland South Shopping Center (5), Sterling Ridge Shopping Center (6), Hi-way Twenty-four Shopping Center (7). Display/hide their locations on the map
Churches in Independence include: Fairmount Church (A), Blue Ridge Assembly of God Church (B), First Presbyterian Church (C), Trinity Episcopal Church (D), Lobb Cumberland Church (E), Trinity Church (F), Assembly of God Church (G), Beacon Heights Church (H), Bethel Church (I). Display/hide their locations on the map
Cemeteries: Lobb Cemetery (1), Mount Washington Cemetery (2), Oak Ridge Memory Gardens (3), Hendrick Cemetery (4), Pitcher Cemetery (5), Blue Ridge Cemetery (6), Hill Cemetery (7). Display/hide their locations on the map
Lake: Horseshoe Lake (A). Display/hide its location on the map
Streams, rivers, and creeks: East Fork Little Blue River (A), Burr Oak Creek (B), Camp Creek (C), Spring Branch (D), West Fire Prairie Creek (E), Rock Creek (F). Display/hide their locations on the map
Parks in Independence include: Kiddie Park (1), Hill Park (2), Slover Memorial Park (3), Chrysler Stadium (4), National Frontier Trails Center (5), Chaplin-Hood Park (6), Bundschu Park (7), Harry S Truman National Historic Site (8), Adair Park (9). Display/hide their locations on the map
Tourist attractions: Independence College of Cosmetology (Museums; 815 West 23rd Street) (1), Jackson County Historical Society - Jail Museum 1859 (217 North Main Street) (2), Truman Harry S National Historic Site (Recreation Areas; 223 North Main Street) (3), Amf Independence Lanes (Amusement & Theme Parks; 3701 South Ponca Drive) (4), Amf Bowling Centers - Amf Strike 'n Spare (Amusement & Theme Parks; 13001 East US Highway 40) (5), Independence Carousel (Amusement & Theme Parks; 146 Independence Center) (6), Power Play (2035 Independence Center) (7), All Points Travel Inc (Tours & Charters; 18675 East 39th Street South Suite O) (8). Display/hide their approximate locations on the map
Hotels: Blue Bird Motel (8920 US40 Highway) (1), Great Western Motel (15912 East US Highway 24) (2), American Inn (4141 South Noland Road) (3), Hilton Garden Inn Hotel (19677 East Jackson Drive) (4), Crossland Economy Studios (14800 East 42nd Street South) (5), Budget Inn Motel (9900 E US Highway 40) (6), Holiday Inn Express Hotel & Suites (19901 East Valleyview Parkway) (7), Fairfield Inn by Marriott (18700 East 37th Terrace South) (8), Hilton Garden Inn Independence (19677 East Jackson Drive) (9). Display/hide their approximate locations on the map
Courts: Independence City - City Hall- Helpful Jackson County Numbers- General Informa (308 West Kansas Avenue) (1), Jackson County - Executive Branch- Sheriff's Department Lake Jacomo Hdqtrs- Warrents- Court Secu (3310 Northeast Rennau Drive) (2), Jackson County - Judicial Branch- Family Court Division- Family Court Resource Serv (626 East 26 Street 64108) (3), Jackson County - Judicial Branch- Family Court Division- Family Court Resource Services- Media (626 East 26 Street 64108) (4). Display/hide their approximate locations on the map
Birthplace of: Larry C. Johnson - Blogger, Ginger Rogers - (1911-1995), actor, Margaret Truman - (born 1924), novelist, Margaret Weis - Writer, Arliss Howard - Film actor, Andrew Probert - Illustrator, Bess Truman - (1885-1982), First Lady of the United States, wife of Harry S. Truman, Cathay Williams - Slave, Mateo Moreno - Film actor, Paul Henning - Television producer.
| This city: | 2.4 people |
| Missouri: | 2.5 people |
| This city: | 61.9% |
| Whole state: | 65.3% |
| This city: | 8.0% |
| Whole state: | 6.7% |
Likely homosexual households (counted as self-reported same-sex unmarried-partner households)
- Lesbian couples: 0.4% of all households
- Gay men: 0.3% of all households
People in group quarters in Independence in 2010:
- 982 people in nursing facilities/skilled-nursing facilities
- 59 people in emergency and transitional shelters (with sleeping facilities) for people experiencing homelessness
- 46 people in other noninstitutional facilities
- 39 people in correctional facilities intended for juveniles
- 38 people in group homes intended for adults
- 29 people in workers' group living quarters and job corps centers
- 27 people in group homes for juveniles (non-correctional)
- 5 people in residential treatment centers for adults
People in group quarters in Independence in 2000:
- 395 people in other noninstitutional group quarters
- 383 people in nursing homes
- 123 people in hospitals/wards and hospices for chronically ill
- 119 people in hospices or homes for chronically ill
- 73 people in homes for the mentally retarded
- 70 people in training schools for juvenile delinquents
- 27 people in religious group quarters
- 25 people in homes or halfway houses for drug/alcohol abuse
- 14 people in homes for the physically handicapped
- 11 people in homes for abused, dependent, and neglected children
- 8 people in other group homes
- 8 people in other nonhousehold living situations
- 4 people in other hospitals or wards for chronically ill
- 3 people in schools, hospitals, or wards for the intellectually disabled
Banks with most branches in Independence (2011 data):
- Bank of America, National Association: Independence Square Branch, 24 Highway Branch, Noland Road Branch, Eastland Banking Ctr. Branch, 23rd Street Banking Center Branch. Info updated 2009/11/18: Bank assets: $1,451,969.3 mil, Deposits: $1,077,176.8 mil, headquarters in Charlotte, NC, positive income, 5782 total offices, Holding Company: Bank Of America Corporation
- Commerce Bank: Independence Square Branch, Independence Noland Road Branch, 24 Highway Branch, 39th Street Branch. Info updated 2011/07/07: Bank assets: $20,493.6 mil, Deposits: $16,805.3 mil, headquarters in Kansas City, MO, positive income, 206 total offices, Holding Company: Commerce Bancshares, Inc.
- U.S. Bank National Association: 24 Highway Branch, Noland Road Branch, Independence Center Branch. Info updated 2012/01/30: Bank assets: $330,470.8 mil, Deposits: $236,091.5 mil, headquarters in Cincinnati, OH, positive income, 3121 total offices, Holding Company: U.S. Bancorp
- UMB Bank, National Association: 40 Highway At 291 Drive Up Branch, East 39th Street Branch, Gudgell Branch. Info updated 2007/12/13: Bank assets: $11,205.9 mil, Deposits: $8,538.8 mil, headquarters in Kansas City, MO, positive income, 107 total offices, Holding Company: Umb Financial Corporation
- Bank Midwest, National Association: Independence 23rd Street Branch, Fountains At Greenbrier, Independence Branch # 8. Info updated 2012/03/19: Bank assets: $6,237.6 mil, Deposits: $5,064.6 mil, headquarters in Kansas City, MO, positive income, 138 total offices, Holding Company: Nbh Holdings Corp.
- Hawthorn Bank: Independence Branch at 220 West White Oak, branch established on 1919/01/01; Independence Branch at 17430 East 39th Street, branch established on 2002/01/07. Info updated 2011/03/16: Bank assets: $1,152.2 mil, Deposits: $971.8 mil, headquarters in Jefferson City, MO, positive income, Commercial Lending Specialization, 24 total offices, Holding Company: Hawthorn Bancshares, Inc
- Blue Ridge Bank and Trust Co.: Blue Ridge Bank And Trust Co. at 4200 Little Blue Parkway, branch established on 1958/09/08; Independence Branch at 17911 East 24 Highway, Unit B-1, branch established on 1998/12/01. Info updated 2011/06/13: Bank assets: $469.9 mil, Deposits: $424.5 mil, local headquarters, negative income in the last year, Commercial Lending Specialization, 11 total offices, Holding Company: Blue Ridge Bancshares, Inc.
- Union Bank: Independence Branch at 4340 Noland Road, branch established on 1998/02/06. Info updated 2010/08/12: Bank assets: $458.7 mil, Deposits: $414.7 mil, headquarters in Kansas City, MO, negative income in the last year, Commercial Lending Specialization, 11 total offices, Holding Company: First Olathe Bancshares, Inc.
- North American Savings Bank, F.S.B.: 11400 East 23rd Branch at 11400 E 23rd Street, branch established on 1921/01/01. Info updated 2011/07/21: Bank assets: $1,184.7 mil, Deposits: $889.0 mil, headquarters in Grandview, MO, negative income in the last year, Commercial Lending Specialization, 9 total offices
- 6 other banks with 6 local branches
For population 15 years and over in Independence:
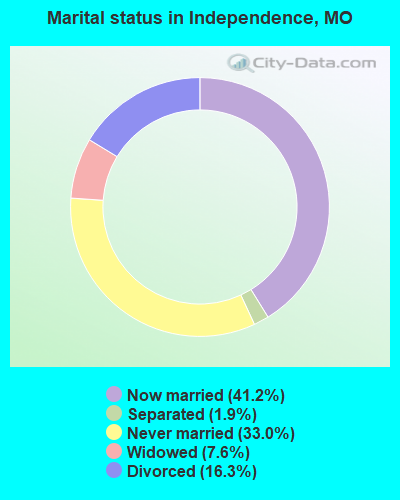
- Never married: 33.0%
- Now married: 41.2%
- Separated: 1.9%
- Widowed: 7.6%
- Divorced: 16.3%
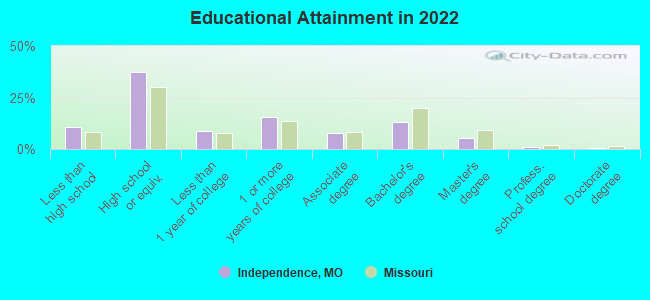
For population 25 years and over in Independence:
- High school or higher: 89.2%
- Bachelor's degree or higher: 19.8%
- Graduate or professional degree: 6.6%
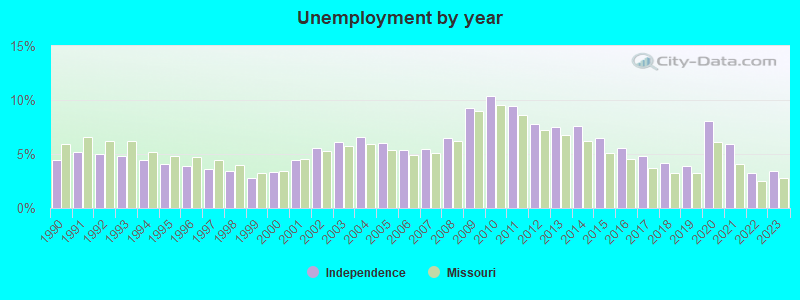
- Unemployed: 5.0%
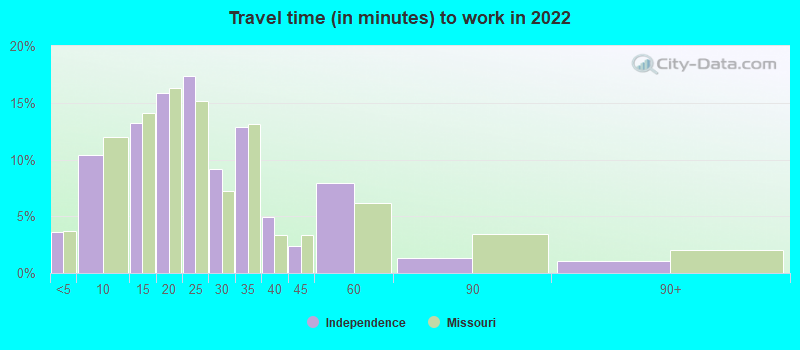
- Mean travel time to work (commute): 22.5 minutes
| Here: | 10.3 |
| Missouri average: | 11.1 |
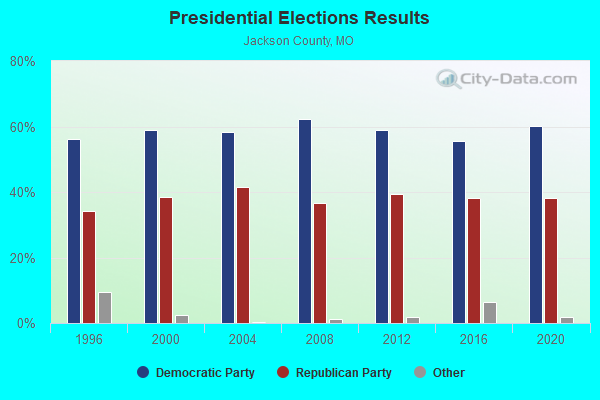
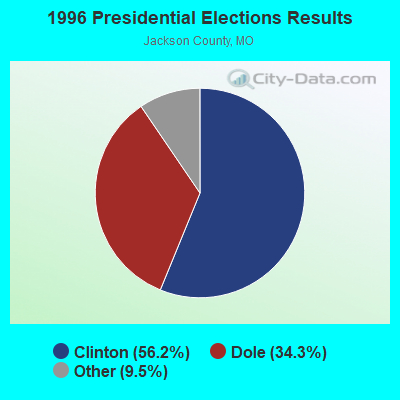
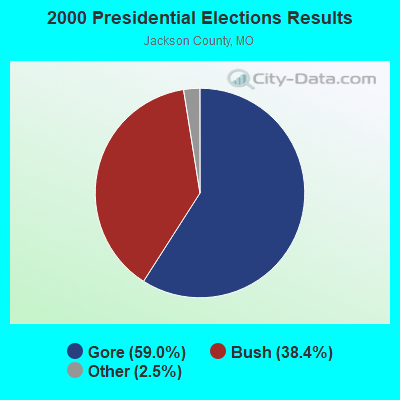
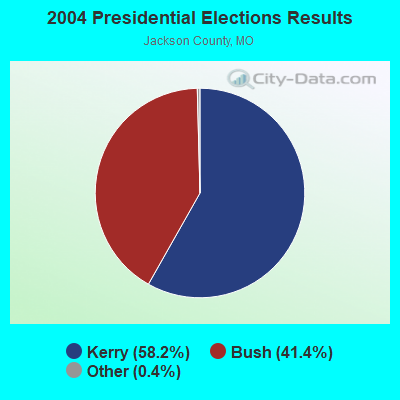
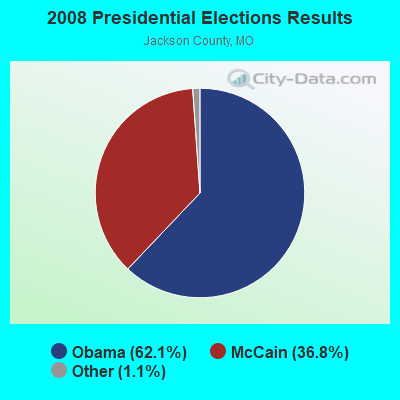
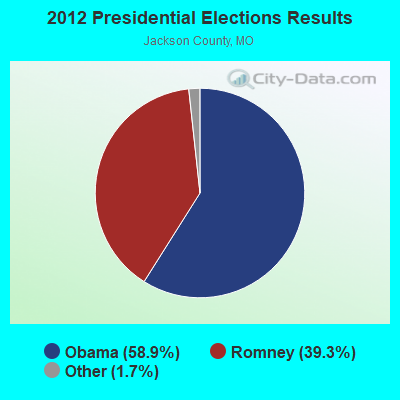
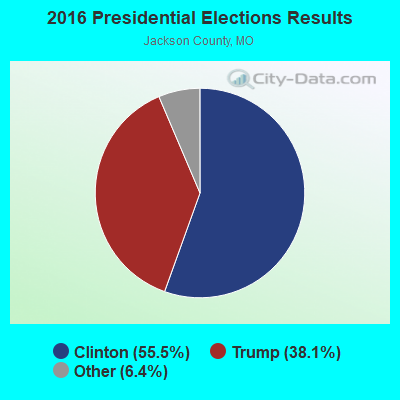
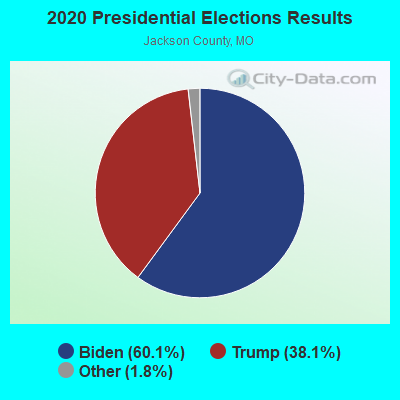
Graphs represent county-level data. Detailed 2008 Election Results
Religion statistics for Independence, MO (based on Jackson County data)
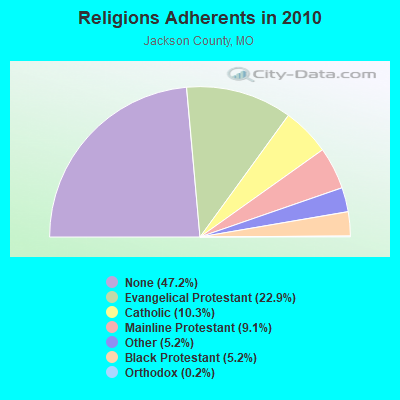
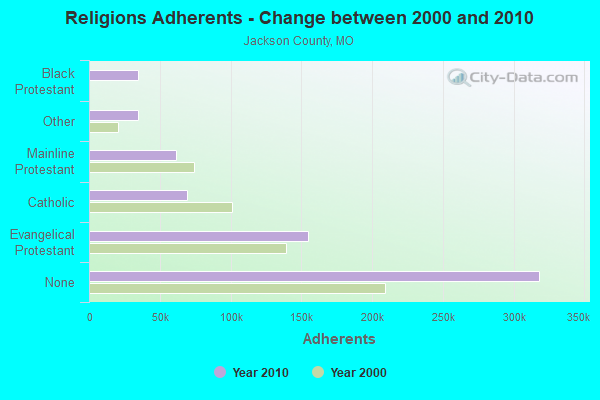
| Religion | Adherents | Congregations |
|---|---|---|
| Evangelical Protestant | 154,390 | 404 |
| Catholic | 69,441 | 52 |
| Mainline Protestant | 61,299 | 159 |
| Other | 34,880 | 110 |
| Black Protestant | 34,722 | 84 |
| Orthodox | 1,235 | 3 |
| None | 318,191 | - |
Food Environment Statistics:
| Here: | 1.64 / 10,000 pop. |
| Missouri: | 1.88 / 10,000 pop. |
| This county: | 0.15 / 10,000 pop. |
| Missouri: | 0.18 / 10,000 pop. |
| Jackson County: | 0.60 / 10,000 pop. |
| Missouri: | 0.60 / 10,000 pop. |
| Jackson County: | 2.78 / 10,000 pop. |
| Missouri: | 4.34 / 10,000 pop. |
| This county: | 6.91 / 10,000 pop. |
| Missouri: | 7.37 / 10,000 pop. |
| Jackson County: | 9.1% |
| Missouri: | 8.8% |
| This county: | 30.8% |
| State: | 29.6% |
| Jackson County: | 14.0% |
| Missouri: | 13.5% |
Health and Nutrition:
| Independence: | 51.6% |
| Missouri: | 50.9% |
| Here: | 49.5% |
| Missouri: | 48.6% |
| This city: | 28.5 |
| State: | 28.7 |
| Independence: | 21.1% |
| Missouri: | 20.6% |
| Here: | 10.1% |
| Missouri: | 10.1% |
| Independence: | 6.9 |
| Missouri: | 6.8 |
| Here: | 34.3% |
| Missouri: | 34.3% |
| Independence: | 58.1% |
| State: | 57.5% |
| This city: | 78.7% |
| State: | 79.3% |
More about Health and Nutrition of Independence, MO Residents
| Local government employment and payroll (March 2022) | |||||
| Function | Full-time employees | Monthly full-time payroll | Average yearly full-time wage | Part-time employees | Monthly part-time payroll |
|---|---|---|---|---|---|
| Police Protection - Officers | 197 | $1,226,519 | $74,712 | 0 | $0 |
| Firefighters | 163 | $1,041,458 | $76,672 | 0 | $0 |
| Electric Power | 125 | $1,098,060 | $105,414 | 0 | $0 |
| Other and Unallocable | 75 | $438,730 | $70,197 | 7 | $14,132 |
| Sewerage | 54 | $272,242 | $60,498 | 0 | $0 |
| Water Supply | 49 | $293,032 | $71,763 | 0 | $0 |
| Parks and Recreation | 43 | $172,393 | $48,110 | 38 | $11,403 |
| Police - Other | 34 | $156,740 | $55,320 | 2 | $4,371 |
| Streets and Highways | 31 | $139,582 | $54,032 | 1 | $2,825 |
| Financial Administration | 25 | $148,271 | $71,170 | 0 | $0 |
| Correction | 14 | $61,307 | $52,549 | 0 | $0 |
| Judicial and Legal | 14 | $96,091 | $82,364 | 2 | $8,368 |
| Other Government Administration | 11 | $81,326 | $88,719 | 0 | $0 |
| Fire - Other | 9 | $77,529 | $103,372 | 1 | $554 |
| Housing and Community Development (Local) | 9 | $45,535 | $60,713 | 1 | $924 |
| Health | 6 | $31,310 | $62,620 | 0 | $0 |
| Totals for Government | 859 | $5,380,125 | $75,159 | 52 | $42,577 |
Independence government finances - Expenditure in 2021 (per resident):
- Construction - Sewerage: $12,811,000 ($105.70)
Electric Utilities: $11,436,000 ($94.35)
General - Other: $11,367,000 ($93.79)
Water Utilities: $3,261,000 ($26.91)
Regular Highways: $2,127,000 ($17.55)
- Current Operations - Electric Utilities: $113,902,000 ($939.77)
Police Protection: $39,810,000 ($328.46)
Local Fire Protection: $21,150,000 ($174.50)
Sewerage: $19,532,000 ($161.15)
Water Utilities: $17,962,000 ($148.20)
Central Staff Services: $13,653,000 ($112.65)
Parks and Recreation: $13,441,000 ($110.90)
Regular Highways: $7,152,000 ($59.01)
General - Other: $5,963,000 ($49.20)
Housing and Community Development: $5,598,000 ($46.19)
Health - Other: $3,312,000 ($27.33)
Financial Administration: $2,390,000 ($19.72)
Judicial and Legal Services: $1,987,000 ($16.39)
Protective Inspection and Regulation - Other: $659,000 ($5.44)
Miscellaneous Commercial Activities - Other: $125,000 ($1.03)
- Electric Utilities - Interest on Debt: $5,391,000 ($44.48)
- General - Interest on Debt: $14,215,000 ($117.28)
- Other Capital Outlay - General - Other: $750,000 ($6.19)
Parks and Recreation: $244,000 ($2.01)
- Total Salaries and Wages: $80,227,000 ($661.93)
- Water Utilities - Interest on Debt: $1,379,000 ($11.38)
Independence government finances - Revenue in 2021 (per resident):
- Charges - Sewerage: $28,241,000 ($233.01)
Parks and Recreation: $12,709,000 ($104.86)
Other: $3,466,000 ($28.60)
Miscellaneous Commercial Activities: $75,000 ($0.62)
Regular Highways: $13,000 ($0.11)
- Federal Intergovernmental - Housing and Community Development: $798,000 ($6.58)
- Miscellaneous - Fines and Forfeits: $4,522,000 ($37.31)
General Revenue - Other: $2,094,000 ($17.28)
Interest Earnings: $277,000 ($2.29)
Special Assessments: $35,000 ($0.29)
- Revenue - Electric Utilities: $148,111,000 ($1222.02)
Water Utilities: $31,534,000 ($260.18)
- State Intergovernmental - General Local Government Support: $5,503,000 ($45.40)
Other: $2,323,000 ($19.17)
Highways: $1,770,000 ($14.60)
Public Welfare: $264,000 ($2.18)
- Tax - General Sales and Gross Receipts: $62,700,000 ($517.32)
Public Utilities Sales: $12,478,000 ($102.95)
Property: $10,706,000 ($88.33)
Other License: $1,957,000 ($16.15)
Occupation and Business License - Other: $1,901,000 ($15.68)
Other Selective Sales: $1,704,000 ($14.06)
Motor Vehicle License: $615,000 ($5.07)
Tobacco Products Sales: $546,000 ($4.50)
Alcoholic Beverage License: $142,000 ($1.17)
Independence government finances - Debt in 2021 (per resident):
- Long Term Debt - Beginning Outstanding - Unspecified Public Purpose: $394,910,000 ($3258.28)
Outstanding Unspecified Public Purpose: $371,615,000 ($3066.08)
Retired Unspecified Public Purpose: $23,295,000 ($192.20)
Independence government finances - Cash and Securities in 2021 (per resident):
- Bond Funds - Cash and Securities: $214,000 ($1.77)
- Other Funds - Cash and Securities: $239,102,000 ($1972.76)
- Sinking Funds - Cash and Securities: $130,000 ($1.07)
7.09% of this county's 2021 resident taxpayers lived in other counties in 2020 ($55,298 average adjusted gross income)
| Here: | 7.09% |
| Missouri average: | 7.67% |
0.01% of residents moved from foreign countries ($84 average AGI)
Jackson County: 0.01% Missouri average: 0.02%
Top counties from which taxpayers relocated into this county between 2020 and 2021:
| from Johnson County, KS | |
| from Clay County, MO | |
| from Cass County, MO |
7.47% of this county's 2020 resident taxpayers moved to other counties in 2021 ($66,055 average adjusted gross income)
| Here: | 7.47% |
| Missouri average: | 7.51% |
0.01% of residents moved to foreign countries ($37 average AGI)
Jackson County: 0.01% Missouri average: 0.01%
Top counties to which taxpayers relocated from this county between 2020 and 2021:
| to Johnson County, KS | |
| to Clay County, MO | |
| to Cass County, MO |
| Businesses in Independence, MO | ||||
| Name | Count | Name | Count | |
|---|---|---|---|---|
| 24 Hour Fitness | 1 | Jimmy John's | 1 | |
| 7-Eleven | 5 | Jones New York | 2 | |
| ALDI | 1 | Journeys | 1 | |
| ALDO | 1 | Justice | 1 | |
| AMF Bowling | 2 | KFC | 3 | |
| AT&T | 1 | Kmart | 2 | |
| Abercrombie & Fitch | 1 | Kohl's | 1 | |
| Ace Hardware | 2 | La-Z-Boy | 1 | |
| Advance Auto Parts | 3 | Lane Bryant | 1 | |
| Aeropostale | 1 | LensCrafters | 1 | |
| American Eagle Outfitters | 2 | Little Caesars Pizza | 1 | |
| Applebee's | 1 | Long John Silver's | 1 | |
| Arby's | 4 | Lowe's | 1 | |
| AutoZone | 3 | Macy's | 1 | |
| Bakers | 1 | Marriott | 2 | |
| Barnes & Noble | 1 | Marshalls | 1 | |
| Baskin-Robbins | 1 | MasterBrand Cabinets | 5 | |
| Bath & Body Works | 1 | McDonald's | 9 | |
| Bed Bath & Beyond | 1 | Men's Wearhouse | 2 | |
| Best Western | 1 | Motel 6 | 1 | |
| Blockbuster | 4 | Motherhood Maternity | 3 | |
| Budget Car Rental | 1 | New Balance | 2 | |
| Burger King | 4 | New York & Co | 1 | |
| CVS | 4 | Nike | 17 | |
| CarMax | 1 | Office Depot | 1 | |
| Casual Male XL | 1 | OfficeMax | 1 | |
| Catherines | 1 | Old Navy | 1 | |
| Charlotte Russe | 1 | Olive Garden | 1 | |
| Chevrolet | 1 | On The Border | 1 | |
| Chick-Fil-A | 1 | Outback | 1 | |
| Chico's | 1 | Outback Steakhouse | 1 | |
| Chipotle | 1 | Pac Sun | 1 | |
| Chuck E. Cheese's | 1 | Panda Express | 1 | |
| Church's Chicken | 3 | Panera Bread | 1 | |
| Cold Stone Creamery | 1 | Papa John's Pizza | 3 | |
| Coldwater Creek | 1 | Payless | 4 | |
| Comfort Suites | 1 | Penske | 1 | |
| Costco | 1 | PetSmart | 1 | |
| Cracker Barrel | 1 | Pizza Hut | 4 | |
| Cricket Wireless | 9 | Popeyes | 1 | |
| Crossland Economy Studios | 1 | Quality | 1 | |
| Dairy Queen | 2 | Quiznos | 2 | |
| Deb | 1 | RadioShack | 2 | |
| Decora Cabinetry | 1 | Red Lobster | 1 | |
| Dennys | 2 | Red Robin | 1 | |
| Domino's Pizza | 2 | Rue21 | 1 | |
| DressBarn | 1 | Ryan's Grill | 1 | |
| Dressbarn | 1 | SONIC Drive-In | 6 | |
| Express | 1 | Sam's Club | 1 | |
| Famous Footwear | 1 | Sears | 4 | |
| Fashion Bug | 1 | Sephora | 1 | |
| FedEx | 13 | Shoe Carnival | 1 | |
| Finish Line | 1 | Spencer Gifts | 1 | |
| Firestone Complete Auto Care | 2 | Sprint Nextel | 4 | |
| Foot Locker | 1 | Starbucks | 4 | |
| Ford | 1 | Steak 'n Shake | 1 | |
| Forever 21 | 1 | Subway | 10 | |
| GNC | 1 | Super 8 | 1 | |
| GameStop | 4 | T-Mobile | 6 | |
| Goodwill | 1 | Taco Bell | 7 | |
| Gymboree | 1 | Target | 1 | |
| H&R Block | 7 | Torrid | 1 | |
| Hardee's | 3 | Toys"R"Us | 1 | |
| Hilton | 1 | True Value | 1 | |
| Hobby Lobby | 1 | U-Haul | 8 | |
| Holiday Inn | 2 | UPS | 18 | |
| Hollister Co. | 1 | Vans | 4 | |
| Home Depot | 1 | Victoria's Secret | 1 | |
| HomeTown Buffet | 1 | Walgreens | 4 | |
| Hot Topic | 1 | Walmart | 1 | |
| IHOP | 1 | Wendy's | 5 | |
| J. Jill | 1 | Wet Seal | 1 | |
| JCPenney | 1 | YMCA | 1 | |
Strongest AM radio stations in Independence:
- KCTE (1510 AM; daytime; 10 kW; INDEPENDENCE, MO; Owner: UNION BROADCASTING, INC.)
- KKHK (1250 AM; 25 kW; KANSAS CITY, KS)
- KCCV (760 AM; daytime; 6 kW; OVERLAND PARK, KS; Owner: BOTT BROADCASTING COMPANY)
- WHB (810 AM; 50 kW; KANSAS CITY, MO; Owner: UNION BROADCASTING, INC.)
- KPHN (1190 AM; 5 kW; KANSAS CITY, MO; Owner: ABC, INC.)
- KXTR (1660 AM; 10 kW; KANSAS CITY, KS; Owner: ENTERCOM KANSAS CITY LICENSE, LLC)
- KCMO (710 AM; 10 kW; KANSAS CITY, MO; Owner: SUSQUEHANNA KANSAS CITY PARTNERSHIP)
- KCSP (610 AM; 5 kW; KANSAS CITY, MO; Owner: ENTERCOM KANSAS CITY LICENSE, LLC)
- KMBZ (980 AM; 5 kW; KANSAS CITY, MO; Owner: ENTERCOM KANSAS CITY LICENSE, LLC)
- KGGN (890 AM; daytime; 1 kW; GLADSTONE, MO; Owner: MORTENSON BROADCASTING COMPANY, INC.)
- KPRT (1590 AM; 1 kW; KANSAS CITY, MO; Owner: CARTER BROADCAST GROUP, INC.)
- KCWJ (1030 AM; 1 kW; BLUE SPRINGS, MO; Owner: CHRISTIAN BROADCASTING ASSOCIATES, LP)
- KCNW (1380 AM; 2 kW; FAIRWAY, KS; Owner: KANSAS CITY RADIO, INC.)
Strongest FM radio stations in Independence:
- KSRC (102.1 FM; KANSAS CITY, MO; Owner: INFINITY RADIO OPERATIONS INC.)
- WDAF-FM (106.5 FM; LIBERTY, MO; Owner: ENTERCOM KANSAS CITY LICENSE, LLC)
- KUDL (98.1 FM; KANSAS CITY, KS; Owner: ENTERCOM KANSAS CITY LICENSE, LLC)
- KBEQ-FM (104.3 FM; KANSAS CITY, MO; Owner: INFINITY RADIO SUBSIDIARY OPERATIONS INC.)
- KCUR-FM (89.3 FM; KANSAS CITY, MO; Owner: CURATORS OF UNIVERSITY OF MISSOURI)
- KLJC (88.5 FM; KANSAS CITY, MO; Owner: CALVARY BIBLE COLLEGE)
- KKFI (90.1 FM; KANSAS CITY, MO; Owner: MID-COAST RADIO PROJECT, INC.)
- KQRC-FM (98.9 FM; LEAVENWORTH, KS; Owner: ENTERCOM KANSAS CITY LICENSE, LLC)
- KRBZ (96.5 FM; KANSAS CITY, MO; Owner: ENTERCOM KANSAS CITY LICENSE, LLC)
- KYYS (99.7 FM; KANSAS CITY, MO; Owner: ENTERCOM KANSAS CITY LICENSE, LLC)
- KMXV (93.3 FM; KANSAS CITY, MO; Owner: INFINITY RADIO OPERATIONS INC.)
- KPRS (103.3 FM; KANSAS CITY, MO; Owner: CARTER BROADCAST GROUP, INC.)
- KCMO-FM (94.9 FM; KANSAS CITY, MO; Owner: SUSQUEHANNA KANSAS CITY PARTNERSHIP)
- KZPL (97.3 FM; LEE'S SUMMIT, MO; Owner: UNION FIRST BROADCASTING, LLC)
- KFKF-FM (94.1 FM; KANSAS CITY, KS; Owner: INFINITY RADIO SUBSIDIARY OPERATIONS INC.)
- KCFX (101.1 FM; HARRISONVILLE, MO; Owner: SUSQUEHANNA KANSAS CITY PARTNERSHIP)
- KMJK (107.3 FM; LEXINGTON, MO; Owner: ALLUR-KANSAS CITY, INC.)
- KCCV-FM (92.3 FM; OLATHE, KS; Owner: BOTT BROADCASTING COMPANY)
- KAYX (92.5 FM; RICHMOND, MO; Owner: BOTT COMMUNICATIONS, INC.)
- KWJC (91.9 FM; LIBERTY, MO; Owner: WILLIAM JEWELL COLLEGE)
TV broadcast stations around Independence:
- KCPT (Channel 19; KANSAS CITY, MO; Owner: PUBLIC TELEVISION 19, INC.)
- KSMO-TV (Channel 62; KANSAS CITY, MO; Owner: KSMO LICENSEE, INC.)
- KMBC-TV (Channel 9; KANSAS CITY, MO; Owner: KMBC HEARST-ARGYLE TELEVISION, INC.)
- K48FS (Channel 48; KANSAS CITY, MO; Owner: WORD OF GOD FELLOWSHIP, INC.)
- KCWE (Channel 29; KANSAS CITY, MO; Owner: KCWE-TV, INC.)
- KPXE (Channel 50; KANSAS CITY, MO; Owner: PAXSON KANSAS CITY LICENSE, INC.)
- KCTV (Channel 5; KANSAS CITY, MO; Owner: MEREDITH CORPORATION)
- K35CT (Channel 35; KANSAS CITY, MO; Owner: WORD OF GOD FELLOWSHIP, INC.)
- KMCI (Channel 38; LAWRENCE, KS; Owner: SCRIPPS HOWARD BROADCASTING COMPANY)
- KSHB-TV (Channel 41; KANSAS CITY, MO; Owner: SCRIPPS HOWARD BROADCASTING COMPANY)
- WDAF-TV (Channel 4; KANSAS CITY, MO; Owner: WDAF LICENSE, INC.)
- K26CR (Channel 26; KANSAS CITY, MO; Owner: VENTANA TELEVISION, INC.)
- KTAJ (Channel 16; ST. JOSEPH, MO; Owner: TRINITY BROADCASTING NETWORK)
- National Bridge Inventory (NBI) Statistics
- 192Number of bridges
- 2,431ft / 741mTotal length
- $14,570,000Total costs
- 3,066,024Total average daily traffic
- 408,541Total average daily truck traffic
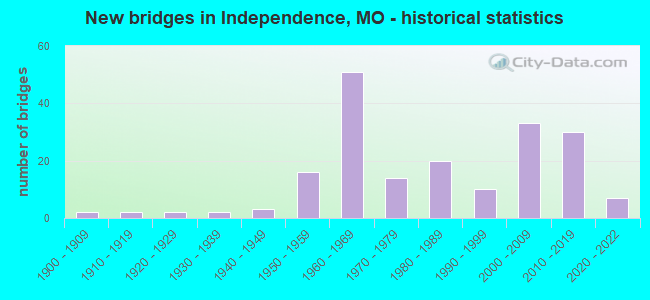
- New bridges - historical statistics
- 21900-1909
- 21910-1919
- 21920-1929
- 21930-1939
- 31940-1949
- 161950-1959
- 511960-1969
- 141970-1979
- 201980-1989
- 101990-1999
- 332000-2009
- 302010-2019
- 72020-2022
FCC Registered Antenna Towers: 209 (See the full list of FCC Registered Antenna Towers)
FCC Registered Private Land Mobile Towers: 8 (See the full list of FCC Registered Private Land Mobile Towers in Independence, MO)
FCC Registered Broadcast Land Mobile Towers: 45 (See the full list of FCC Registered Broadcast Land Mobile Towers)
FCC Registered Microwave Towers: 68 (See the full list of FCC Registered Microwave Towers in this town)
FCC Registered Paging Towers: 9 (See the full list of FCC Registered Paging Towers)
FCC Registered Maritime Coast & Aviation Ground Towers: 1 (See the full list of FCC Registered Maritime Coast & Aviation Ground Towers)
FCC Registered Amateur Radio Licenses: 836 (See the full list of FCC Registered Amateur Radio Licenses in Independence)
FAA Registered Aircraft Manufacturers and Dealers: 1 (See the full list of FAA Registered Manufacturers and Dealers in Independence)
FAA Registered Aircraft: 47 (See the full list of FAA Registered Aircraft)
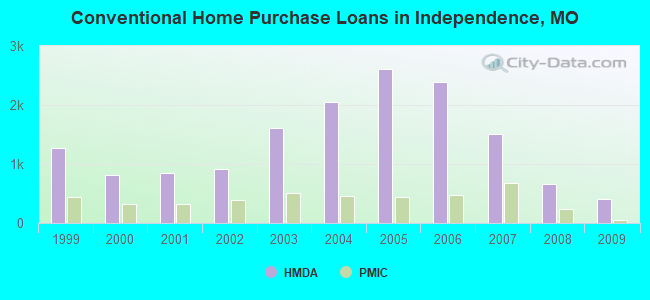
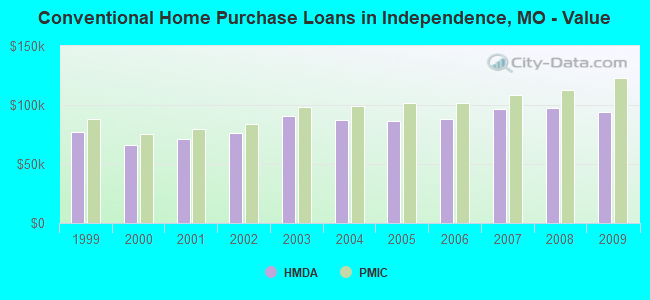
| Home Mortgage Disclosure Act Aggregated Statistics For Year 2009 (Based on 27 full tracts) | ||||||||||||||
| A) FHA, FSA/RHS & VA Home Purchase Loans | B) Conventional Home Purchase Loans | C) Refinancings | D) Home Improvement Loans | E) Loans on Dwellings For 5+ Families | F) Non-occupant Loans on < 5 Family Dwellings (A B C & D) | G) Loans On Manufactured Home Dwelling (A B C & D) | ||||||||
|---|---|---|---|---|---|---|---|---|---|---|---|---|---|---|
| Number | Average Value | Number | Average Value | Number | Average Value | Number | Average Value | Number | Average Value | Number | Average Value | Number | Average Value | |
| LOANS ORIGINATED | 706 | $100,368 | 415 | $93,985 | 1,853 | $120,684 | 147 | $33,501 | 6 | $1,920,648 | 224 | $66,206 | 4 | $29,855 |
| APPLICATIONS APPROVED, NOT ACCEPTED | 30 | $90,783 | 25 | $72,462 | 193 | $110,049 | 33 | $25,757 | 1 | $285,000 | 7 | $71,173 | 5 | $35,308 |
| APPLICATIONS DENIED | 121 | $103,396 | 69 | $68,775 | 822 | $120,496 | 163 | $27,370 | 3 | $2,789,333 | 66 | $77,913 | 7 | $25,654 |
| APPLICATIONS WITHDRAWN | 73 | $105,264 | 53 | $79,691 | 579 | $112,058 | 28 | $27,806 | 3 | $2,206,663 | 35 | $77,401 | 0 | $0 |
| FILES CLOSED FOR INCOMPLETENESS | 11 | $82,472 | 12 | $84,362 | 110 | $114,252 | 7 | $50,127 | 0 | $0 | 7 | $83,551 | 0 | $0 |
Detailed mortgage data for all 27 tracts in Independence, MO
| Private Mortgage Insurance Companies Aggregated Statistics For Year 2009 (Based on 26 full tracts) | ||||||
| A) Conventional Home Purchase Loans | B) Refinancings | C) Non-occupant Loans on < 5 Family Dwellings (A & B) | ||||
|---|---|---|---|---|---|---|
| Number | Average Value | Number | Average Value | Number | Average Value | |
| LOANS ORIGINATED | 54 | $122,693 | 63 | $149,287 | 0 | $0 |
| APPLICATIONS APPROVED, NOT ACCEPTED | 22 | $103,481 | 41 | $142,125 | 2 | $74,500 |
| APPLICATIONS DENIED | 15 | $146,705 | 22 | $123,492 | 0 | $0 |
| APPLICATIONS WITHDRAWN | 4 | $131,898 | 9 | $153,841 | 0 | $0 |
| FILES CLOSED FOR INCOMPLETENESS | 2 | $199,500 | 4 | $119,082 | 0 | $0 |
2002 - 2018 National Fire Incident Reporting System (NFIRS) incidents
- Fire incident types reported to NFIRS in Independence, MO
- 3,66848.4%Outside Fires
- 2,45932.4%Structure Fires
- 1,22916.2%Mobile Property/Vehicle Fires
- 2273.0%Other
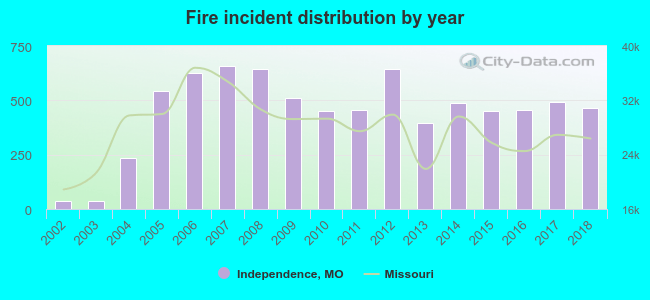 According to the data from the years 2002 - 2018 the average number of fires per year is 446. The highest number of fire incidents - 658 took place in 2007, and the least - 35 in 2002. The data has a rising trend.
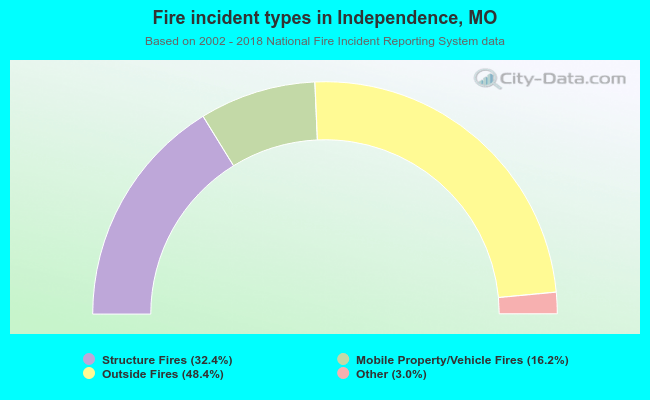 When looking into fire subcategories, the most reports belonged to: Outside Fires (48.4%), and Structure Fires (32.4%).
Fire-safe hotels and motels in Independence, Missouri:
- Quality Inn & Suites, 4200 S Noland Rd, Independence, Missouri 64055 , Phone: (816) 373-8856, Fax: (816) 373-3312
- Americas Best Value Inn, 13712 E 42ND Ter, Independence, Missouri 64055 , Phone: (816) 373-2800, Fax: (816) 373-0548
- Woodstock Inn, 1212 W Lexington, Independence, Missouri 64050 , Phone: (816) 833-2233
- Crossland Economy Studios - Kansas City - Independence, 14800 E 42ND St, Independence, Missouri 64055 , Phone: (816) 350-2151, Fax: (816) 350-2155
- Super 8 Motel, 4032 S Lynn CT Dr, Independence, Missouri 64055 , Phone: (816) 833-1888
- Best Western Truman Inn, 4048 S Lynn Ct, Independence, Missouri 64055 , Phone: (816) 254-0100, Fax: (816) 254-6796
- Holiday Inn Epxress Hotel & Suites, 19901 E Vly View Pkwy, Independence, Missouri 64057 , Phone: (816) 795-8889, Fax: (816) 795-1734
- Residence Inn Independence, 3700 S Arrowhead Ave, Independence, Missouri 64057 , Phone: (816) 795-6466, Fax: (816) 795-6466
- 9 other hotels and motels
| Most common first names in Independence, MO among deceased individuals | ||
| Name | Count | Lived (average) |
|---|---|---|
| Mary | 877 | 79.5 years |
| William | 844 | 74.1 years |
| John | 835 | 73.1 years |
| James | 708 | 72.0 years |
| Robert | 625 | 71.4 years |
| Charles | 579 | 74.1 years |
| George | 467 | 75.9 years |
| Helen | 378 | 79.9 years |
| Dorothy | 361 | 77.9 years |
| Margaret | 315 | 78.8 years |
| Most common last names in Independence, MO among deceased individuals | ||
| Last name | Count | Lived (average) |
|---|---|---|
| Smith | 500 | 75.9 years |
| Johnson | 256 | 76.1 years |
| Jones | 235 | 76.1 years |
| Williams | 231 | 75.3 years |
| Miller | 212 | 76.2 years |
| Brown | 202 | 77.4 years |
| Davis | 202 | 75.7 years |
| Wilson | 161 | 74.5 years |
| Martin | 148 | 77.0 years |
| Anderson | 134 | 78.1 years |
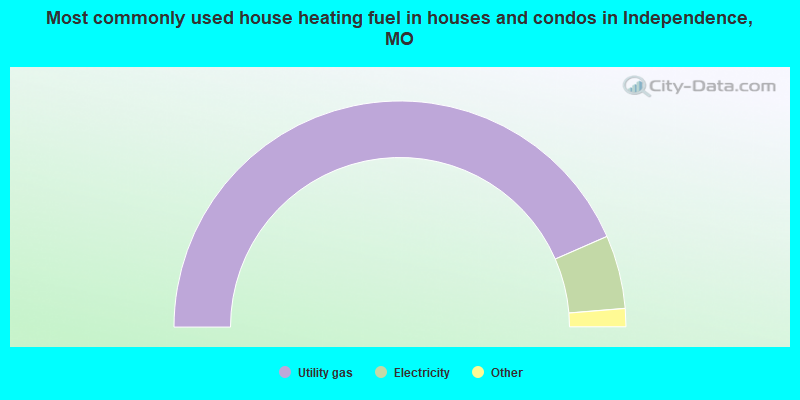
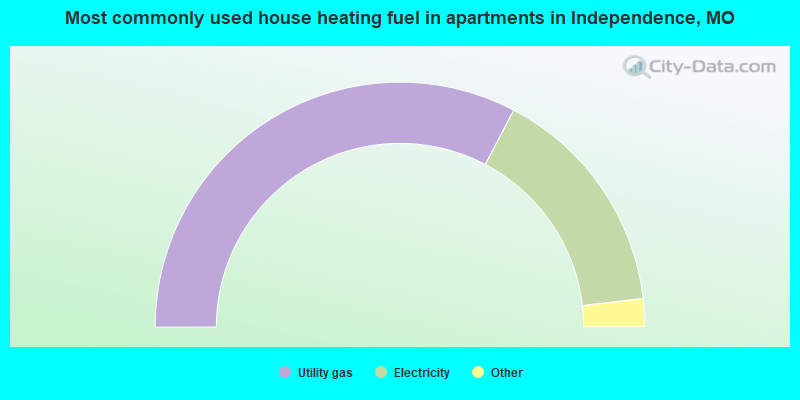
- 86.9%Utility gas
- 10.5%Electricity
- 1.6%Bottled, tank, or LP gas
- 0.6%Wood
- 0.2%No fuel used
- 65.4%Utility gas
- 30.9%Electricity
- 1.7%Bottled, tank, or LP gas
- 1.3%Wood
- 0.5%No fuel used
- 0.1%Other fuel
Independence compared to Missouri state average:
- Unemployed percentage below state average.
- Hispanic race population percentage above state average.
- Median age above state average.
- Length of stay since moving in below state average.
Independence, MO compared to other similar cities:
Independence on our top lists:
- #11 on the list of "Top 101 cities with the smallest racial income disparities between White and Black householders (with at least 2,000 householders)"
- #13 on the list of "Top 101 cities with largest percentage of males in industries: other services, except public administration (population 50,000+)"
- #25 on the list of "Top 101 cities with the highest number of thefts per 100,000 residents, excludes tourist destinations and others with a lot of outsiders visiting based on city industries data (population 50,000+)"
- #36 on the list of "Top 101 cities with largest percentage of females in industries: finance and insurance (population 50,000+)"
- #47 on the list of "Top 101 cities with largest percentage of females in occupations: office and administrative support occupations (population 50,000+)"
- #50 on the list of "Top 100 cities with lowest ratio of median house value to median household income (pop. 50,000+)"
- #53 on the list of "Top 101 cities with largest percentage of males in occupations: production occupations (population 50,000+)"
- #60 on the list of "Top 101 cities with the largest percentage of people in hospices or homes for chronically ill (population 1,000+)"
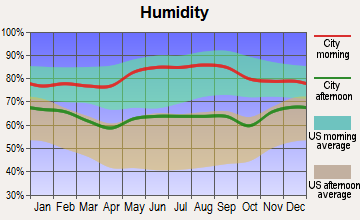
- #62 on the list of "Top 101 cities with the smallest differences between morning and afternoon humidity (population 50,000+)"
- #62 on the list of "Top 101 cities with the smallest humidity differences during a year (population 50,000+)"
- #63 on the list of "Top 101 cities with the highest number of auto thefts per 100,000 residents, excludes tourist destinations and others with a lot of outsiders visiting based on city industries data (population 50,000+)"
- #67 on the list of "Top 101 cities with the least people having professional degrees (population 50,000+)"
- #71 on the list of "Top 101 cities with the smallest racial income disparities between White and Black householders (with at least 200 householders)"
- #76 on the list of "Top 101 larger cities with the largest decrease or smallest increase in house/condo value from 2000 (population 50,000+)"
- #79 on the list of "Top 101 cities with the highest percentage of English-only speaking households, population 50,000+"
- #81 on the list of "Top 101 cities with the smallest percentages of current college students (population 100,000+)"
- #82 on the list of "Top 101 cities with largest percentage of females in industries: public administration (population 50,000+)"
- #89 on the list of "Top 101 cities with the largest temperature differences during a year (population 50,000+)"
- #90 on the list of "Top 101 cities with the largest city-data.com crime index per police officer (population 50,000+)"
- #90 on the list of "Top 101 cities with the largest percentage of one, detached housing units in structures (20,000+ housing units)"
- #47 (64053) on the list of "Top 101 zip codes with the lowest charity contributions deductions as a percentage of AGI in 2012 (pop 5,000+)"
- #4 on the list of "Top 101 counties with the highest Sulfur Oxides Annual air pollution readings in 2012 (µg/m3)"
- #20 on the list of "Top 101 counties with the highest Particulate Matter (PM10) Annual air pollution readings in 2012 (µg/m3)"
- #25 on the list of "Top 101 counties with the most Black Protestant adherents"
- #26 on the list of "Top 101 counties with the most Black Protestant congregations"
- #37 on the list of "Top 101 counties with the lowest surface withdrawal of fresh water for public supply (pop. 50,000+)"

|
|
Total of 142 patent applications in 2008-2024.