Crime rate in Independence, Missouri (MO): murders, rapes, robberies, assaults, burglaries, thefts, auto thefts, arson, law enforcement employees, police officers, crime map
Crime rate in Independence, MO
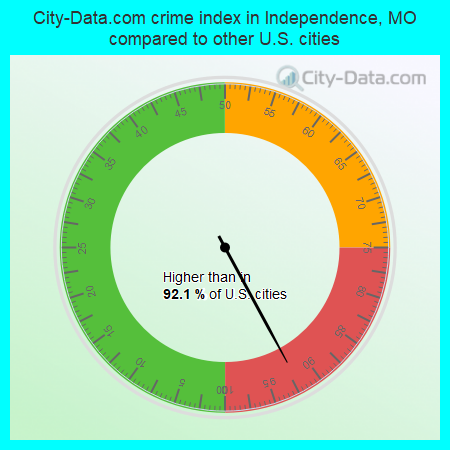
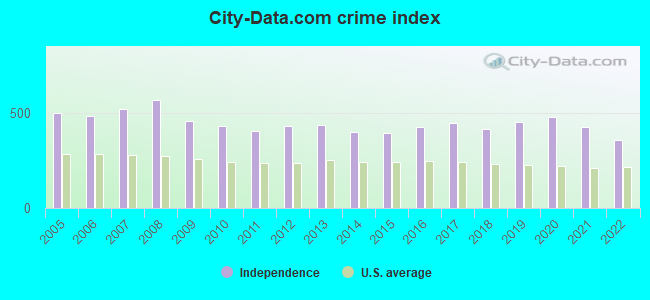
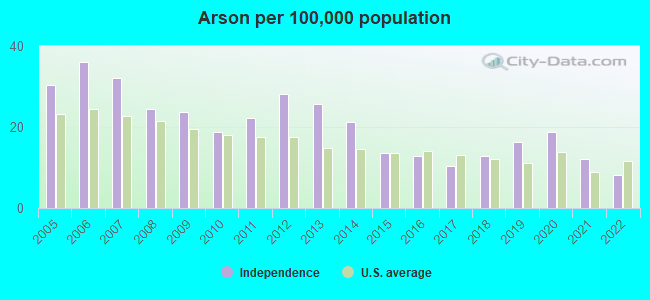
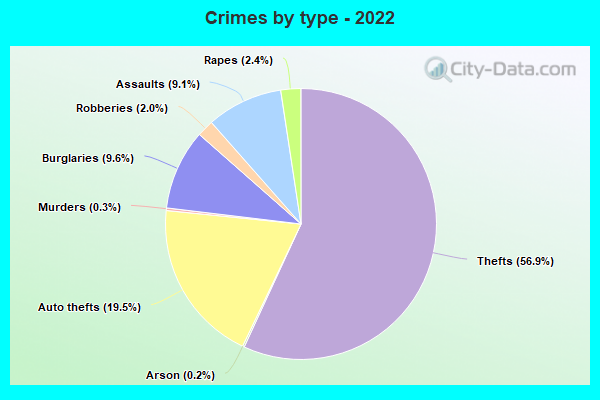
The 2022 crime rate in Independence, MO is 360 (City-Data.com crime index), which is 1.5 times higher than the U.S. average. It was higher than in 92.1% U.S. cities. The 2022 Independence crime rate fell by 16% compared to 2021. The number of homicides stood at 12 - an increase of 4 compared to 2021. In the last 5 years Independence has seen increasing violent crime and decline of property crime.See how dangerous Independence, MO is compared to the nearest cities:
(Note: Higher means more crime)
(Note: Higher means more crime)
| Independence: | 359.7 |
| Sugar Creek: | 237.6 |
| Lake Tapawingo: | 10.2 |
| Raytown: | 370.1 |
| Kansas City: | 675.1 |
| Blue Springs: | 178.9 |
| Claycomo: | 290.4 |
| North Kansas City: | 931.0 |
| Pleasant Valley: | 141.2 |
The City-Data.com crime index weighs serious crimes and violent crimes more heavily. Higher means more crime, U.S. average is 246.1. It adjusts for the number of visitors and daily workers commuting into cities.
- means the value is smaller than the state average.- means the value is about the same as the state average.
- means the value is bigger than the state average.
- means the value is much bigger than the state average.
According to our research of Missouri and other state lists, there were 445 registered sex offenders living in Independence, Missouri as of April 26, 2024.
The ratio of all residents to sex offenders in Independence is 267 to 1.
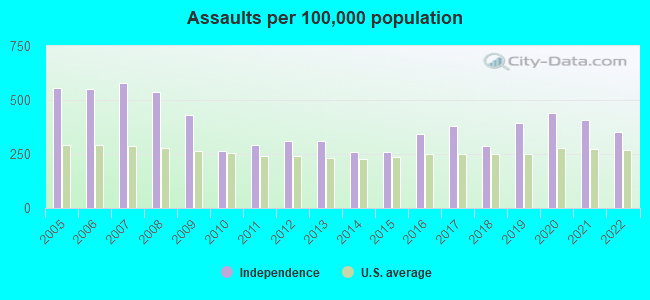
Violent crime rate in 2022
| Independence: | 324.9 |
| U.S. Average: | 219.8 |
Violent crime rate in 2021
| Independence: | 382.8 |
| U.S. Average: | 224.8 |
Violent crime rate in 2020
| Independence: | 427.8 |
| U.S. Average: | 228.2 |
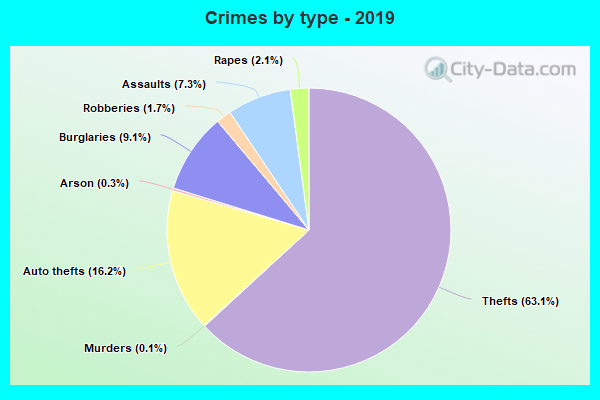
Violent crime rate in 2019
| Independence: | 371.6 |
| U.S. Average: | 219.9 |
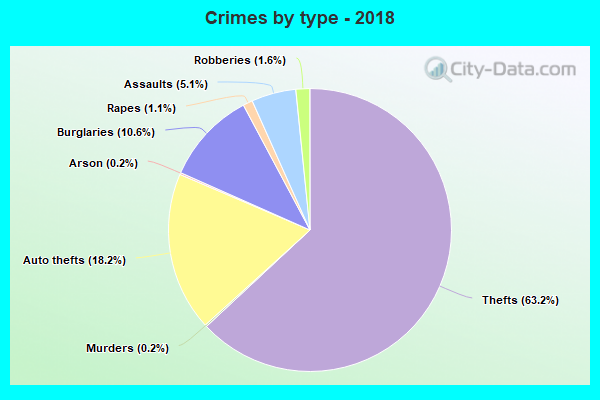
Violent crime rate in 2018
| Independence: | 264.6 |
| U.S. Average: | 221.2 |
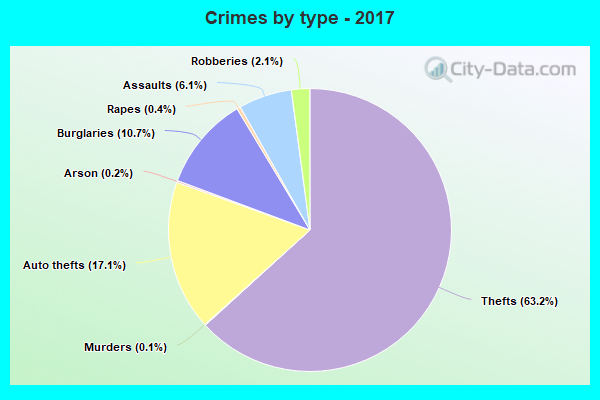
Violent crime rate in 2017
| Independence: | 304.1 |
| U.S. Average: | 226.2 |
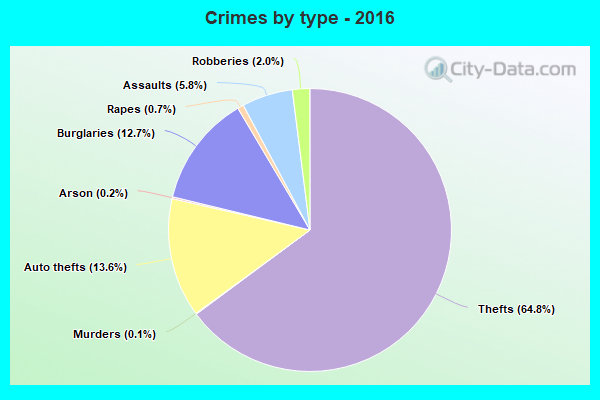
Violent crime rate in 2016
| Independence: | 288.5 |
| U.S. Average: | 227.3 |
Violent crime rate in 2015
| Independence: | 245.7 |
| U.S. Average: | 219.3 |
Violent crime rate in 2014
| Independence: | 225.0 |
| U.S. Average: | 211.1 |
Violent crime rate in 2013
| Independence: | 262.0 |
| U.S. Average: | 214.2 |
Violent crime rate in 2012
| Independence: | 253.3 |
| U.S. Average: | 187.4 |
Violent crime rate in 2011
| Independence: | 234.5 |
| U.S. Average: | 187.1 |
Violent crime rate in 2010
| Independence: | 235.8 |
| U.S. Average: | 195.7 |
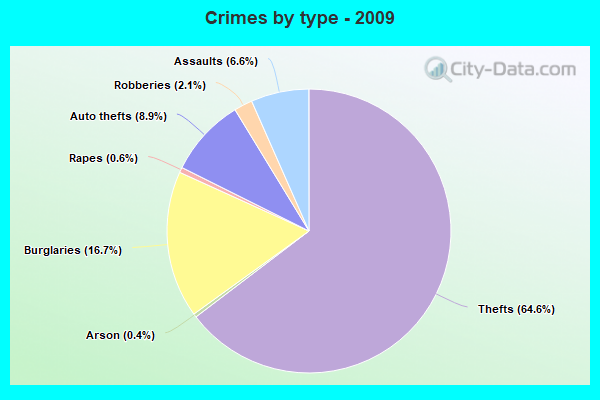
Violent crime rate in 2009
| Independence: | 331.1 |
| U.S. Average: | 208.9 |
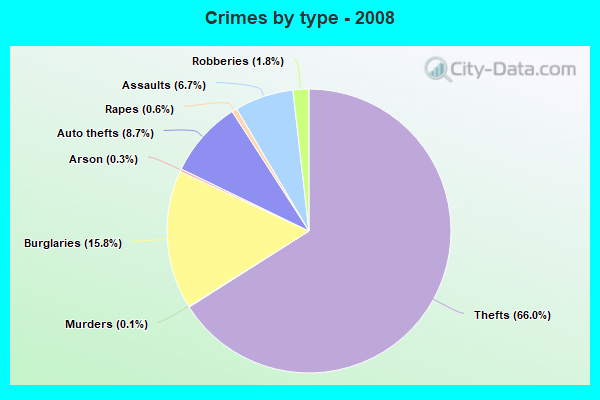
Violent crime rate in 2008
| Independence: | 411.3 |
| U.S. Average: | 222.5 |
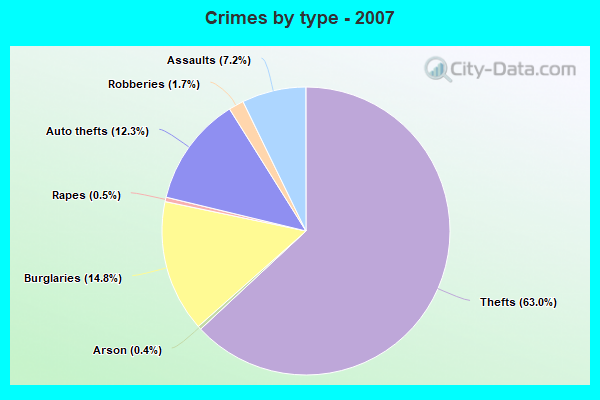
Violent crime rate in 2007
| Independence: | 377.5 |
| U.S. Average: | 229.1 |
Violent crime rate in 2006
| Independence: | 360.8 |
| U.S. Average: | 232.6 |
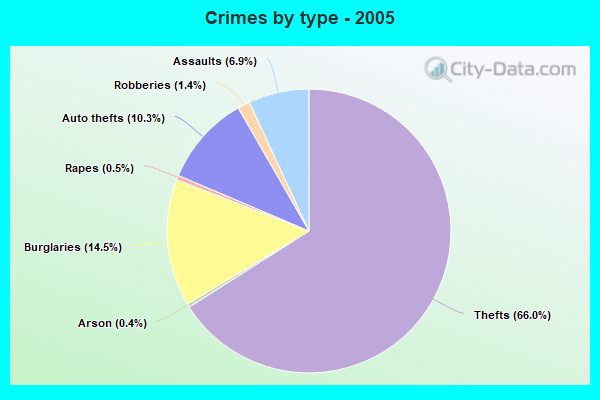
Violent crime rate in 2005
| Independence: | 349.4 |
| U.S. Average: | 227.0 |
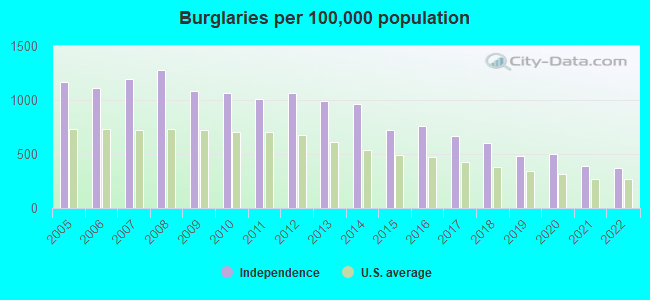
Property crime rate in 2022
| Independence: | 295.7 |
| U.S. Average: | 166.5 |
Property crime rate in 2021
| Independence: | 352.3 |
| U.S. Average: | 157.8 |
Property crime rate in 2020
| Independence: | 389.7 |
| U.S. Average: | 169.6 |
Property crime rate in 2019
| Independence: | 396.1 |
| U.S. Average: | 179.7 |
Property crime rate in 2018
| Independence: | 453.4 |
| U.S. Average: | 190.2 |
Property crime rate in 2017
| Independence: | 494.7 |
| U.S. Average: | 206.4 |
Property crime rate in 2016
| Independence: | 467.6 |
| U.S. Average: | 216.6 |
Property crime rate in 2015
| Independence: | 443.5 |
| U.S. Average: | 221.5 |
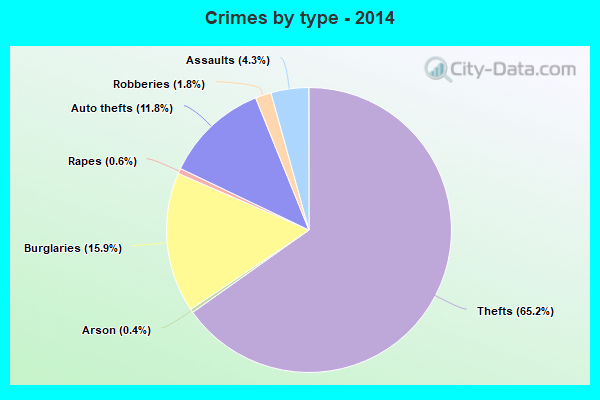
Property crime rate in 2014
| Independence: | 496.2 |
| U.S. Average: | 230.8 |
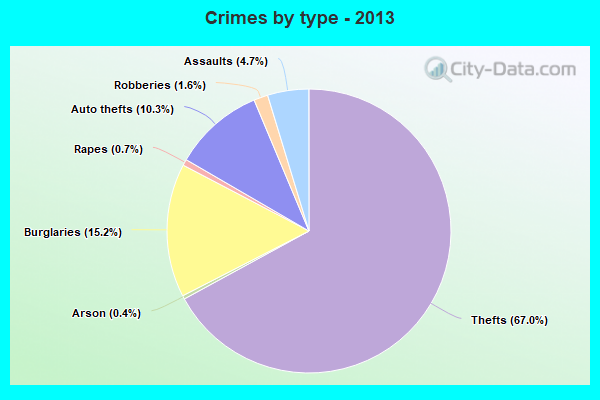
Property crime rate in 2013
| Independence: | 519.4 |
| U.S. Average: | 250.4 |
Property crime rate in 2012
| Independence: | 531.2 |
| U.S. Average: | 267.3 |
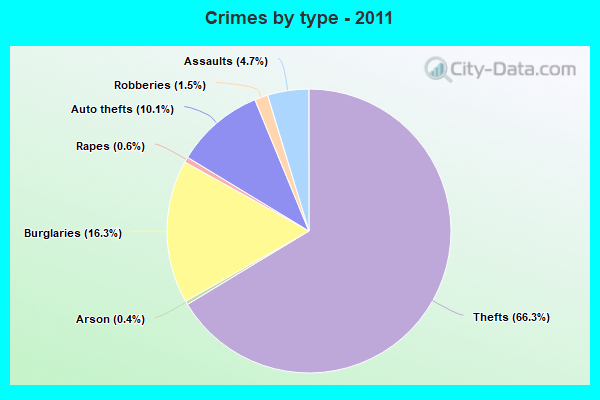
Property crime rate in 2011
| Independence: | 498.1 |
| U.S. Average: | 273.5 |
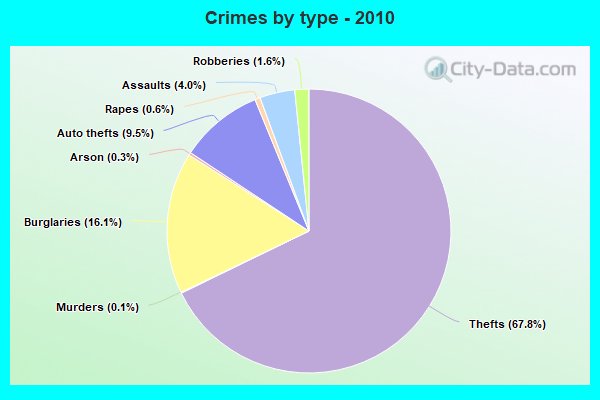
Property crime rate in 2010
| Independence: | 532.0 |
| U.S. Average: | 276.4 |
Property crime rate in 2009
| Independence: | 513.8 |
| U.S. Average: | 285.6 |
Property crime rate in 2008
| Independence: | 629.3 |
| U.S. Average: | 302.2 |
Property crime rate in 2007
| Independence: | 585.6 |
| U.S. Average: | 309.2 |
Property crime rate in 2006
| Independence: | 532.3 |
| U.S. Average: | 317.3 |
Property crime rate in 2005
| Independence: | 567.9 |
| U.S. Average: | 322.3 |

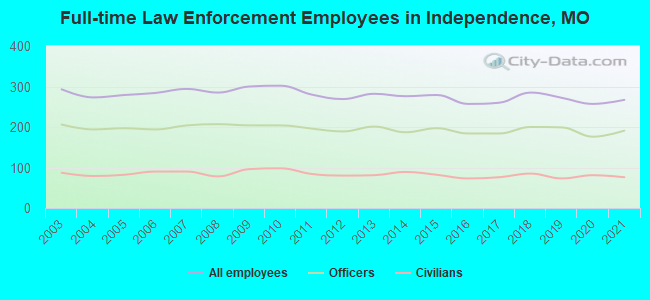
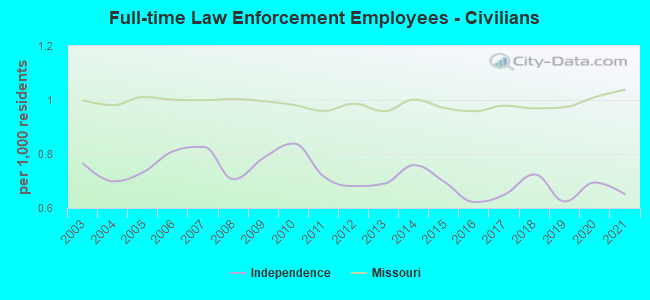
Full-time law enforcement employees in 2021, including police officers: 267 (191 officers - 169 male; 22 female).
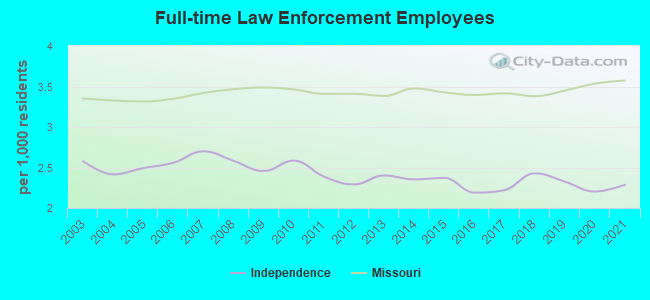
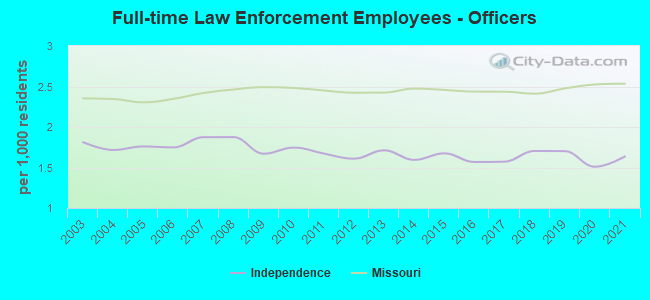
| Officers per 1,000 residents here: | 1.64 |
| Missouri average: | 2.54 |
Full-time law enforcement employees in 2020, including police officers: 257 (176 officers - 160 male; 16 female).
| Officers per 1,000 residents here: | 1.51 |
| Missouri average: | 2.53 |
Full-time law enforcement employees in 2019, including police officers: 272 (199 officers - 180 male; 19 female).
| Officers per 1,000 residents here: | 1.70 |
| Missouri average: | 2.48 |
Full-time law enforcement employees in 2018, including police officers: 285 (200 officers - 182 male; 18 female).
| Officers per 1,000 residents here: | 1.70 |
| Missouri average: | 2.41 |
Full-time law enforcement employees in 2017, including police officers: 260 (184 officers - 165 male; 19 female).
| Officers per 1,000 residents here: | 1.57 |
| Missouri average: | 2.44 |
Full-time law enforcement employees in 2016, including police officers: 257 (184 officers - 167 male; 17 female).
| Officers per 1,000 residents here: | 1.57 |
| Missouri average: | 2.44 |
Full-time law enforcement employees in 2015, including police officers: 279 (197 officers - 180 male; 17 female).
| Officers per 1,000 residents here: | 1.67 |
| Missouri average: | 2.46 |
Full-time law enforcement employees in 2014, including police officers: 276 (187 officers - 172 male; 15 female).
| Officers per 1,000 residents here: | 1.59 |
| Missouri average: | 2.47 |
Full-time law enforcement employees in 2013, including police officers: 282 (201 officers - 185 male; 16 female).
| Officers per 1,000 residents here: | 1.71 |
| Missouri average: | 2.42 |
Full-time law enforcement employees in 2012, including police officers: 269 (189 officers - 175 male; 14 female).
| Officers per 1,000 residents here: | 1.61 |
| Missouri average: | 2.42 |
Full-time law enforcement employees in 2011, including police officers: 280 (196 officers - 182 male; 14 female).
| Officers per 1,000 residents here: | 1.67 |
| Missouri average: | 2.45 |
Full-time law enforcement employees in 2010, including police officers: 302 (204 officers - 190 male; 14 female).
| Officers per 1,000 residents here: | 1.75 |
| Missouri average: | 2.48 |
Full-time law enforcement employees in 2009, including police officers: 300 (204 officers - 189 male; 15 female).
| Officers per 1,000 residents here: | 1.67 |
| Missouri average: | 2.49 |
Full-time law enforcement employees in 2008, including police officers: 285 (207 officers - 193 male; 14 female).
| Officers per 1,000 residents here: | 1.88 |
| Missouri average: | 2.46 |
Full-time law enforcement employees in 2007, including police officers: 294 (204 officers - 190 male; 14 female).
| Officers per 1,000 residents here: | 1.87 |
| Missouri average: | 2.42 |
Full-time law enforcement employees in 2006, including police officers: 284 (194 officers - 181 male; 13 female).
| Officers per 1,000 residents here: | 1.75 |
| Missouri average: | 2.35 |
Full-time law enforcement employees in 2005, including police officers: 279 (197 officers - 183 male; 14 female).
| Officers per 1,000 residents here: | 1.76 |
| Missouri average: | 2.30 |
Full-time law enforcement employees in 2004, including police officers: 273 (194 officers - 183 male; 11 female).
| Officers per 1,000 residents here: | 1.72 |
| Missouri average: | 2.35 |
Full-time law enforcement employees in 2003, including police officers: 293 (206 officers - 196 male; 10 female).
| Officers per 1,000 residents here: | 1.81 |
| Missouri average: | 2.35 |


Zip codes: 64050, 64052, 64053, 64054, 64055, 64056, 64058, 64120, 64133, 64136.