Crime rate in Kansas City, Missouri (MO): murders, rapes, robberies, assaults, burglaries, thefts, auto thefts, arson, law enforcement employees, police officers, crime map
Crime rate in Kansas City, MO
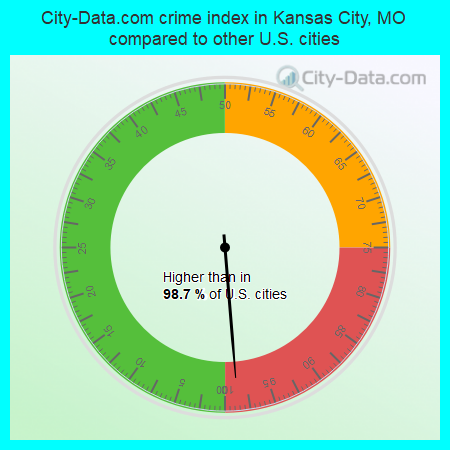
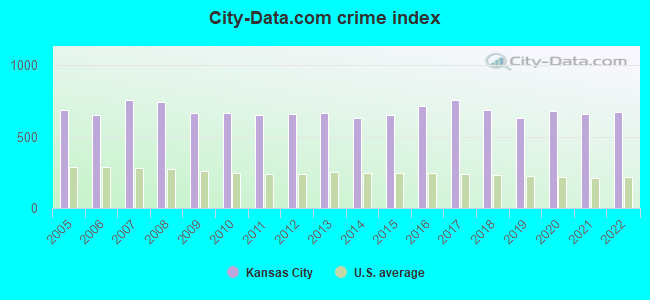
The 2022 crime rate in Kansas City, MO is 675 (City-Data.com crime index), which is 2.7 times higher than the U.S. average. It was higher than in 98.7% U.S. cities. The 2022 Kansas City crime rate rose by 3% compared to 2021. The number of homicides stood at 166 - an increase of 10 compared to 2021. In the last 5 years Kansas City has seen decreasing violent crime and rise of property crime.(Note: Higher means more crime)
| Kansas City: | 675.1 |
| Westwood Hills: | 270.4 |
| Westwood: | 304.2 |
| Mission Woods: | 140.7 |
| North Kansas City: | 931.0 |
| Roeland Park: | 277.4 |
| Fairway: | 82.0 |
| Mission Hills: | 174.6 |
| Mission: | 399.2 |
The City-Data.com crime index weighs serious crimes and violent crimes more heavily. Higher means more crime, U.S. average is 246.1. It adjusts for the number of visitors and daily workers commuting into cities.
- means the value is bigger than the state average.- means the value is much bigger than the state average.
According to our research of Missouri and other state lists, there were 1,788 registered sex offenders living in Kansas City, Missouri as of April 27, 2024.
The ratio of all residents to sex offenders in Kansas City is 269 to 1.
Violent crime rate in 2022
| Kansas City: | 826.9 |
| U.S. Average: | 219.8 |
Violent crime rate in 2021
| Kansas City: | 830.4 |
| U.S. Average: | 224.8 |
Violent crime rate in 2020
| Kansas City: | 892.0 |
| U.S. Average: | 228.2 |
Violent crime rate in 2019
| Kansas City: | 816.7 |
| U.S. Average: | 219.9 |
Violent crime rate in 2018
| Kansas City: | 890.1 |
| U.S. Average: | 221.2 |
Violent crime rate in 2017
| Kansas City: | 977.5 |
| U.S. Average: | 226.2 |
Violent crime rate in 2016
| Kansas City: | 913.7 |
| U.S. Average: | 227.3 |
Violent crime rate in 2015
| Kansas City: | 786.7 |
| U.S. Average: | 219.3 |
Violent crime rate in 2014
| Kansas City: | 698.2 |
| U.S. Average: | 211.1 |
Violent crime rate in 2013
| Kansas City: | 705.1 |
| U.S. Average: | 214.2 |
Violent crime rate in 2012
| Kansas City: | 696.1 |
| U.S. Average: | 187.4 |
Violent crime rate in 2011
| Kansas City: | 666.5 |
| U.S. Average: | 187.1 |
Violent crime rate in 2010
| Kansas City: | 673.1 |
| U.S. Average: | 195.7 |
Violent crime rate in 2009
| Kansas City: | 709.6 |
| U.S. Average: | 208.9 |
Violent crime rate in 2008
| Kansas City: | 760.0 |
| U.S. Average: | 222.5 |
Violent crime rate in 2007
| Kansas City: | 830.1 |
| U.S. Average: | 229.1 |
Violent crime rate in 2006
| Kansas City: | 648.3 |
| U.S. Average: | 232.6 |
Violent crime rate in 2005
| Kansas City: | 656.1 |
| U.S. Average: | 227.0 |
Property crime rate in 2022
| Kansas City: | 440.4 |
| U.S. Average: | 166.5 |
Property crime rate in 2021
| Kansas City: | 394.4 |
| U.S. Average: | 157.8 |
Property crime rate in 2020
| Kansas City: | 393.1 |
| U.S. Average: | 169.6 |
Property crime rate in 2019
| Kansas City: | 369.8 |
| U.S. Average: | 179.7 |
Property crime rate in 2018
| Kansas City: | 416.3 |
| U.S. Average: | 190.2 |
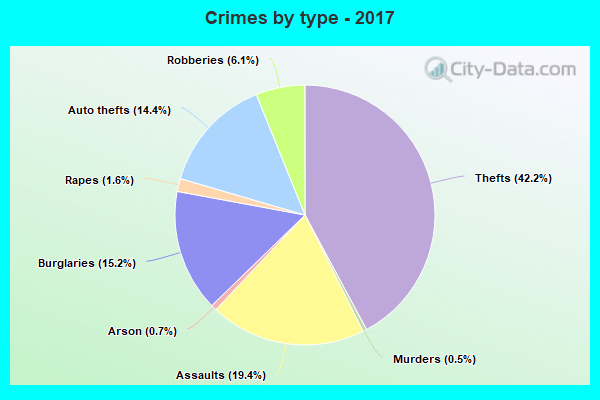
Property crime rate in 2017
| Kansas City: | 464.6 |
| U.S. Average: | 206.4 |
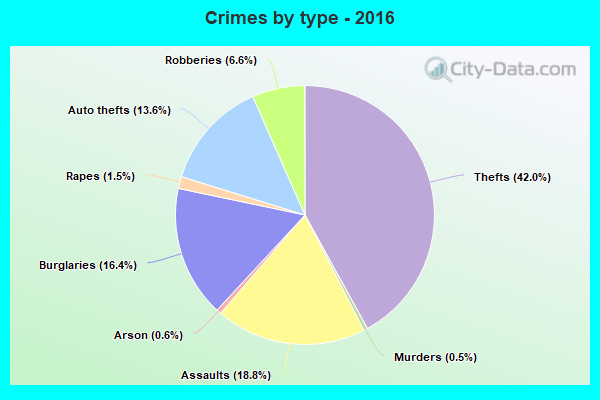
Property crime rate in 2016
| Kansas City: | 451.1 |
| U.S. Average: | 216.6 |
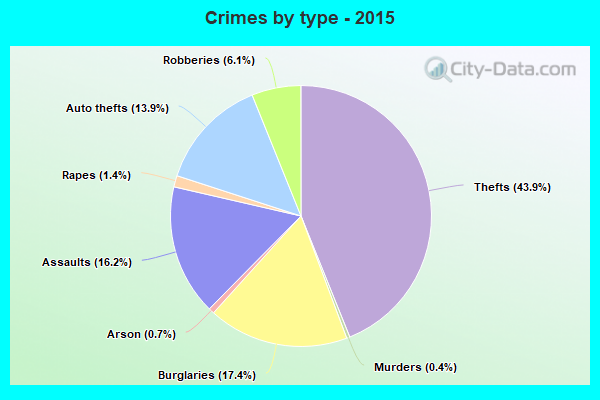
Property crime rate in 2015
| Kansas City: | 460.5 |
| U.S. Average: | 221.5 |
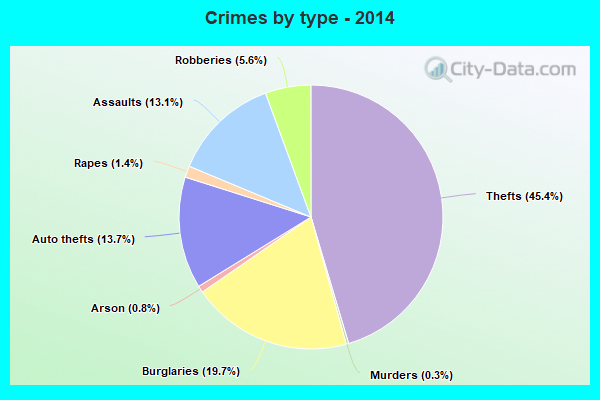
Property crime rate in 2014
| Kansas City: | 510.0 |
| U.S. Average: | 230.8 |
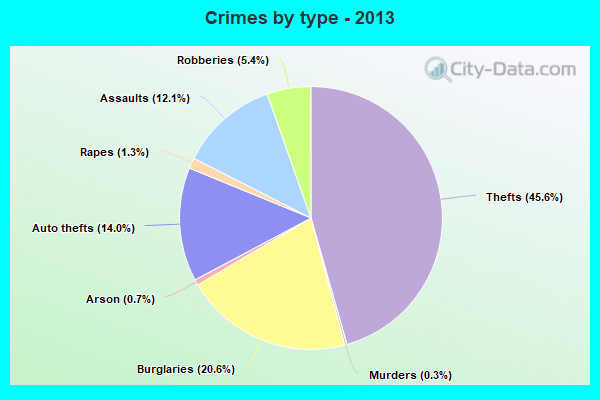
Property crime rate in 2013
| Kansas City: | 561.4 |
| U.S. Average: | 250.4 |
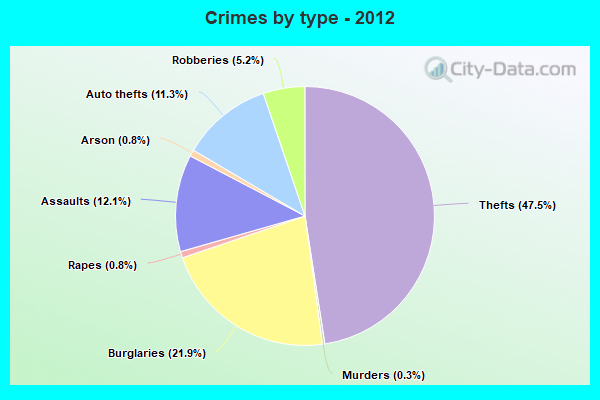
Property crime rate in 2012
| Kansas City: | 582.0 |
| U.S. Average: | 267.3 |
Property crime rate in 2011
| Kansas City: | 576.2 |
| U.S. Average: | 273.5 |
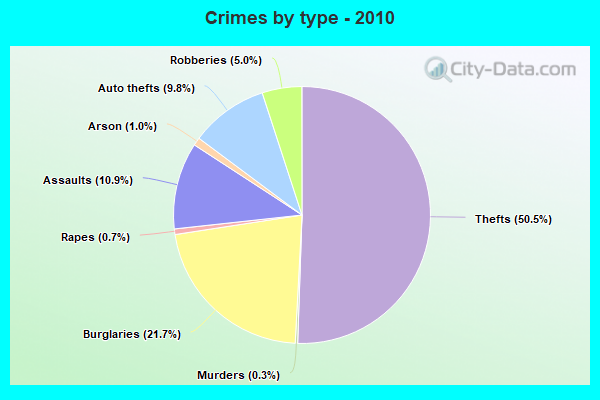
Property crime rate in 2010
| Kansas City: | 600.7 |
| U.S. Average: | 276.4 |
Property crime rate in 2009
| Kansas City: | 571.9 |
| U.S. Average: | 285.6 |
Property crime rate in 2008
| Kansas City: | 657.6 |
| U.S. Average: | 302.2 |
Property crime rate in 2007
| Kansas City: | 625.8 |
| U.S. Average: | 309.2 |
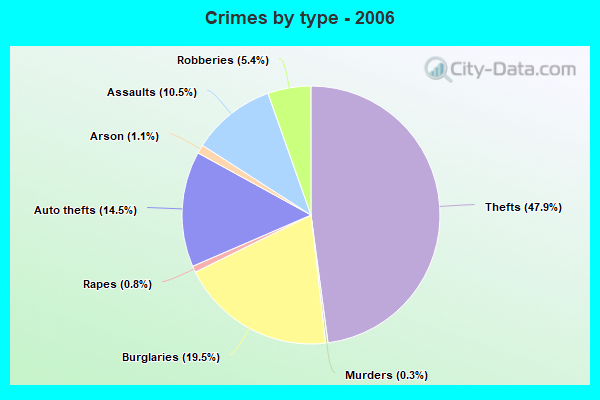
Property crime rate in 2006
| Kansas City: | 584.9 |
| U.S. Average: | 317.3 |
Property crime rate in 2005
| Kansas City: | 625.2 |
| U.S. Average: | 322.3 |


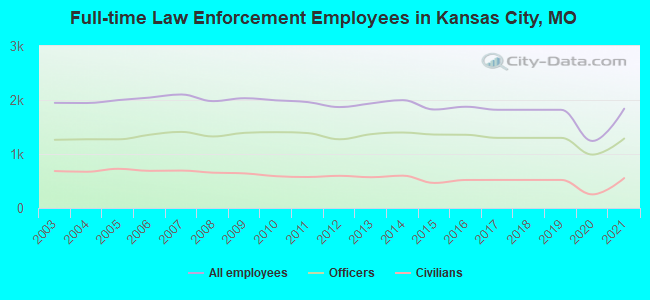
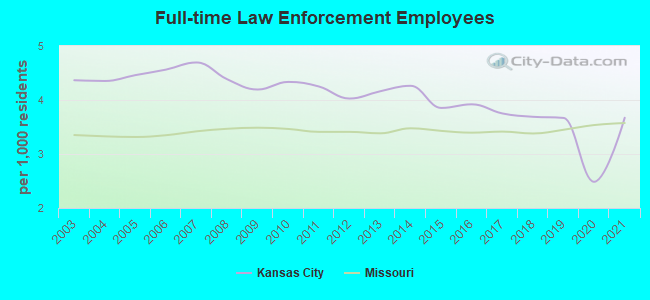
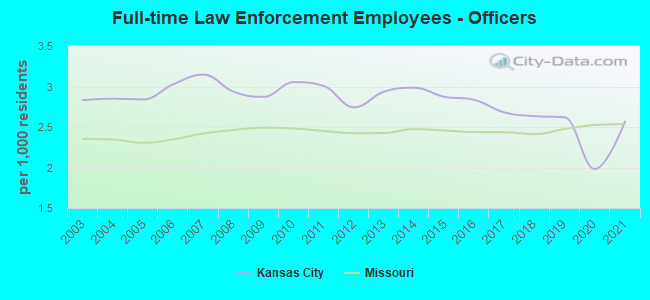
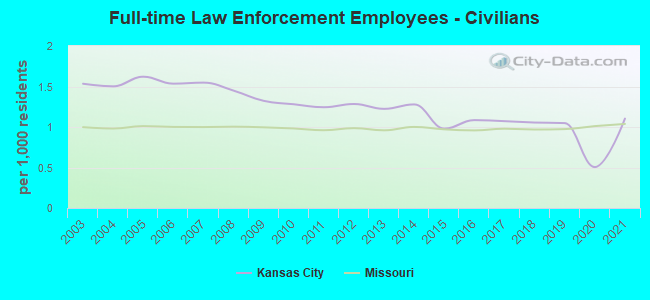
Full-time law enforcement employees in 2021, including police officers: 1,839 (1,286 officers - 1,101 male; 185 female).
| Officers per 1,000 residents here: | 2.57 |
| Missouri average: | 2.54 |
Full-time law enforcement employees in 2020, including police officers: 1,241 (989 officers - 854 male; 135 female).
| Officers per 1,000 residents here: | 1.98 |
| Missouri average: | 2.53 |
Full-time law enforcement employees in 2019, including police officers: 1,819 (1,299 officers - 1,105 male; 194 female).
| Officers per 1,000 residents here: | 2.62 |
| Missouri average: | 2.48 |
Full-time law enforcement employees in 2018, including police officers: 1,819 (1,299 officers - 1,105 male; 194 female).
| Officers per 1,000 residents here: | 2.63 |
| Missouri average: | 2.41 |
Full-time law enforcement employees in 2017, including police officers: 1,819 (1,299 officers - 1,105 male; 194 female).
| Officers per 1,000 residents here: | 2.68 |
| Missouri average: | 2.44 |
Full-time law enforcement employees in 2016, including police officers: 1,875 (1,356 officers - 1,155 male; 201 female).
| Officers per 1,000 residents here: | 2.83 |
| Missouri average: | 2.44 |
Full-time law enforcement employees in 2015, including police officers: 1,824 (1,360 officers - 1,166 male; 194 female).
| Officers per 1,000 residents here: | 2.87 |
| Missouri average: | 2.46 |
Full-time law enforcement employees in 2014, including police officers: 1,997 (1,398 officers - 1,201 male; 197 female).
| Officers per 1,000 residents here: | 2.98 |
| Missouri average: | 2.47 |
Full-time law enforcement employees in 2013, including police officers: 1,937 (1,367 officers - 1,181 male; 186 female).
| Officers per 1,000 residents here: | 2.94 |
| Missouri average: | 2.42 |
Full-time law enforcement employees in 2012, including police officers: 1,869 (1,273 officers - 1,094 male; 179 female).
| Officers per 1,000 residents here: | 2.74 |
| Missouri average: | 2.42 |
Full-time law enforcement employees in 2011, including police officers: 1,961 (1,387 officers - 1,198 male; 189 female).
| Officers per 1,000 residents here: | 3.01 |
| Missouri average: | 2.45 |
Full-time law enforcement employees in 2010, including police officers: 1,993 (1,404 officers - 1,211 male; 193 female).
| Officers per 1,000 residents here: | 3.05 |
| Missouri average: | 2.48 |
Full-time law enforcement employees in 2009, including police officers: 2,033 (1,392 officers - 1,203 male; 189 female).
| Officers per 1,000 residents here: | 2.87 |
| Missouri average: | 2.49 |
Full-time law enforcement employees in 2008, including police officers: 1,979 (1,325 officers - 1,128 male; 197 female).
| Officers per 1,000 residents here: | 2.93 |
| Missouri average: | 2.46 |
Full-time law enforcement employees in 2007, including police officers: 2,102 (1,409 officers - 1,211 male; 198 female).
| Officers per 1,000 residents here: | 3.15 |
| Missouri average: | 2.42 |
Full-time law enforcement employees in 2006, including police officers: 2,045 (1,357 officers - 1,160 male; 197 female).
| Officers per 1,000 residents here: | 3.03 |
| Missouri average: | 2.35 |
Full-time law enforcement employees in 2005, including police officers: 1,998 (1,272 officers - 1,095 male; 177 female).
| Officers per 1,000 residents here: | 2.84 |
| Missouri average: | 2.30 |
Full-time law enforcement employees in 2004, including police officers: 1,944 (1,273 officers - 1,090 male; 183 female).
| Officers per 1,000 residents here: | 2.85 |
| Missouri average: | 2.35 |
Full-time law enforcement employees in 2003, including police officers: 1,947 (1,263 officers - 1,080 male; 183 female).
| Officers per 1,000 residents here: | 2.83 |
| Missouri average: | 2.35 |


Zip codes: 64081, 64082, 64101, 64102, 64105, 64106, 64108, 64109, 64110, 64111, 64112, 64113, 64114, 64123, 64124, 64125, 64126, 64127, 64128, 64129, 64130, 64131, 64132, 64134, 64138, 64139, 64145, 64146, 64147, 64149, 64150, 64152, 64153, 64154, 64155, 64156, 64157, 64158, 64164, 64165, 64166, 64167, 64192.