Estimated zip code population in 2022: 24,275 Zip code population in 2010: 25,294 Zip code population in 2000: 24,940
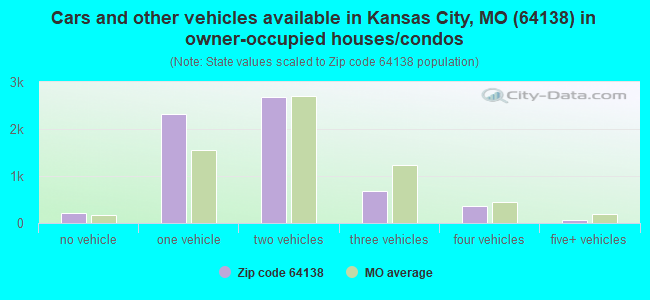
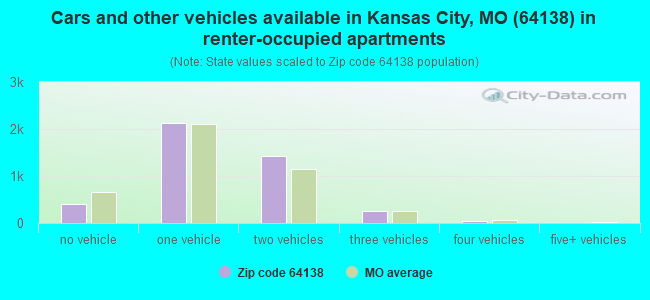
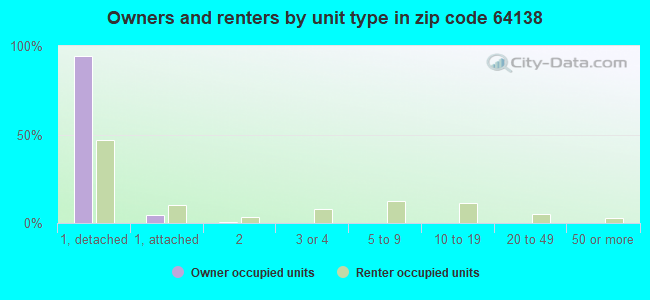
Houses and condos: 11,281 Renter-occupied apartments: 4,266
% of renters here:
40%
State:
32%
March 2022 cost of living index in zip code 64138: 86.7 (less than average, U.S. average is 100)
Land area: 13.4 sq. mi. Water area: 0.0 sq. mi.
Population density: 1,812 people per square mile
(low).
OSM Map
General Map
Google Map
MSN Map
OSM Map
General Map
Google Map
MSN Map
OSM Map
General Map
Google Map
MSN Map
OSM Map
General Map
Google Map
MSN Map
Please wait while loading the map...
Real estate property taxes paid for housing units in 2022:
This zip code:
1.1% ($1,923)
Missouri:
0.8% ($1,810)
Median real estate property taxes paid for housing units with mortgages in 2022: $1,850 (1.1%) Median real estate property taxes paid for housing units with no mortgage in 2022: $2,123 (1.2%)
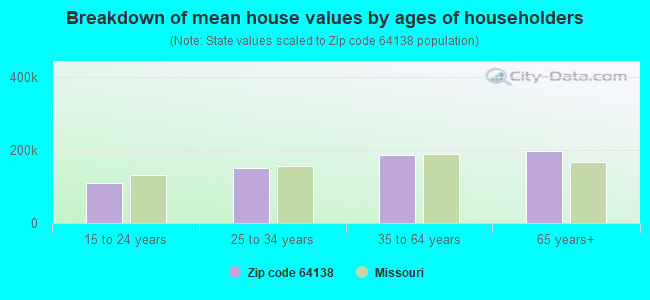
Estimated median house/condo value in 2022: $169,283
64138:
$169,283
Missouri:
$221,200
According to our research of Missouri and other state lists, there were 68 registered sex offenders living in 64138 zip code as of April 27, 2024. The ratio of all residents to sex offenders in zip code 64138 is 403 to 1. The ratio of registered sex offenders to all residents in this zip code is near the state average.
Median resident age:
This zip code:
40.3 years
Missouri median age:
39.1 years
Average household size:
This zip code:
2.3 people
Missouri:
2.4 people
Averages for the 2020 tax year for zip code 64138, filed in 2021:
Average Adjusted Gross Income (AGI) in 2020: $45,367 (Individual Income Tax Returns)
Here:
$45,367
State:
$68,151
Salary/wage: $40,962 (reported on 84.2% of returns)
Here:
$40,962
State:
$56,131
(% of AGI for various income ranges: 1237.1% for AGIs below $25k, 3880.7% for AGIs $25k-50k, 7257.2% for AGIs $50k-75k, 10102.4% for AGIs $75k-100k, 17472.6% for AGIs $100k-200k, 82210.0% for AGIs over 200k)
Taxable interest for individuals: $915 (reported on 19.3% of returns)
This zip code:
$915
Missouri:
$1,586
(% of AGI for various income ranges: 8.3% for AGIs below $25k, 10.4% for AGIs $25k-50k, 26.8% for AGIs $50k-75k, 61.4% for AGIs $75k-100k, 148.1% for AGIs $100k-200k, 613.3% for AGIs over 200k)
Ordinary dividends: $3,586 (reported on 9.5% of returns)
Here:
$3,586
State:
$10,947
(% of AGI for various income ranges: 11.3% for AGIs below $25k, 12.0% for AGIs $25k-50k, 45.3% for AGIs $50k-75k, 91.4% for AGIs $75k-100k, 318.9% for AGIs $100k-200k, 3003.3% for AGIs over 200k)
Net capital gain/loss in AGI: +$7,895 (reported on 8.4% of returns)
Here:
+$7,895
State:
+$18,453
(% of AGI for various income ranges: 3.3% for AGIs below $25k, 10.6% for AGIs $25k-50k, 68.9% for AGIs $50k-75k, 91.4% for AGIs $75k-100k, 648.7% for AGIs $100k-200k, 11516.7% for AGIs over 200k)
Profit/loss from business: +$5,349 (reported on 13.1% of returns)
Here:
+$5,349
State:
+$12,260
(% of AGI for various income ranges: 70.4% for AGIs below $25k, 58.9% for AGIs $25k-50k, 127.5% for AGIs $50k-75k, 173.3% for AGIs $75k-100k, 277.2% for AGIs $100k-200k, 1420.0% for AGIs over 200k)
Taxable individual retirement arrangement distribution: $16,277 (reported on 7.6% of returns)
64138:
$16,277
Missouri:
$19,719
(% of AGI for various income ranges: 42.5% for AGIs below $25k, 62.8% for AGIs $25k-50k, 183.1% for AGIs $50k-75k, 469.5% for AGIs $75k-100k, 1453.4% for AGIs $100k-200k)
Total itemized deductions: $27,190 (reported on 4.7% of returns)
Here:
$27,190
State:
$36,651
(% of AGI for various income ranges: 25.8% for AGIs below $25k, 72.8% for AGIs $25k-50k, 287.5% for AGIs $50k-75k, 461.6% for AGIs $75k-100k, 936.0% for AGIs $100k-200k, 6300.0% for AGIs over 200k)
Charity contributions: $9,513 (reported on 4.0% of returns)
Here:
$9,513
State:
$15,671
(% of AGI for various income ranges: 18.2% for AGIs $25k-50k, 74.9% for AGIs $50k-75k, 105.4% for AGIs $75k-100k, 349.8% for AGIs $100k-200k, 3250.0% for AGIs over 200k)
Taxes paid: $6,277 (reported on 4.7% of returns)
64138:
$6,277
State:
$7,608
(% of AGI for various income ranges: 3.2% for AGIs below $25k, 11.8% for AGIs $25k-50k, 58.2% for AGIs $50k-75k, 129.0% for AGIs $75k-100k, 287.2% for AGIs $100k-200k, 1120.0% for AGIs over 200k)
Earned income credit: $2,440 (reported on 22.3% of returns)
Here:
$2,440
State:
$2,315
(% of AGI for various income ranges: 118.4% for AGIs below $25k, 86.9% for AGIs $25k-50k, 1.1% for AGIs $50k-75k)
Percentage of individuals using paid preparers for their 2020 taxes: 91.8%
Here:
92%
State:
93%
(% for various income ranges: 92.1% for AGIs below $25k, 91.9% for AGIs $25k-50k, 91.0% for AGIs $50k-75k, 92.0% for AGIs $75k-100k, 89.9% for AGIs $100k-200k, 100.0% for AGIs over 200k)
Averages for the 2012 tax year for zip code 64138, filed in 2013:
Average Adjusted Gross Income (AGI) in 2012: $40,377 (Individual Income Tax Returns)
Here:
$40,377
State:
$55,896
Salary/wage: $35,753 (reported on 84.9% of returns)
Here:
$35,753
State:
$46,205
(% of AGI for various income ranges: 76.0% for AGIs below $25k, 82.2% for AGIs $25k-50k, 75.5% for AGIs $50k-75k, 74.3% for AGIs $75k-100k, 73.0% for AGIs $100k-200k, 45.0% for AGIs over 200k)
Taxable interest for individuals: $1,202 (reported on 23.0% of returns)
This zip code:
$1,202
Missouri:
$1,559
(% of AGI for various income ranges: 0.8% for AGIs below $25k, 0.4% for AGIs $25k-50k, 0.8% for AGIs $50k-75k, 0.7% for AGIs $75k-100k, 0.7% for AGIs $100k-200k, 1.5% for AGIs over 200k)
Ordinary dividends: $2,990 (reported on 12.0% of returns)
Here:
$2,990
State:
$7,410
(% of AGI for various income ranges: 0.8% for AGIs below $25k, 0.5% for AGIs $25k-50k, 0.8% for AGIs $50k-75k, 1.0% for AGIs $75k-100k, 0.9% for AGIs $100k-200k, 3.6% for AGIs over 200k)
Net capital gain/loss in AGI: +$4,356 (reported on 8.5% of returns)
Here:
+$4,356
State:
+$11,579
(% of AGI for various income ranges: 0.3% for AGIs $50k-75k, 0.6% for AGIs $75k-100k, 1.3% for AGIs $100k-200k, 10.3% for AGIs over 200k)
Profit/loss from business: +$6,834 (reported on 11.8% of returns)
Here:
+$6,834
State:
+$11,688
(% of AGI for various income ranges: 6.1% for AGIs below $25k, 1.5% for AGIs $25k-50k, 0.9% for AGIs $50k-75k, 1.7% for AGIs $75k-100k, 1.8% for AGIs $100k-200k)
Taxable individual retirement arrangement distribution: $13,370 (reported on 9.9% of returns)
64138:
$13,370
Missouri:
$14,773
(% of AGI for various income ranges: 2.6% for AGIs below $25k, 2.2% for AGIs $25k-50k, 3.3% for AGIs $50k-75k, 4.0% for AGIs $75k-100k, 6.0% for AGIs $100k-200k)
Total itemized deductions: $16,728 (24% of AGI, reported on 27.4% of returns)
Here:
$16,728
State:
$22,730
Here:
23.8% of AGI
State:
19.2% of AGI
(% of AGI for various income ranges: 7.1% for AGIs below $25k, 9.5% for AGIs $25k-50k, 12.4% for AGIs $50k-75k, 13.1% for AGIs $75k-100k, 14.2% for AGIs $100k-200k, 13.3% for AGIs over 200k)
Charity contributions: $4,012 (reported on 22.2% of returns)
Here:
$4,012
State:
$4,745
(% of AGI for various income ranges: 1.0% for AGIs below $25k, 1.5% for AGIs $25k-50k, 2.4% for AGIs $50k-75k, 2.7% for AGIs $75k-100k, 3.3% for AGIs $100k-200k, 3.1% for AGIs over 200k)
Taxes paid: $5,591 (reported on 27.3% of returns)
64138:
$5,591
State:
$8,399
(% of AGI for various income ranges: 1.4% for AGIs below $25k, 2.7% for AGIs $25k-50k, 4.0% for AGIs $50k-75k, 4.4% for AGIs $75k-100k, 5.9% for AGIs $100k-200k, 6.3% for AGIs over 200k)
Earned income credit: $2,466 (reported on 25.2% of returns)
Here:
$2,466
State:
$2,288
(% of AGI for various income ranges: 8.8% for AGIs below $25k, 1.3% for AGIs $25k-50k)
Percentage of individuals using paid preparers for their 2012 taxes: 47.8%
Here:
48%
State:
55%
(% for various income ranges: 44.6% for AGIs below $25k, 45.6% for AGIs $25k-50k, 53.8% for AGIs $50k-75k, 55.6% for AGIs $75k-100k, 54.7% for AGIs $100k-200k, 85.7% for AGIs over 200k)
Averages for the 2004 tax year for zip code 64138, filed in 2005:
Average Adjusted Gross Income (AGI) in 2004: $37,100 (Individual Income Tax Returns)
Here:
$37,100
State:
$44,591
Salary/wage: $34,629 (reported on 85.3% of returns)
Here:
$34,629
State:
$38,941
(% of AGI for various income ranges: 95.2% for AGIs below $10k, 76.4% for AGIs $10k-25k, 83.1% for AGIs $25k-50k, 81.9% for AGIs $50k-75k, 80.9% for AGIs $75k-100k, 68.7% for AGIs over 100k)
Taxable interest for individuals: $1,527 (reported on 35.0% of returns)
This zip code:
$1,527
Missouri:
$1,801
(% of AGI for various income ranges: 2.9% for AGIs below $10k, 2.1% for AGIs $10k-25k, 1.2% for AGIs $25k-50k, 1.2% for AGIs $50k-75k, 1.5% for AGIs $75k-100k, 1.5% for AGIs over 100k)
Taxable dividends: $1,655 (reported on 17.8% of returns)
Here:
$1,655
State:
$3,677
(% of AGI for various income ranges: 1.4% for AGIs below $10k, 1.0% for AGIs $10k-25k, 0.6% for AGIs $25k-50k, 0.6% for AGIs $50k-75k, 0.6% for AGIs $75k-100k, 1.4% for AGIs over 100k)
Net capital gain/loss: +$3,018 (reported on 12.9% of returns)
Here:
+$3,018
State:
+$8,915
(% of AGI for various income ranges: -1.6% for AGIs below $10k, -0.1% for AGIs $10k-25k, 0.2% for AGIs $25k-50k, 0.3% for AGIs $50k-75k, 0.9% for AGIs $75k-100k, 5.2% for AGIs over 100k)
Profit/loss from business: +$5,755 (reported on 11.8% of returns)
Here:
+$5,755
State:
+$9,793
(% of AGI for various income ranges: 1.4% for AGIs below $10k, 3.2% for AGIs $10k-25k, 1.7% for AGIs $25k-50k, 1.3% for AGIs $50k-75k, 1.7% for AGIs $75k-100k, 2.1% for AGIs over 100k)
Profit/loss from farming: +$786 (reported on 0.2% of returns)
Here:
+$786
State:
-$5,056
IRA payment deduction: $2,462 (reported on 2.0% of returns)
64138:
$2,462
Missouri:
$2,972
(% of AGI for various income ranges: 0.2% for AGIs $10k-25k, 0.2% for AGIs $25k-50k, 0.1% for AGIs $50k-75k, 0.1% for AGIs $75k-100k, 0.1% for AGIs over 100k)
Self-employed pension: $7,889 (reported on 0.2% of returns)
Here:
$7,889
Missouri:
$14,365
Total itemized deductions: $14,305 (24% of AGI, reported on 35.1% of returns)
Here:
$14,305
State:
$18,261
Here:
24.0% of AGI
State:
20.5% of AGI
(% of AGI for various income ranges: 10.0% for AGIs below $10k, 9.3% for AGIs $10k-25k, 13.0% for AGIs $25k-50k, 14.3% for AGIs $50k-75k, 16.0% for AGIs $75k-100k, 14.5% for AGIs over 100k)
Charity contributions deductions: $3,034 (5% of AGI, reported on 30.3% of returns)
Here:
$3,034
State:
$3,665
Here:
4.9% of AGI
State:
3.9% of AGI
(% of AGI for various income ranges: 0.7% for AGIs below $10k, 1.4% for AGIs $10k-25k, 2.3% for AGIs $25k-50k, 2.5% for AGIs $50k-75k, 3.3% for AGIs $75k-100k, 3.1% for AGIs over 100k)
Total tax: $4,399 (reported on 74.2% of returns)
64138:
$4,399
State:
$6,999
(% of AGI for various income ranges: 2.2% for AGIs below $10k, 3.6% for AGIs $10k-25k, 6.9% for AGIs $25k-50k, 8.9% for AGIs $50k-75k, 10.3% for AGIs $75k-100k, 15.7% for AGIs over 100k)
Earned income credit: $1,712 (reported on 17.9% of returns)
Here:
$1,712
State:
$1,728
Percentage of individuals using paid preparers for their 2004 taxes: 57.5%
Here:
57%
State:
62%
(% for various income ranges: 45.9% for AGIs below $10k, 61.3% for AGIs $10k-25k, 58.7% for AGIs $25k-50k, 60.4% for AGIs $50k-75k, 58.6% for AGIs $75k-100k, 62.9% for AGIs over 100k)
Likely homosexual households (counted as self-reported same-sex unmarried-partner households)
Lesbian couples: 0.1% of all households
Gay men: 0.2% of all households
Household received Food Stamps/SNAP in the past 12 months: 1,286 Household did not receive Food Stamps/SNAP in the past 12 months: 9,268
Women who had a birth in the past 12 months: 225 (161 now married, 62 unmarried) Women who did not have a birth in the past 12 months: 5,668 (1,775 now married, 3,912 unmarried)
Housing units in zip code 64138 with a mortgage: 4,267 (120 second mortgage, 97 both second mortgage and home equity loan) Houses without a mortgage: 72
Median monthly owner costs for units with a mortgage: $1,125 Median monthly owner costs for units without a mortgage: $553
Residents with income below the poverty level in 2022:
This zip code:
14.8%
Whole state:
13.2%
Residents with income below 50% of the poverty level in 2022:
This zip code:
10.5%
Whole state:
6.8%
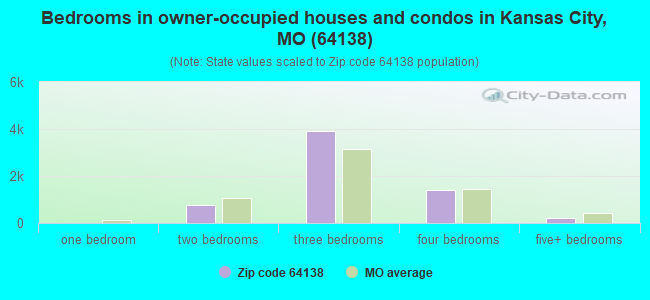
Median number of rooms in houses and condos:
Here:
6.3
State:
6.4
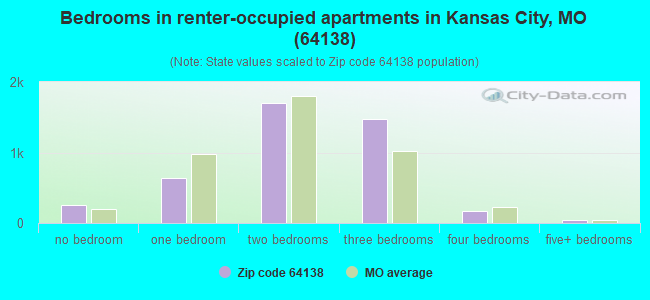
Median number of rooms in apartments:
Here:
4.9
State:
4.4
Notable locations in this zip code not listed on our city pages
Notable locations in zip code 64138: Turner Golf Course (A), Kansas City International Drag Strip (B), Loma Vista East (C), Blue Ridge Branch Mid-Continent Public Library (D), Kansas City Missouri Fire Department Station 43 (E), Kansas City Missouri Fire Department Station 41 (F), Raytown Fire Protection District Station 2 (G). Display/hide their locations on the map
Churches in zip code 64138 include: Spring Valley Baptist Church (A), Southview Baptist Church (B), Saint Pauls Church of the Nazarene (C), Saint Lukes United Methodist Church (D), Saint John Francis Regis Church (E), Restoration International Ministries (F), Grace Fellowship Baptist Church (G), Genesis Missionary Baptist Church (H), Faith Presbyterian Church (I). Display/hide their locations on the map
Cemeteries: Green Lawn Cemetery (1), Memorial Park Cemetery (2), Mount Olivet Cemetery (3), Flanery Cemetery (4), Palestine Cemetery (5). Display/hide their locations on the map
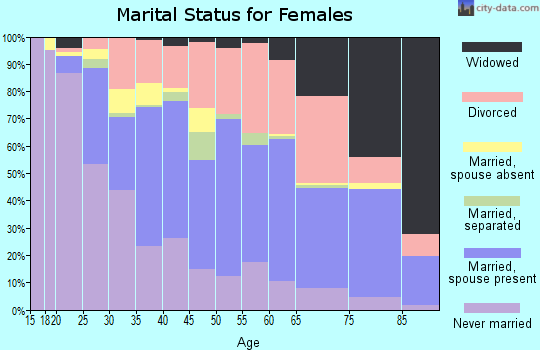
2,724 married couples with children.
1,690 single-parent households (278 men, 1,412 women).
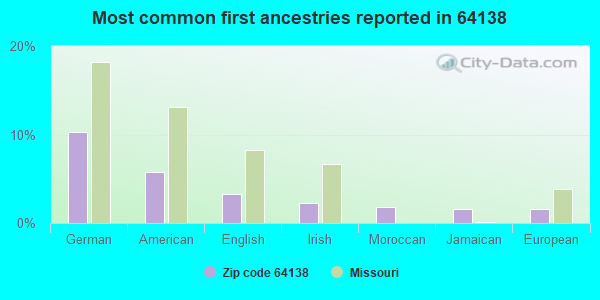
90.8% of residents of 64138 zip code speak English at home.
3.8% of residents speak Spanish at home (65% very well, 20% well, 10% not well, 5% not at all).
1.8% of residents speak other Indo-European language at home (53% very well, 25% well, 20% not well, 2% not at all).
0.7% of residents speak Asian or Pacific Island language at home (45% very well, 46% well, 8% not well).
3.1% of residents speak other language at home (62% very well, 30% well, 8% not well).
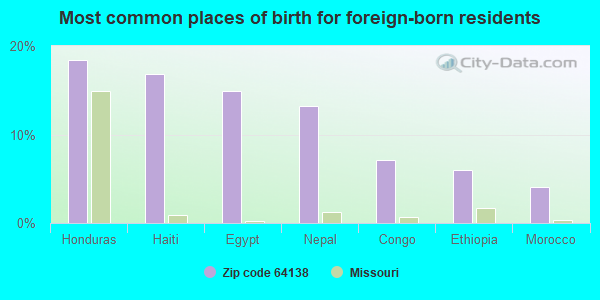
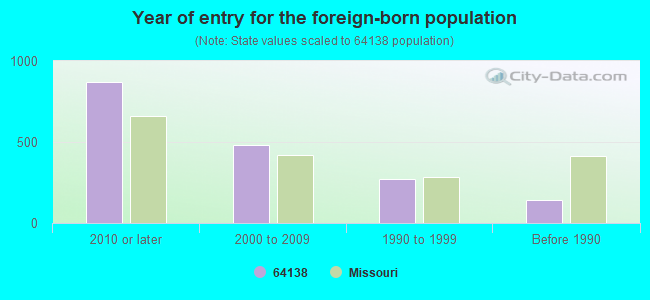
Foreign born population: 1,623 (6.7%) (39.4% of them are naturalized citizens)
Major facilities with environmental interests located in this zip code:
AQUILA (10700 EAST 350 HIGHWAY in KANSAS CITY, MO)
(Integrated Compliance Information System) - ICIS-07-1991-0373, FORMAL ENFORCEMENT ACTION, ICIS-07-1987-0392, STATE MASTER (Missouri monitoring and compilance) - ICIS-2303, ENFORCEMENT/COMPLIANCE ACTIVITY, NCDB-C07#07-93-EX-18, COMPLIANCE ACTIVITY, NCDB-D07#07-91-316, RCRAINFO-MOD006966055, TRANSPORTER, PCS-MOR103775, NPDES NON-MAJOR COMPLIANCE ACTIVITY (Tracking inspections of insecticide, fungicide, and rodenticide, and toxic substances) TRANSPORTER (Resource Conservation and Recovery Act (tracking hazardous waste)) Business SIC classification: HEAVY CONSTRUCTION; ELECTRIC AND OTHER SERVICES COMBINED Organizations: MISSOURI PUBLIC SERVICE COMPANY (CONTACT/OWNER)
Alternative names: MISSOURI PUBLIC SERVICE, PLEASANT HILL SUBSTATION
PETE FRANKLIN'S NATL AUTO SALES (6300 3 87TH ST in KANSAS CITY, MO)
(Integrated Compliance Information System) - ICIS-07-1999-0094, FORMAL ENFORCEMENT ACTION STATE MASTER (Missouri monitoring and compilance) - ICIS-25540, ENFORCEMENT/COMPLIANCE ACTIVITY Alternative names: PETE FRANKLIN S NATL AUTO SALES
PHILLIPS PINEWOOD MULCH, INC (10600 E 350 HWY in RAYTOWN, MO)
(Integrated Compliance Information System) - ICIS-07-2002-0107, FORMAL ENFORCEMENT ACTION STATE MASTER (Missouri monitoring and compilance) - ICIS-2213, ENFORCEMENT/COMPLIANCE ACTIVITY
PRIDE CLEANERS BLUE RIDGE (9406 BLUE RIDGE ROAD in KANSAS CITY, MO)
AIR MINOR (AIRS/AFS) STATE MASTER (Missouri monitoring and compilance) - AIRS/AFS-MO0941215, AIR MINOR, RCRAINFO-MOD981499791, NOT IN A UNIVERSE (Resource Conservation and Recovery Act (tracking hazardous waste)) Business SIC classification: DRYCLEANING PLANTS, EXCEPT RUG CLEANING Organizations: JEFFSON INDUSTRIES INC (CONTACT/OWNER)
Alternative names: ROYAL CLEANERS
PRIDE CLEANERS RAYTOWN ROAD (7542 RAYTOWN ROAD in RAYTOWN, MO)
AIR MINOR (AIRS/AFS) STATE MASTER (Missouri monitoring and compilance) - AIRS/AFS-MO0953991, AIR MINOR, RCRAINFO-MOD981720642, NOT IN A UNIVERSE (Resource Conservation and Recovery Act (tracking hazardous waste)) Business SIC classification: DRYCLEANING PLANTS, EXCEPT RUG CLEANING Organizations: BARRY JAMES (CONTACT/OWNER)
Alternative names: PARKWAY NO 1038
PETE FRANKLINS NATIONAL AUTO SALES (6300 EAST 87TH STREET in KANSAS CITY, MO)
AIR MINOR (AIRS/AFS) STATE MASTER (Missouri monitoring and compilance) - AIRS/AFS-MO0964193, AIR MINOR, RCRAINFO-MOD108596081, SQG Small Quantity Generators, between 100 kg and 1000 kg of hazardous waste/month (Resource Conservation and Recovery Act (tracking hazardous waste)) - notification Business SIC classification: AUTOMOTIVE REPAIR SHOPS Organizations: FORD MOTOR CO (CONTACT/OWNER)
, F & C INVESTMENT LLC (CONTACT/OWNER)
Alternative names: PETE FRANKLIN AUTO SALES
AMOCO OIL SS #8519 (10001 E HWY 350 in RAYTOWN, MO)
STATE MASTER (Missouri monitoring and compilance) - RCRAINFO-MOD985809128, NOT IN A UNIVERSE (Resource Conservation and Recovery Act (tracking hazardous waste)) Organizations: AMOCO OIL CO (CONTACT/OPERATOR)
PITCHERS LOMA VISTA 66 (8812 BLUE RIDGE in KANSAS CITY, MO)
STATE MASTER (Missouri monitoring and compilance) - RCRAINFO-MOD048257554, NOT IN A UNIVERSE (Resource Conservation and Recovery Act (tracking hazardous waste)) Organizations: PITCHER,NEAL (CONTACT/OWNER)
ADAMS TOYOTA RAYTOWN INC (11900 E 350 HWY in RAYTOWN, MO)
STATE MASTER (Missouri monitoring and compilance) - RCRAINFO-MOD054085816, NOT IN A UNIVERSE (Resource Conservation and Recovery Act (tracking hazardous waste)) Organizations: E RAY ADAMS (CONTACT/OWNER)
AMOCO OIL SS #8717 (8651 HILLCREST RD in KANSAS CITY, MO)
STATE MASTER (Missouri monitoring and compilance) - RCRAINFO-MOD985799576, SQG (Resource Conservation and Recovery Act (tracking hazardous waste)) Organizations: RALPH H & NANCY P DUGGINS (CONTACT/OWNER)
AUTO COLLISION & THEFT REPAIR INC (10008 E 350 HWY in RAYTOWN, MO)
STATE MASTER (Missouri monitoring and compilance) - RCRAINFO-MOD985822097, NOT IN A UNIVERSE (Resource Conservation and Recovery Act (tracking hazardous waste)) Organizations: JOHN OR JAY MESSICK (CONTACT/OWNER)
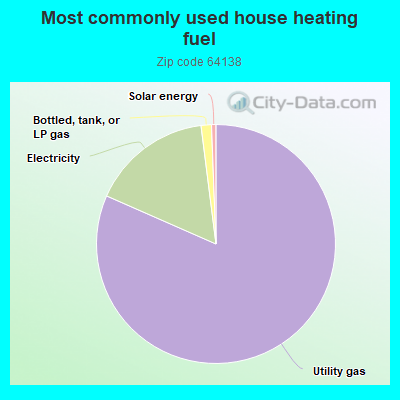
Housing units lacking complete plumbing facilities: 0.1% Housing units lacking complete kitchen facilities: 0.7%
81.6%Utility gas
16.4%Electricity
1.4%Bottled, tank, or LP gas
0.6%Solar energy
Population in 1990: 25,590.
Place of birth for U.S.-born residents:
This state: 15,353
Northeast: 234
Midwest: 3,430
South: 2,458
West: 1,043
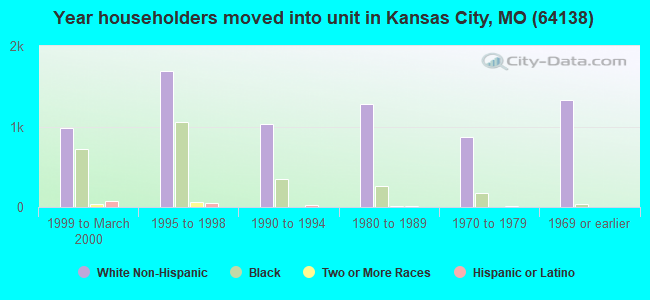
56% of the 64138 zip code residents lived in the same house 5 years ago. Out of people who lived in different houses, 69% lived in this county. Out of people who lived in different counties, 50% lived in Missouri.
89% of the 64138 zip code residents lived in the same house 1 year ago. Out of people who lived in different houses, 66% moved from this county. Out of people who lived in different houses, 6% moved from different county within same state. Out of people who lived in different houses, 22% moved from different state. Out of people who lived in different houses, 4% moved from abroad.
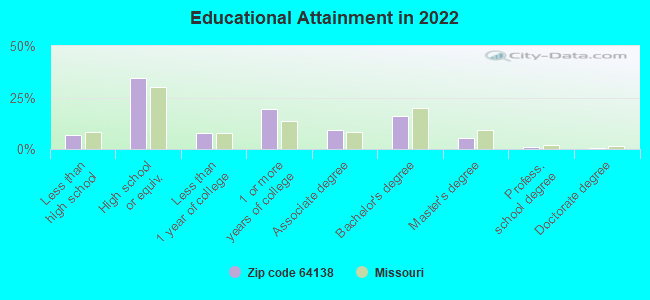
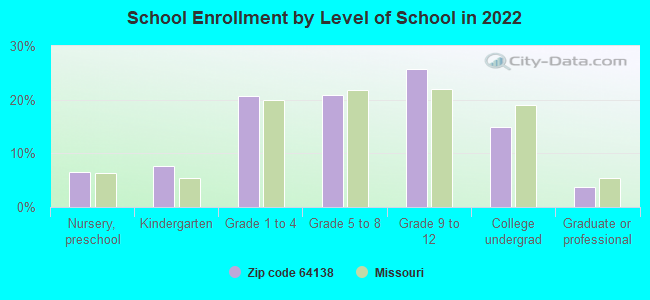
Private vs. public school enrollment:
Students in private schools in grades 1 to 8 (elementary and middle school): 262
Here:
12.7%
Missouri:
15.4%
Students in private schools in grades 9 to 12 (high school): 136
Here:
10.7%
Missouri:
13.9%
Students in private undergraduate colleges: 156
Here:
20.9%
Missouri:
22.6%
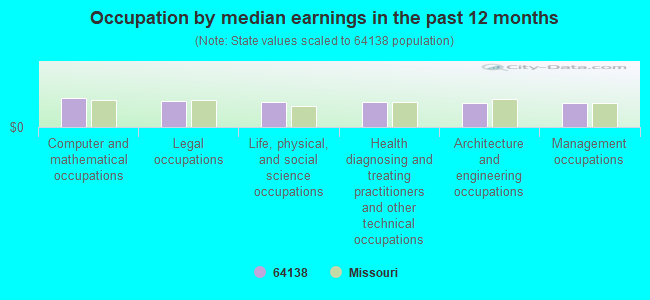
Occupation by median earnings in the past 12 months ($)
70,592Computer and mathematical occupations
63,059Legal occupations
59,950Life, physical, and social science occupations
59,350Health diagnosing and treating practitioners and other technical occupations
58,585Architecture and engineering occupations
57,144Management occupations
Companies with federal contracts located in this zip code (KANSAS CITY, MO):
AQUILA, INC (10750 E 350 HWY; small business) : $14,989,870 in 58 contractsfrom 1999 to 2005
Contracts for Electric Services, Gas Services, Maintenance, Repair or Alteration of Real Property -- EPG Facilities - Other, Including Transmission, Maintenance, Repair and Rebuilding of Equipment -- Fuels, Lubricants, Oils, and Waxes, and moreby Air Force Signed by year:2000: $3,517,620; 2001: $3,657,309; 2002: $4,035,550; 2003: $2,687,146; 2004: $287,665; 2005: $16,374; 2006: $0.
Biggest contracts:
$470,051 with Air Force for Electric Services. Signed on 2003-09-10. Completion date: 2003-09-30.
$460,795, same as above.Signed on 2000-05-04. Completion date: 2000-05-04.
$460,045, same as above.Signed on 2001-09-11. Completion date: 2001-08-31.
$454,634, same as above.Signed on 2002-09-01. Completion date: 2002-09-17.
SUN AVIATION, INC (10010 E 87TH ST; small business) : $43,400 in 3 contractsin 2003
$21,900 with Army for Automatic Pilot Mechanisms and Airborne Gyro Components. Taking place in OK. Signed on 2003-09-17. Completion date: 2003-10-07.
$21,700 with Army for Antennas, Waveguides, and Related Equipment. Taking place in OK. Signed on 2003-09-24. Completion date: 2003-10-17.
-$200 with Army for Automatic Pilot Mechanisms and Airborne Gyro Components. Taking place in OK. Signed on 2003-09-30. Completion date: 2003-09-30.
SUNSET TOURS INC (7700 IRWIN RD)
$5,206 with Army for Passenger Motor Charter Service. Signed on 2005-04-11. Completion date: 2005-05-02.
LOVANA KAYE ANTLE (7909 E 92ND STREET; small business) : $416 in 2 contractsin 2001
$416 with U.S. Army Corps of Engineers - civil program financing only for Facilities Operations Support Services. Signed on 2001-10-16. Completion date: 2001-10-01.
$0, same as above.Signed on 2001-10-16. Completion date: 2001-10-01.
Top industries in this zip code by the number of employees in 2005:
2004 - 2018 National Fire Incident Reporting System (NFIRS) incidents
Based on the data from the years 2004 - 2018 the average number of fires per year is 51. The highest number of reported fires - 92 took place in 2014, and the least - 20 in 2004. The data has a growing trend.
When looking into fire subcategories, the most incidents belonged to: Structure Fires (48.4%), and Outside Fires (25.1%).
Fire incident types reported to NFIRS in Zip Code 64138


+$786
-$5,056
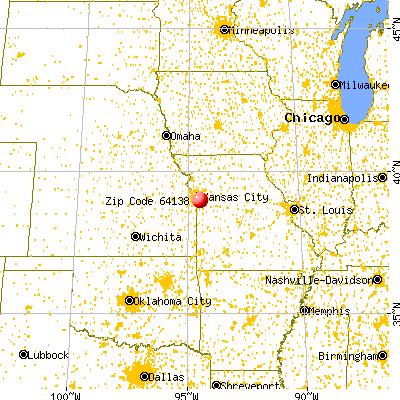
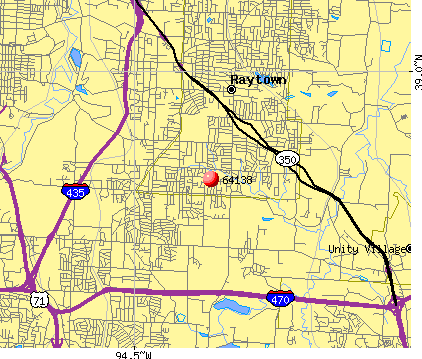 Nearest zip codes: 64134, 64133, 64139, 64192, 64065, 64136.


 Based on the data from the years 2004 - 2018 the average number of fires per year is 51. The highest number of reported fires - 92 took place in 2014, and the least - 20 in 2004. The data has a growing trend.
 When looking into fire subcategories, the most incidents belonged to: Structure Fires (48.4%), and Outside Fires (25.1%).