Estimated zip code population in 2022: 13,048 Zip code population in 2010: 9,257 Zip code population in 2000: 4,636
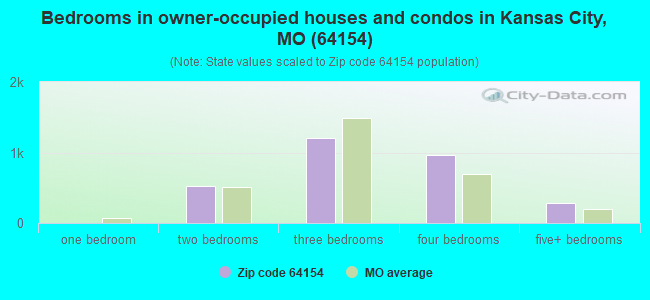
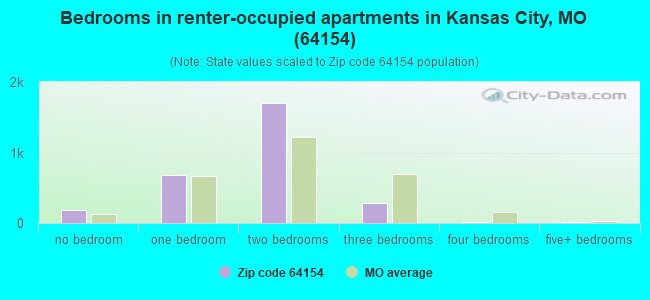
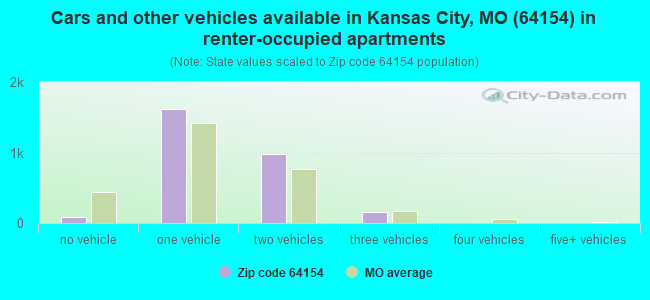
Houses and condos: 6,121 Renter-occupied apartments: 2,857
% of renters here:
49%
State:
32%
March 2022 cost of living index in zip code 64154: 88.5 (less than average, U.S. average is 100)
Land area: 13.9 sq. mi. Water area: 0.0 sq. mi.
Population density: 938 people per square mile
(low).
OSM Map
General Map
Google Map
MSN Map
OSM Map
General Map
Google Map
MSN Map
OSM Map
General Map
Google Map
MSN Map
OSM Map
General Map
Google Map
MSN Map
Please wait while loading the map...
Real estate property taxes paid for housing units in 2022:
This zip code:
1.1% ($3,838)
Missouri:
0.8% ($1,810)
Median real estate property taxes paid for housing units with mortgages in 2022: $3,755 (1.1%) Median real estate property taxes paid for housing units with no mortgage in 2022: $3,987 (1.0%)
Business Search- 14 Million verified businesses
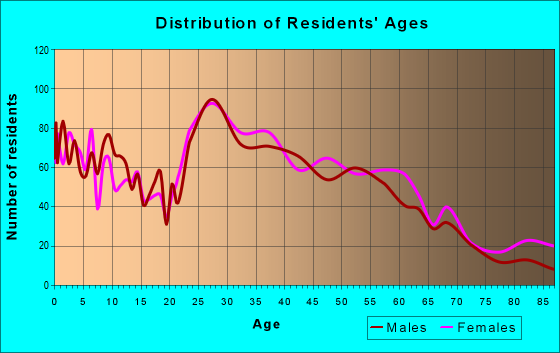
Males: 6,337
(48.6%)
Females: 6,711
(51.4%)
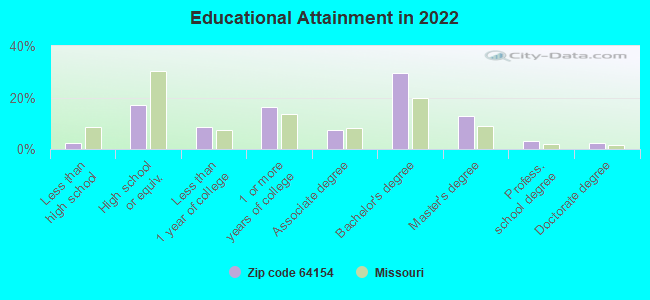
For population 25 years and over in 64154:
High school or higher: 98.3%
Bachelor's degree or higher: 48.4%
Graduate or professional degree: 18.5%
Unemployed: 4.6%
Mean travel time to work (commute): 23.1 minutes
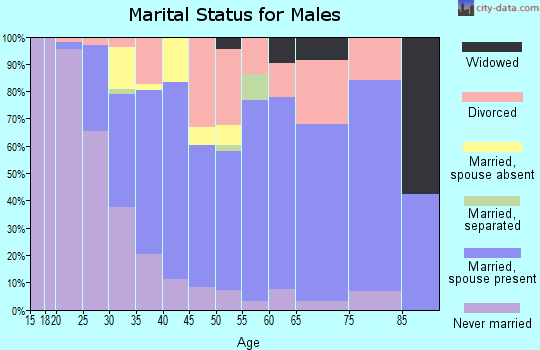
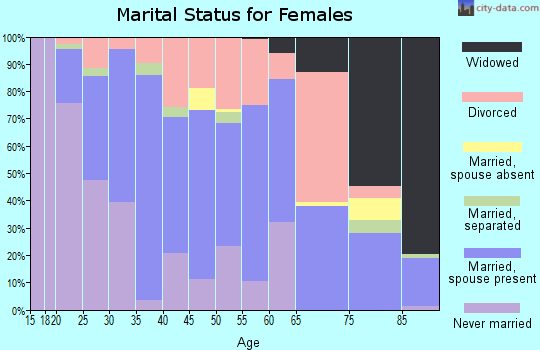
For population 15 years and over in 64154:
Never married: 35.4%
Now married: 49.7%
Separated: 1.1%
Widowed: 4.1%
Divorced: 9.7%
Zip code 64154 compared to state average:
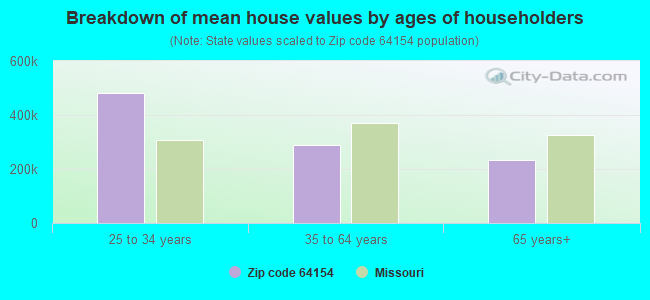
Median house value above state average.
Median age below state average.
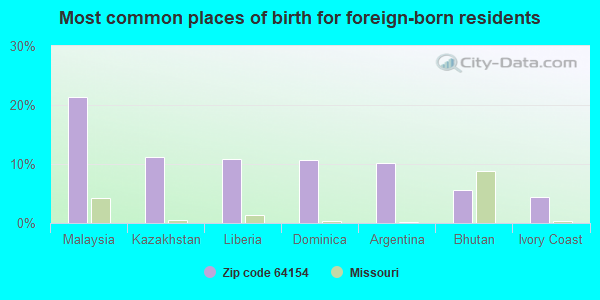
Foreign-born population percentage significantly above state average.
Renting percentage above state average.
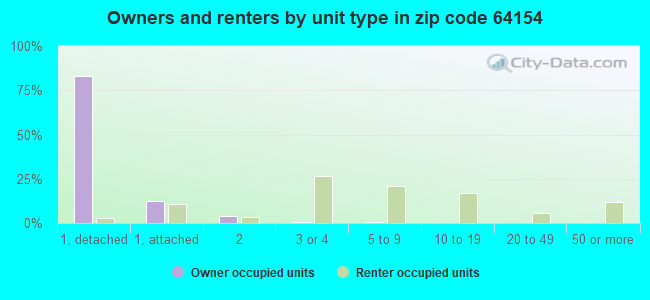
House age significantly below state average.
Percentage of population with a bachelor's degree or higher above state average.
Estimated median house/condo value in 2022: $359,755
64154:
$359,755
Missouri:
$221,200
According to our research of Missouri and other state lists, there were 10 registered sex offenders living in 64154 zip code as of April 28, 2024. The ratio of all residents to sex offenders in zip code 64154 is 1,028 to 1. The ratio of registered sex offenders to all residents in this zip code is much lower than the state average.
Median resident age:
This zip code:
35.1 years
Missouri median age:
39.1 years
Average household size:
This zip code:
2.2 people
Missouri:
2.4 people
Averages for the 2020 tax year for zip code 64154, filed in 2021:
Average Adjusted Gross Income (AGI) in 2020: $83,530 (Individual Income Tax Returns)
Here:
$83,530
State:
$68,151
Salary/wage: $73,372 (reported on 82.8% of returns)
Here:
$73,372
State:
$56,131
(% of AGI for various income ranges: 1257.8% for AGIs below $25k, 3686.7% for AGIs $25k-50k, 6622.3% for AGIs $50k-75k, 9136.1% for AGIs $75k-100k, 18586.5% for AGIs $100k-200k, 65871.2% for AGIs over 200k)
Taxable interest for individuals: $1,185 (reported on 36.8% of returns)
This zip code:
$1,185
Missouri:
$1,586
(% of AGI for various income ranges: 22.5% for AGIs below $25k, 23.5% for AGIs $25k-50k, 33.9% for AGIs $50k-75k, 80.7% for AGIs $75k-100k, 130.8% for AGIs $100k-200k, 432.9% for AGIs over 200k)
Ordinary dividends: $5,019 (reported on 23.1% of returns)
Here:
$5,019
State:
$10,947
(% of AGI for various income ranges: 33.3% for AGIs below $25k, 49.1% for AGIs $25k-50k, 63.6% for AGIs $50k-75k, 170.7% for AGIs $75k-100k, 320.8% for AGIs $100k-200k, 1794.1% for AGIs over 200k)
Net capital gain/loss in AGI: +$11,119 (reported on 21.6% of returns)
Here:
+$11,119
State:
+$18,453
(% of AGI for various income ranges: 6.4% for AGIs below $25k, 39.5% for AGIs $25k-50k, 70.5% for AGIs $50k-75k, 167.2% for AGIs $75k-100k, 438.4% for AGIs $100k-200k, 6349.4% for AGIs over 200k)
Profit/loss from business: +$15,435 (reported on 14.4% of returns)
Here:
+$15,435
State:
+$12,260
(% of AGI for various income ranges: 92.7% for AGIs below $25k, 126.2% for AGIs $25k-50k, 178.0% for AGIs $50k-75k, 265.4% for AGIs $75k-100k, 410.9% for AGIs $100k-200k, 3786.5% for AGIs over 200k)
Taxable individual retirement arrangement distribution: $21,917 (reported on 11.6% of returns)
64154:
$21,917
Missouri:
$19,719
(% of AGI for various income ranges: 81.4% for AGIs below $25k, 120.6% for AGIs $25k-50k, 257.8% for AGIs $50k-75k, 516.5% for AGIs $75k-100k, 889.7% for AGIs $100k-200k, 2094.7% for AGIs over 200k)
Self-employed (Keogh) retirement plans: $22,550 (reported on 0.6% of returns)
64154:
$22,550
Missouri:
$24,851
(% of AGI for various income ranges: 530.6% for AGIs over 200k)
Total itemized deductions: $30,704 (reported on 11.0% of returns)
Here:
$30,704
State:
$36,651
(% of AGI for various income ranges: 77.5% for AGIs below $25k, 130.7% for AGIs $25k-50k, 324.2% for AGIs $50k-75k, 659.6% for AGIs $75k-100k, 972.4% for AGIs $100k-200k, 4267.1% for AGIs over 200k)
Charity contributions: $9,319 (reported on 8.9% of returns)
Here:
$9,319
State:
$15,671
(% of AGI for various income ranges: 29.4% for AGIs $25k-50k, 43.0% for AGIs $50k-75k, 135.4% for AGIs $75k-100k, 254.6% for AGIs $100k-200k, 1354.1% for AGIs over 200k)
Taxes paid: $8,343 (reported on 10.9% of returns)
64154:
$8,343
State:
$7,608
(% of AGI for various income ranges: 11.5% for AGIs below $25k, 26.0% for AGIs $25k-50k, 79.2% for AGIs $50k-75k, 214.6% for AGIs $75k-100k, 328.6% for AGIs $100k-200k, 907.6% for AGIs over 200k)
Earned income credit: $2,171 (reported on 9.4% of returns)
Here:
$2,171
State:
$2,315
(% of AGI for various income ranges: 68.1% for AGIs below $25k, 45.2% for AGIs $25k-50k)
Percentage of individuals using paid preparers for their 2020 taxes: 94.6%
Here:
95%
State:
93%
(% for various income ranges: 92.3% for AGIs below $25k, 93.2% for AGIs $25k-50k, 96.1% for AGIs $50k-75k, 95.6% for AGIs $75k-100k, 96.1% for AGIs $100k-200k, 97.8% for AGIs over 200k)
Averages for the 2012 tax year for zip code 64154, filed in 2013:
Average Adjusted Gross Income (AGI) in 2012: $70,803 (Individual Income Tax Returns)
Here:
$70,803
State:
$55,896
Salary/wage: $62,228 (reported on 85.5% of returns)
Here:
$62,228
State:
$46,205
(% of AGI for various income ranges: 75.3% for AGIs below $25k, 81.0% for AGIs $25k-50k, 78.9% for AGIs $50k-75k, 79.6% for AGIs $75k-100k, 79.7% for AGIs $100k-200k, 61.5% for AGIs over 200k)
Taxable interest for individuals: $1,295 (reported on 36.7% of returns)
This zip code:
$1,295
Missouri:
$1,559
(% of AGI for various income ranges: 1.6% for AGIs below $25k, 0.7% for AGIs $25k-50k, 0.8% for AGIs $50k-75k, 0.8% for AGIs $75k-100k, 0.4% for AGIs $100k-200k, 0.6% for AGIs over 200k)
Ordinary dividends: $5,202 (reported on 21.1% of returns)
Here:
$5,202
State:
$7,410
(% of AGI for various income ranges: 1.3% for AGIs below $25k, 1.0% for AGIs $25k-50k, 1.0% for AGIs $50k-75k, 0.8% for AGIs $75k-100k, 1.1% for AGIs $100k-200k, 3.2% for AGIs over 200k)
Net capital gain/loss in AGI: +$6,703 (reported on 17.4% of returns)
Here:
+$6,703
State:
+$11,579
(% of AGI for various income ranges: 0.6% for AGIs $75k-100k, 1.3% for AGIs $100k-200k, 5.0% for AGIs over 200k)
Profit/loss from business: +$13,184 (reported on 12.1% of returns)
Here:
+$13,184
State:
+$11,688
(% of AGI for various income ranges: 5.1% for AGIs below $25k, 2.6% for AGIs $25k-50k, 1.7% for AGIs $50k-75k, 1.4% for AGIs $75k-100k, 2.2% for AGIs $100k-200k, 2.4% for AGIs over 200k)
Taxable individual retirement arrangement distribution: $15,860 (reported on 11.6% of returns)
64154:
$15,860
Missouri:
$14,773
(% of AGI for various income ranges: 4.5% for AGIs below $25k, 2.8% for AGIs $25k-50k, 3.3% for AGIs $50k-75k, 3.4% for AGIs $75k-100k, 2.5% for AGIs $100k-200k, 1.4% for AGIs over 200k)
Self-employment retirement plans: $25,250 (reported on 0.4% of returns)
64154:
$25,250
Missouri:
$20,502
Total itemized deductions: $24,750 (21% of AGI, reported on 42.0% of returns)
Here:
$24,750
State:
$22,730
Here:
20.7% of AGI
State:
19.2% of AGI
(% of AGI for various income ranges: 10.8% for AGIs below $25k, 9.8% for AGIs $25k-50k, 12.7% for AGIs $50k-75k, 14.5% for AGIs $75k-100k, 16.6% for AGIs $100k-200k, 17.0% for AGIs over 200k)
Charity contributions: $4,405 (reported on 34.1% of returns)
Here:
$4,405
State:
$4,745
(% of AGI for various income ranges: 0.9% for AGIs below $25k, 1.2% for AGIs $25k-50k, 1.2% for AGIs $50k-75k, 1.7% for AGIs $75k-100k, 2.2% for AGIs $100k-200k, 3.6% for AGIs over 200k)
Taxes paid: $10,266 (reported on 41.5% of returns)
64154:
$10,266
State:
$8,399
(% of AGI for various income ranges: 1.9% for AGIs below $25k, 2.6% for AGIs $25k-50k, 4.3% for AGIs $50k-75k, 5.8% for AGIs $75k-100k, 7.7% for AGIs $100k-200k, 7.8% for AGIs over 200k)
Earned income credit: $2,024 (reported on 11.0% of returns)
Here:
$2,024
State:
$2,288
(% of AGI for various income ranges: 4.2% for AGIs below $25k, 0.8% for AGIs $25k-50k)
Percentage of individuals using paid preparers for their 2012 taxes: 51.2%
Here:
51%
State:
55%
(% for various income ranges: 45.1% for AGIs below $25k, 46.7% for AGIs $25k-50k, 52.8% for AGIs $50k-75k, 56.6% for AGIs $75k-100k, 58.6% for AGIs $100k-200k, 72.2% for AGIs over 200k)
Averages for the 2004 tax year for zip code 64154, filed in 2005:
Average Adjusted Gross Income (AGI) in 2004: $55,135 (Individual Income Tax Returns)
Here:
$55,135
State:
$44,591
Salary/wage: $52,372 (reported on 85.9% of returns)
Here:
$52,372
State:
$38,941
(% of AGI for various income ranges: 187.9% for AGIs below $10k, 79.7% for AGIs $10k-25k, 83.7% for AGIs $25k-50k, 79.9% for AGIs $50k-75k, 83.6% for AGIs $75k-100k, 79.4% for AGIs over 100k)
Taxable interest for individuals: $1,549 (reported on 45.9% of returns)
This zip code:
$1,549
Missouri:
$1,801
(% of AGI for various income ranges: 10.9% for AGIs below $10k, 3.9% for AGIs $10k-25k, 1.7% for AGIs $25k-50k, 1.3% for AGIs $50k-75k, 1.0% for AGIs $75k-100k, 0.7% for AGIs over 100k)
Taxable dividends: $2,497 (reported on 26.0% of returns)
Here:
$2,497
State:
$3,677
(% of AGI for various income ranges: 9.8% for AGIs below $10k, 1.5% for AGIs $10k-25k, 0.8% for AGIs $25k-50k, 1.1% for AGIs $50k-75k, 1.0% for AGIs $75k-100k, 1.2% for AGIs over 100k)
Net capital gain/loss: +$6,214 (reported on 23.2% of returns)
Here:
+$6,214
State:
+$8,915
(% of AGI for various income ranges: -7.8% for AGIs below $10k, 0.3% for AGIs $10k-25k, 0.2% for AGIs $25k-50k, 0.6% for AGIs $50k-75k, 1.0% for AGIs $75k-100k, 5.5% for AGIs over 100k)
Profit/loss from business: +$10,123 (reported on 13.1% of returns)
Here:
+$10,123
State:
+$9,793
(% of AGI for various income ranges: 10.5% for AGIs below $10k, 1.6% for AGIs $10k-25k, 1.6% for AGIs $25k-50k, 2.3% for AGIs $50k-75k, 2.4% for AGIs $75k-100k, 2.8% for AGIs over 100k)
IRA payment deduction: $2,824 (reported on 2.2% of returns)
64154:
$2,824
Missouri:
$2,972
(% of AGI for various income ranges: 0.1% for AGIs $10k-25k, 0.2% for AGIs $25k-50k, 0.1% for AGIs $50k-75k, 0.2% for AGIs $75k-100k, 0.1% for AGIs over 100k)
Self-employed pension: $12,474 (reported on 0.6% of returns)
Here:
$12,474
Missouri:
$14,365
Total itemized deductions: $20,882 (22% of AGI, reported on 41.2% of returns)
Here:
$20,882
State:
$18,261
Here:
21.9% of AGI
State:
20.5% of AGI
(% of AGI for various income ranges: 21.2% for AGIs below $10k, 10.4% for AGIs $10k-25k, 10.3% for AGIs $25k-50k, 16.0% for AGIs $50k-75k, 19.5% for AGIs $75k-100k, 16.8% for AGIs over 100k)
Charity contributions deductions: $3,308 (3% of AGI, reported on 36.2% of returns)
Here:
$3,308
State:
$3,665
Here:
3.3% of AGI
State:
3.9% of AGI
(% of AGI for various income ranges: 1.3% for AGIs below $10k, 1.3% for AGIs $10k-25k, 1.0% for AGIs $25k-50k, 2.1% for AGIs $50k-75k, 2.3% for AGIs $75k-100k, 2.8% for AGIs over 100k)
Total tax: $8,283 (reported on 82.8% of returns)
64154:
$8,283
State:
$6,999
(% of AGI for various income ranges: 5.9% for AGIs below $10k, 4.4% for AGIs $10k-25k, 7.8% for AGIs $25k-50k, 9.8% for AGIs $50k-75k, 10.4% for AGIs $75k-100k, 17.5% for AGIs over 100k)
Earned income credit: $1,585 (reported on 9.5% of returns)
Here:
$1,585
State:
$1,728
Percentage of individuals using paid preparers for their 2004 taxes: 57.9%
Here:
58%
State:
62%
(% for various income ranges: 47.5% for AGIs below $10k, 57.3% for AGIs $10k-25k, 59.2% for AGIs $25k-50k, 60.9% for AGIs $50k-75k, 59.1% for AGIs $75k-100k, 62.7% for AGIs over 100k)
Likely homosexual households (counted as self-reported same-sex unmarried-partner households)
Lesbian couples: 1.1% of all households
Gay men: 0.0% of all households
Household received Food Stamps/SNAP in the past 12 months: 124 Household did not receive Food Stamps/SNAP in the past 12 months: 5,718
Women who had a birth in the past 12 months: 220 (197 now married, 15 unmarried) Women who did not have a birth in the past 12 months: 3,380 (1,218 now married, 2,168 unmarried)
Housing units in zip code 64154 with a mortgage: 2,068 (100 second mortgage, 74 both second mortgage and home equity loan) Houses without a mortgage: 11
Median monthly owner costs for units with a mortgage: $1,819 Median monthly owner costs for units without a mortgage: $809
Residents with income below the poverty level in 2022:
This zip code:
6.4%
Whole state:
13.2%
Residents with income below 50% of the poverty level in 2022:
This zip code:
0.5%
Whole state:
6.8%
Median number of rooms in houses and condos:
Here:
6.8
State:
6.4
Median number of rooms in apartments:
Here:
3.9
State:
4.4
Notable locations in this zip code not listed on our city pages
In group quarters: 119 (-1 institutionalized population)
Size of family households: 1,645 2-persons, 714 3-persons, 581 4-persons, 243 5-persons, 83 6-persons, 77 7-or-more-persons
Size of nonfamily households: 1,733 1-person, 643 2-persons, 113 3-persons
1,790 married couples with children.
656 single-parent households (137 men, 519 women).
87.5% of residents of 64154 zip code speak English at home.
4.0% of residents speak Spanish at home (74% very well, 18% well, 5% not well, 3% not at all).
2.8% of residents speak other Indo-European language at home (49% very well, 39% well, 12% not well).
2.4% of residents speak Asian or Pacific Island language at home (63% very well, 36% well, 1% not well).
3.3% of residents speak other language at home (82% very well, 11% well, 7% not well).
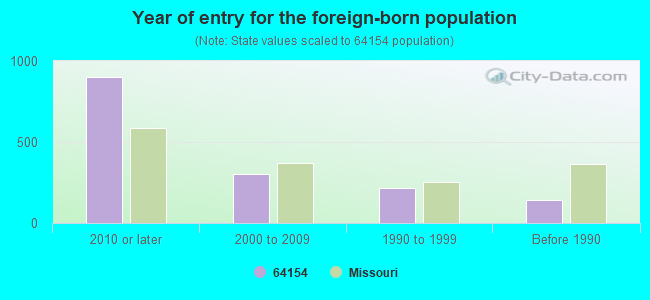
Foreign born population: 1,246 (9.6%) (59.5% of them are naturalized citizens)
Major facilities with environmental interests located in this zip code:
QUALITY CLEANERS KANSAS CITY (5557 NW BARRY ROAD in KANSAS CITY, MO)
AIR MINOR (AIRS/AFS) STATE MASTER (Missouri monitoring and compilance) - AIRS/AFS-MO0941354, AIR MINOR, RCRAINFO-MOD985798107, SQG, NEI-NTI34511, AIR PROGRAM, NTI-NTI34511, CRITERIA AND HAZARDOUS AIR POLLUTANT INVENTORY (Inventory of air pollution sources) Small Quantity Generators, between 100 kg and 1000 kg of hazardous waste/month (Resource Conservation and Recovery Act (tracking hazardous waste)) - notification Business SIC classification: DRYCLEANING PLANTS, EXCEPT RUG CLEANING Business NAICS classification: DRYCLEANING AND LAUNDRY SERVICES (EXCEPT COIN-OPERATED). Organizations: KIL YOU (CONTACT/OPERATOR)
, JOSEPH JEFFERS (CONTACT/OWNER)
RENAISSANCE IN THE NORTHLAND (N INDIANA & NE 80TH STREET in KANSAS CITY, MO)
(Integrated Compliance Information System) - ICIS-07-2003-0320, FORMAL ENFORCEMENT ACTION, ICIS-07-2003-0344, STATE MASTER (Missouri monitoring and compilance) - ICIS-5869013, ENFORCEMENT/COMPLIANCE ACTIVITY
BARRY PLAZA DEVELOPMENT GROUP (4400 NORTHWEST BARRY ROAD in KANSAS CITY, MO)
STATE MASTER (Missouri monitoring and compilance) - PCS-MOR100I70, NPDES NON-MAJOR National Pollutant Discharge Elimination System NON-MAJOR (Tracking pollutant discharge elimination systems) - permit Business SIC classification: HEAVY CONSTRUCTION Alternative names: BARRY PLAZA - 2ND PLAT
BCSW INC (3725 NE 92ND ST in KANSAS CITY, MO)
STATE MASTER (Missouri monitoring and compilance) - PCS-MOR100I73, NPDES NON-MAJOR National Pollutant Discharge Elimination System NON-MAJOR (Tracking pollutant discharge elimination systems) - permit Business SIC classification: HEAVY CONSTRUCTION Organizations: BCSW, INC. (CONTACT/OWNER)
Alternative names: ESSEX GARDENS 1 ST PLAT
POST HILL GREENS LLC (NW 97TH ST/NW SKYVIEW AVE in KANSAS CITY, MO)
STATE MASTER (Missouri monitoring and compilance) - PCS-MOR109699, NPDES NON-MAJOR National Pollutant Discharge Elimination System NON-MAJOR (Tracking pollutant discharge elimination systems) - permit Business SIC classification: HEAVY CONSTRUCTION Alternative names: POST HILL SUBD LOTS 12-20
CITY OF KANSAS CITY ROBINHOOD LANE (ROADSIDE AT 11000 NORTH ROBINH in KANSAS CITY, MO)
STATE MASTER (Missouri monitoring and compilance) - RCRAINFO-MOP000024745, NOT IN A UNIVERSE (Resource Conservation and Recovery Act (tracking hazardous waste)) Organizations: CITY OF KANSAS CITY MISSOURI (CONTACT/OWNER)
Alternative names: KANSAS CITY CITY OF
EVERYDAY STORE #4100 (3921 NW BARRY RD in KANSAS CITY, MO)
STATE MASTER (Missouri monitoring and compilance) - RCRAINFO-MOP000039206, NOT IN A UNIVERSE (Resource Conservation and Recovery Act (tracking hazardous waste)) Organizations: DUKE & LONG DISTRIBUTING CO INC (CONTACT/OWNER)
QUAIL RUN APARTMENTS (8504 N COSBY in KANSAS CITY, MO)
AIR MINOR (AIRS/AFS) STATE MASTER (Missouri monitoring and compilance) - AIRS/AFS-MO1008476, AIR MINOR Business SIC classification: OPERATORS OF APARTMENT BUILDINGS
BETTY WADE (5200 NORTHWEST 85TH STREET in KANSAS CITY, MO)
STATE MASTER (Missouri monitoring and compilance) - NCDB-C07#20030320N70212C, COMPLIANCE ACTIVITY COMPLIANCE ACTIVITY (Tracking inspections of insecticide, fungicide, and rodenticide, and toxic substances)
BARRY PLAZA PHASE 3 (8690 N GREEN HILLS RD in KANSAS CITY, MO)
National Pollutant Discharge Elimination System NON-MAJOR (Tracking pollutant discharge elimination systems) - permit Business SIC classification: HEAVY CONSTRUCTION Organizations: BARRY PLAZA DEVELOPMENT G (CONTACT/OWNER)
Alternative names: BARRY PLAZA DEVELOPMENT G
FUJI PHOTO FILM USA INC EMBASSY SUITES (7640 NW TIFFANY SPRINGS PKWY in KANSAS CITY, MO)
(Resource Conservation and Recovery Act (tracking hazardous waste))
ARBOR DEVELOPMENT LLC (9001 N BRITT AVENUE in KANSAS CITY, MO)
National Pollutant Discharge Elimination System NON-MAJOR (Tracking pollutant discharge elimination systems) - permit Business SIC classification: HEAVY CONSTRUCTION Alternative names: MANOR HOMES OF ARBORWALK
OAKVIEW 1ST PLAT (9874 N CHERRY ST in KANSAS CITY, MO)
National Pollutant Discharge Elimination System NON-MAJOR (Tracking pollutant discharge elimination systems) - permit Business SIC classification: HEAVY CONSTRUCTION Organizations: TROPHY HOMES (CONTACT/OWNER)
Alternative names: TROPHY HOMES
Housing units lacking complete kitchen facilities: 0.3%
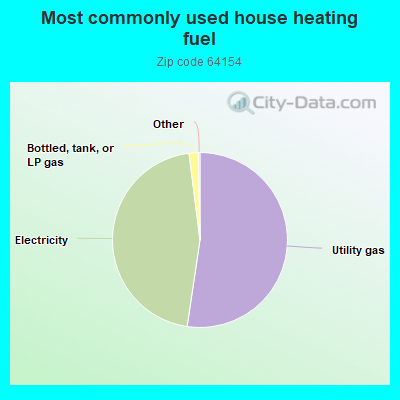
52.3%Utility gas
45.6%Electricity
1.7%Bottled, tank, or LP gas
Population in 1990: 3,379. Population change in the 1990s: +1,257 (+37.2%).
Place of birth for U.S.-born residents:
This state: 5,771
Northeast: 639
Midwest: 3,350
South: 1,060
West: 724
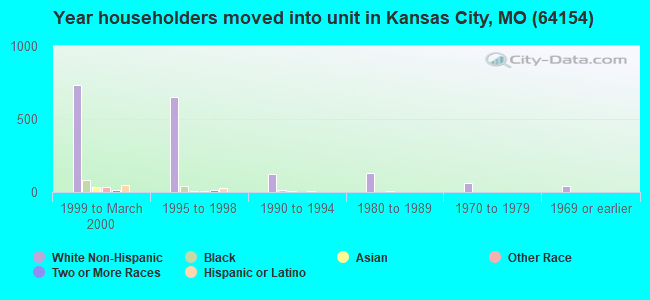
26% of the 64154 zip code residents lived in the same house 5 years ago. Out of people who lived in different houses, 17% lived in this county. Out of people who lived in different counties, 50% lived in Missouri.
80% of the 64154 zip code residents lived in the same house 1 year ago. Out of people who lived in different houses, 48% moved from this county. Out of people who lived in different houses, 31% moved from different county within same state. Out of people who lived in different houses, 18% moved from different state. Out of people who lived in different houses, 1% moved from abroad.
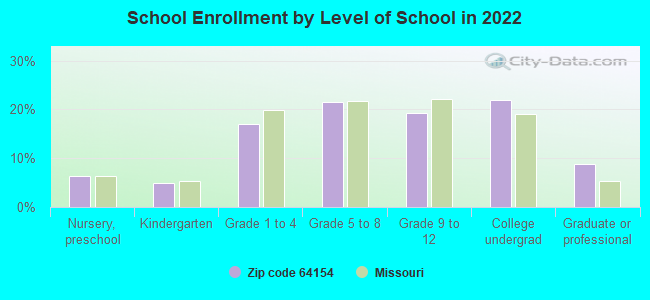
Private vs. public school enrollment:
Students in private schools in grades 1 to 8 (elementary and middle school): 154
Here:
14.9%
Missouri:
15.4%
Students in private schools in grades 9 to 12 (high school): 86
Here:
16.7%
Missouri:
13.9%
Students in private undergraduate colleges: 237
Here:
40.7%
Missouri:
22.6%
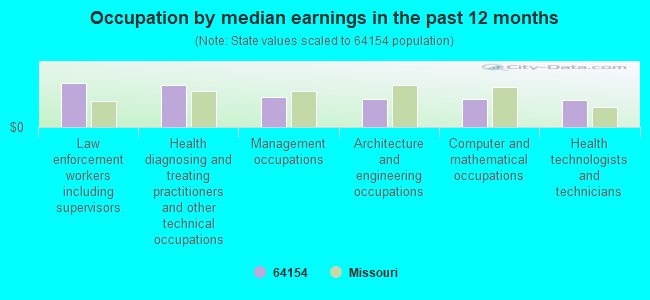
Occupation by median earnings in the past 12 months ($)
121,744Law enforcement workers including supervisors
115,867Health diagnosing and treating practitioners and other technical occupations
82,600Management occupations
78,403Architecture and engineering occupations
78,382Computer and mathematical occupations
75,283Health technologists and technicians
Companies with federal contracts located in this zip code:
THE FLEMING GROUP, LLC (8532 NW OVERLAND DR in KANSAS CITY, MO; small business)
$99,991 with Army for Other Professional Services. Signed on 2003-07-02. Completion date: 2003-10-01.
WALDEN, JOSEPH (5565 NW BARRY RD #110 in KANSAS CITY, MO; small business) : $32,526 in 2 contractsin 2005
$30,026 with Army for Other Administrative Support Services. Taking place in CA. Signed on 2005-04-18. Completion date: 2005-06-30.
$2,500, same as above.Signed on 2005-07-26. Completion date: 2005-06-30.
LOWE'S HOME CENTERS, INC (8601 N BOARDWALK AVENUE in KANSAS CITY, MO; small business)
$5,008 with Army for Lumber and Related Basic Wood Materials. Signed on 2005-09-13. Completion date: 2005-10-12.
Top industries in this zip code by the number of employees in 2005:
Health Care and Social Assistance: General Medical and Surgical Hospitals (500-999 employees: 1 establishment)
2004 - 2018 National Fire Incident Reporting System (NFIRS) incidents
Based on the data from the years 2004 - 2018 the average number of fires per year is 18. The highest number of fire incidents - 34 took place in 2008, and the least - 5 in 2006. The data has a rising trend.
When looking into fire subcategories, the most reports belonged to: Structure Fires (41.6%), and Mobile Property/Vehicle Fires (27.0%).
Fire incident types reported to NFIRS in Zip Code 64154


 Nearest zip codes: 64164, 64155, 64151, 64165, 64163, 64153.
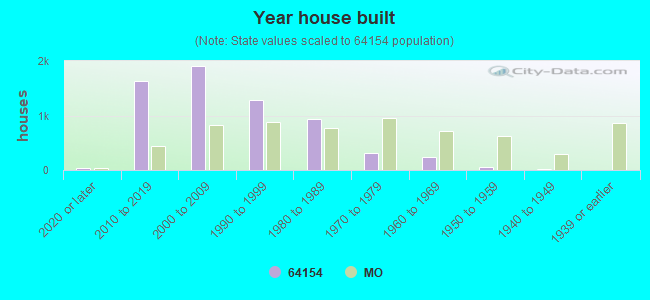


 Based on the data from the years 2004 - 2018 the average number of fires per year is 18. The highest number of fire incidents - 34 took place in 2008, and the least - 5 in 2006. The data has a rising trend.
 When looking into fire subcategories, the most reports belonged to: Structure Fires (41.6%), and Mobile Property/Vehicle Fires (27.0%).