Races in Lenoir, North Carolina (NC) Detailed Stats
Data:
Races - White alone (%)
Races - White alone (% change since 2000)
Races - Black alone (%)
Races - Black alone (% change since 2000)
Races - American Indian alone (%)
Races - American Indian alone (% change since 2000)
Races - Asian alone (%)
Races - Asian alone (% change since 2000)
Races - Hispanic (%)
Races - Hispanic (% change since 2000)
Races - Native Hawaiian and Other Pacific Islander alone (%)
Races - Native Hawaiian and Other Pacific Islander alone (% change since 2000)
Races - Two or more races(%)
Races - Two or more races(% change since 2000)
Races - Other race alone (%)
Races - Other race alone (% change since 2000)
Racial diversity
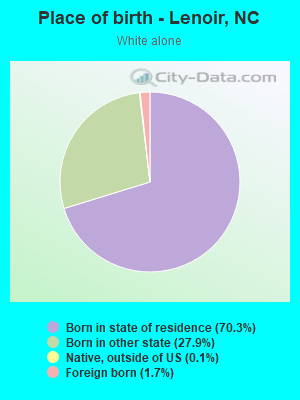
Place of birth - Born in state of residence (%)
Place of birth - Born in state of residence (%) - White
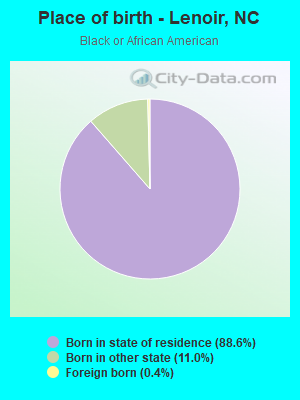
Place of birth - Born in state of residence (%) - Black or African American
Place of birth - Born in state of residence (%) - Asian
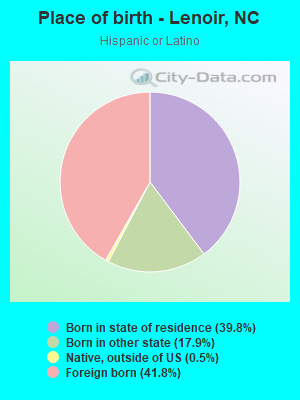
Place of birth - Born in state of residence (%) - Hispanic or Latino
Place of birth - Born in state of residence (%) - American Indian and Alaska Native
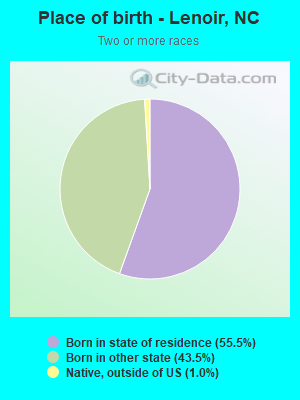
Place of birth - Born in state of residence (%) - Multirace
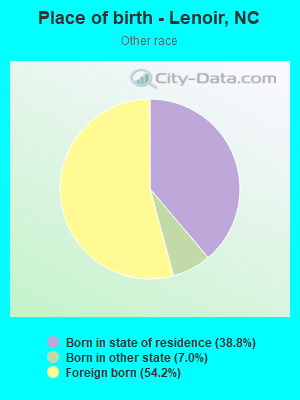
Place of birth - Born in state of residence (%) - Other Race
Place of birth - Born in other state (%)
Place of birth - Born in other state (%) - White
Place of birth - Born in other state (%) - Black or African American
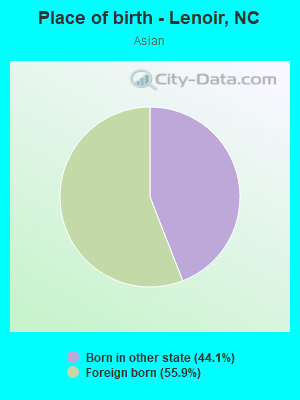
Place of birth - Born in other state (%) - Asian
Place of birth - Born in other state (%) - Hispanic or Latino
Place of birth - Born in other state (%) - American Indian and Alaska Native
Place of birth - Born in other state (%) - Multirace
Place of birth - Born in other state (%) - Other Race
Place of birth - Native, outside of US (%)
Place of birth - Native, outside of US (%) - White
Place of birth - Native, outside of US (%) - Black or African American
Place of birth - Native, outside of US (%) - Asian
Place of birth - Native, outside of US (%) - Hispanic or Latino
Place of birth - Native, outside of US (%) - American Indian and Alaska Native
Place of birth - Native, outside of US (%) - Multirace
Place of birth - Native, outside of US (%) - Other Race
Place of birth - Foreign born (%)
Place of birth - Foreign born (%) - White
Place of birth - Foreign born (%) - Black or African American
Place of birth - Foreign born (%) - Asian
Place of birth - Foreign born (%) - Hispanic or Latino
Place of birth - Foreign born (%) - American Indian and Alaska Native
Place of birth - Foreign born (%) - Multirace
Place of birth - Foreign born (%) - Other Race
Residents speaking English at home (%)
Residents speaking English at home - Born in the United States (%)
Residents speaking English at home - Native, born elsewhere (%)
Residents speaking English at home - Foreign born (%)
Residents speaking Spanish at home (%)
Residents speaking Spanish at home - Born in the United States (%)
Residents speaking Spanish at home - Native, born elsewhere (%)
Residents speaking Spanish at home - Foreign born (%)
Residents speaking other language at home (%)
Residents speaking other language at home - Born in the United States (%)
Residents speaking other language at home - Native, born elsewhere (%)
Residents speaking other language at home - Foreign born (%)
Marital status - Never married (%)
Marital status - Now married (%)
Marital status - Separated (%)
Marital status - Widowed (%)
Marital status - Divorced (%)
Ancestries Reported - Arab (%)
Ancestries Reported - Czech (%)
Ancestries Reported - Danish (%)
Ancestries Reported - Dutch (%)
Ancestries Reported - English (%)
Ancestries Reported - French (%)
Ancestries Reported - French Canadian (%)
Ancestries Reported - German (%)
Ancestries Reported - Greek (%)
Ancestries Reported - Hungarian (%)
Ancestries Reported - Irish (%)
Ancestries Reported - Italian (%)
Ancestries Reported - Lithuanian (%)
Ancestries Reported - Norwegian (%)
Ancestries Reported - Polish (%)
Ancestries Reported - Portuguese (%)
Ancestries Reported - Russian (%)
Ancestries Reported - Scotch-Irish (%)
Ancestries Reported - Scottish (%)
Ancestries Reported - Slovak (%)
Ancestries Reported - Subsaharan African (%)
Ancestries Reported - Swedish (%)
Ancestries Reported - Swiss (%)
Ancestries Reported - Ukrainian (%)
Ancestries Reported - United States (%)
Ancestries Reported - Welsh (%)
Ancestries Reported - West Indian (%)
Ancestries Reported - Other (%)
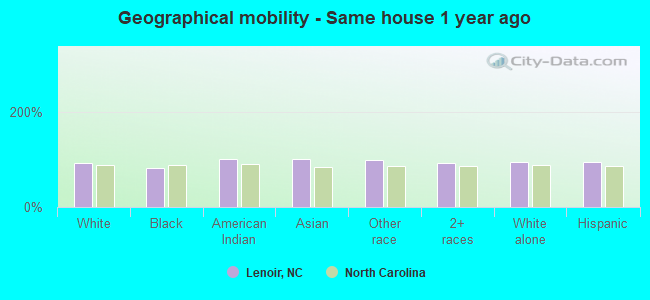
Geographical mobility - Same house 1 year ago (%)
Geographical mobility - Same house 1 year ago (%) - White
Geographical mobility - Same house 1 year ago (%) - Black or African American
Geographical mobility - Same house 1 year ago (%) - Asian
Geographical mobility - Same house 1 year ago (%) - Hispanic or Latino
Geographical mobility - Same house 1 year ago (%) - American Indian and Alaska Native
Geographical mobility - Same house 1 year ago (%) - Multirace
Geographical mobility - Same house 1 year ago (%) - Other Race
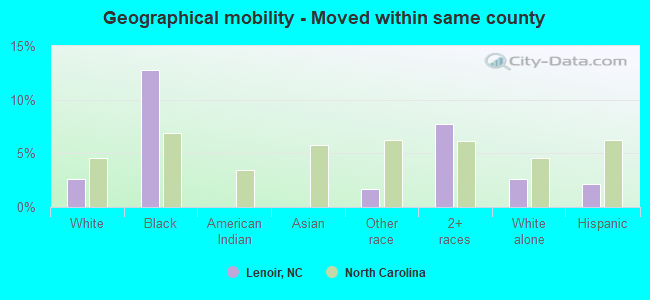
Geographical mobility - Moved within same county (%)
Geographical mobility - Moved within same county (%) - White
Geographical mobility - Moved within same county (%) - Black or African American
Geographical mobility - Moved within same county (%) - Asian
Geographical mobility - Moved within same county (%) - Hispanic or Latino
Geographical mobility - Moved within same county (%) - American Indian and Alaska Native
Geographical mobility - Moved within same county (%) - Multirace
Geographical mobility - Moved within same county (%) - Other Race
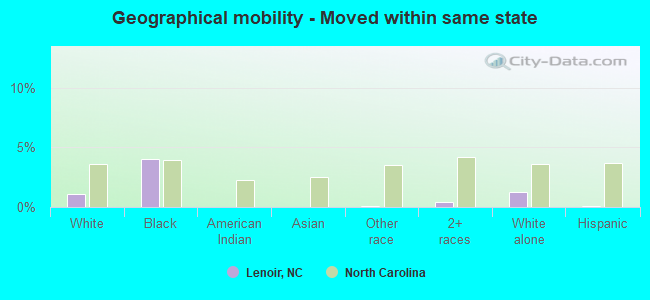
Geographical mobility - Moved from different county within same state (%)
Geographical mobility - Moved from different county within same state (%) - White
Geographical mobility - Moved from different county within same state (%) - Black or African American
Geographical mobility - Moved from different county within same state (%) - Asian
Geographical mobility - Moved from different county within same state (%) - Hispanic or Latino
Geographical mobility - Moved from different county within same state (%) - American Indian and Alaska Native
Geographical mobility - Moved from different county within same state (%) - Multirace
Geographical mobility - Moved from different county within same state (%) - Other Race
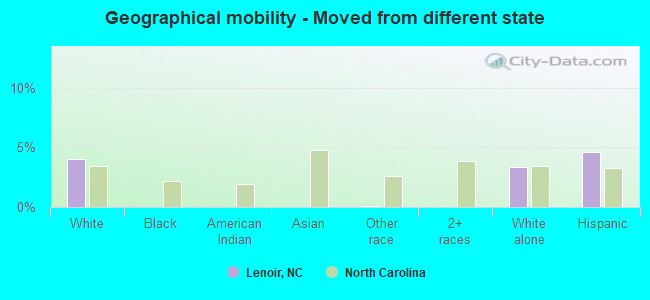
Geographical mobility - Moved from different state (%)
Geographical mobility - Moved from different state (%) - White
Geographical mobility - Moved from different state (%) - Black or African American
Geographical mobility - Moved from different state (%) - Asian
Geographical mobility - Moved from different state (%) - Hispanic or Latino
Geographical mobility - Moved from different state (%) - American Indian and Alaska Native
Geographical mobility - Moved from different state (%) - Multirace
Geographical mobility - Moved from different state (%) - Other Race
Geographical mobility - Moved from abroad (%)
Geographical mobility - Moved from abroad (%) - White
Geographical mobility - Moved from abroad (%) - Black or African American
Geographical mobility - Moved from abroad (%) - Asian
Geographical mobility - Moved from abroad (%) - Hispanic or Latino
Geographical mobility - Moved from abroad (%) - American Indian and Alaska Native
Geographical mobility - Moved from abroad (%) - Multirace
Geographical mobility - Moved from abroad (%) - Other Race
Place of birth for the foreign-born population - Ireland (%)
Place of birth for the foreign-born population - Denmark (%)
Place of birth for the foreign-born population - Norway (%)
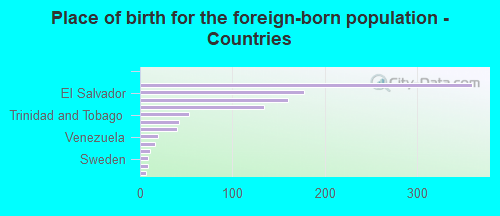
Place of birth for the foreign-born population - Sweden (%)
Place of birth for the foreign-born population - United Kingdom (%)
Place of birth for the foreign-born population - England (%)
Place of birth for the foreign-born population - Scotland (%)
Place of birth for the foreign-born population - Other Northern Europe (%)
Place of birth for the foreign-born population - Austria (%)
Place of birth for the foreign-born population - Belgium (%)
Place of birth for the foreign-born population - France (%)
Place of birth for the foreign-born population - Germany (%)
Place of birth for the foreign-born population - Netherlands (%)
Place of birth for the foreign-born population - Switzerland (%)
Place of birth for the foreign-born population - Other Western Europe (%)
Place of birth for the foreign-born population - Greece (%)
Place of birth for the foreign-born population - Italy (%)
Place of birth for the foreign-born population - Portugal (%)
Place of birth for the foreign-born population - Spain (%)
Place of birth for the foreign-born population - Other Southern Europe (%)
Place of birth for the foreign-born population - Albania (%)
Place of birth for the foreign-born population - Belarus (%)
Place of birth for the foreign-born population - Bosnia and Herzegovina (%)
Place of birth for the foreign-born population - Bulgaria (%)
Place of birth for the foreign-born population - Croatia (%)
Place of birth for the foreign-born population - Czechoslovakia (%)
Place of birth for the foreign-born population - Hungary (%)
Place of birth for the foreign-born population - Latvia (%)
Place of birth for the foreign-born population - Lithuania (%)
Place of birth for the foreign-born population - North Macedonia (Macedonia) (%)
Place of birth for the foreign-born population - Moldova (%)
Place of birth for the foreign-born population - Poland (%)
Place of birth for the foreign-born population - Romania (%)
Place of birth for the foreign-born population - Russia (%)
Place of birth for the foreign-born population - Serbia (%)
Place of birth for the foreign-born population - Ukraine (%)
Place of birth for the foreign-born population - Other Eastern Europe (%)
Place of birth for the foreign-born population - China (%)
Place of birth for the foreign-born population - Hong Kong (%)
Place of birth for the foreign-born population - Taiwan (%)
Place of birth for the foreign-born population - Japan (%)
Place of birth for the foreign-born population - Korea (%)
Place of birth for the foreign-born population - Other Eastern Asia (%)
Place of birth for the foreign-born population - Afghanistan (%)
Place of birth for the foreign-born population - Bangladesh (%)
Place of birth for the foreign-born population - India (%)
Place of birth for the foreign-born population - Iran (%)
Place of birth for the foreign-born population - Kazakhstan (%)
Place of birth for the foreign-born population - Nepal (%)
Place of birth for the foreign-born population - Pakistan (%)
Place of birth for the foreign-born population - Sri Lanka (%)
Place of birth for the foreign-born population - Uzbekistan (%)
Place of birth for the foreign-born population - Other South Central Asia (%)
Place of birth for the foreign-born population - Burma (%)
Place of birth for the foreign-born population - Cambodia (%)
Place of birth for the foreign-born population - Indonesia (%)
Place of birth for the foreign-born population - Laos (%)
Place of birth for the foreign-born population - Malaysia (%)
Place of birth for the foreign-born population - Philippines (%)
Place of birth for the foreign-born population - Singapore (%)
Place of birth for the foreign-born population - Thailand (%)
Place of birth for the foreign-born population - Vietnam (%)
Place of birth for the foreign-born population - Other South Eastern Asia (%)
Place of birth for the foreign-born population - Armenia (%)
Place of birth for the foreign-born population - Iraq (%)
Place of birth for the foreign-born population - Israel (%)
Place of birth for the foreign-born population - Jordan (%)
Place of birth for the foreign-born population - Kuwait (%)
Place of birth for the foreign-born population - Lebanon (%)
Place of birth for the foreign-born population - Saudi Arabia (%)
Place of birth for the foreign-born population - Syria (%)
Place of birth for the foreign-born population - Turkey (%)
Place of birth for the foreign-born population - Yemen (%)
Place of birth for the foreign-born population - Other Western Asia (%)
Place of birth for the foreign-born population - Eritrea (%)
Place of birth for the foreign-born population - Ethiopia (%)
Place of birth for the foreign-born population - Kenya (%)
Place of birth for the foreign-born population - Somalia (%)
Place of birth for the foreign-born population - Uganda (%)
Place of birth for the foreign-born population - Zimbabwe (%)
Place of birth for the foreign-born population - Other Eastern Africa (%)
Place of birth for the foreign-born population - Cameroon (%)
Place of birth for the foreign-born population - Congo (%)
Place of birth for the foreign-born population - Democratic Republic of Congo (Zaire) (%)
Place of birth for the foreign-born population - Other Middle Africa (%)
Place of birth for the foreign-born population - Egypt (%)
Place of birth for the foreign-born population - Morocco (%)
Place of birth for the foreign-born population - Sudan (%)
Place of birth for the foreign-born population - Other Northern Africa (%)
Place of birth for the foreign-born population - South Africa (%)
Place of birth for the foreign-born population - Other Southern Africa (%)
Place of birth for the foreign-born population - Cabo Verde (%)
Place of birth for the foreign-born population - Ghana (%)
Place of birth for the foreign-born population - Liberia (%)
Place of birth for the foreign-born population - Nigeria (%)
Place of birth for the foreign-born population - Senegal (%)
Place of birth for the foreign-born population - Sierra Leone (%)
Place of birth for the foreign-born population - Other Western Africa (%)
Place of birth for the foreign-born population - Australia (%)
Place of birth for the foreign-born population - New Zealand (%)
Place of birth for the foreign-born population - Fiji (%)
Place of birth for the foreign-born population - Micronesia (%)
Place of birth for the foreign-born population - Bahamas (%)
Place of birth for the foreign-born population - Barbados (%)
Place of birth for the foreign-born population - Cuba (%)
Place of birth for the foreign-born population - Dominica (%)
Place of birth for the foreign-born population - Dominican Republic (%)
Place of birth for the foreign-born population - Grenada (%)
Place of birth for the foreign-born population - Haiti (%)
Place of birth for the foreign-born population - Jamaica (%)
Place of birth for the foreign-born population - St. Vincent and the Grenadines (%)
Place of birth for the foreign-born population - Trinidad and Tobago (%)
Place of birth for the foreign-born population - West Indies (%)
Place of birth for the foreign-born population - Other Caribbean (%)
Place of birth for the foreign-born population - Belize (%)
Place of birth for the foreign-born population - Costa Rica (%)
Place of birth for the foreign-born population - El Salvador (%)
Place of birth for the foreign-born population - Guatemala (%)
Place of birth for the foreign-born population - Honduras (%)
Place of birth for the foreign-born population - Mexico (%)
Place of birth for the foreign-born population - Nicaragua (%)
Place of birth for the foreign-born population - Panama (%)
Place of birth for the foreign-born population - Other Central America (%)
Place of birth for the foreign-born population - Argentina (%)
Place of birth for the foreign-born population - Bolivia (%)
Place of birth for the foreign-born population - Brazil (%)
Place of birth for the foreign-born population - Chile (%)
Place of birth for the foreign-born population - Colombia (%)
Place of birth for the foreign-born population - Ecuador (%)
Place of birth for the foreign-born population - Guyana (%)
Place of birth for the foreign-born population - Peru (%)
Place of birth for the foreign-born population - Uruguay (%)
Place of birth for the foreign-born population - Venezuela (%)
Place of birth for the foreign-born population - Other South America (%)
Place of birth for the foreign-born population - Canada (%)
Place of birth for the foreign-born population - Other Northern America (%)
Place of birth for the foreign-born population - Other (%)
Latest news about races in Lenoir, NC collected exclusively by city-data.com from local newspapers, TV, and radio stations
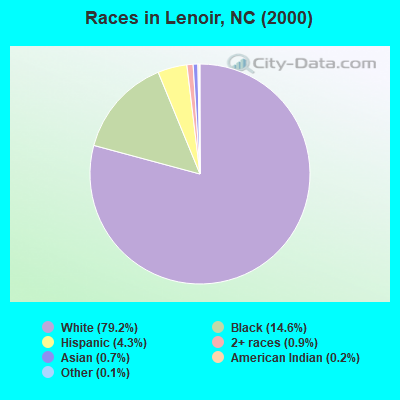
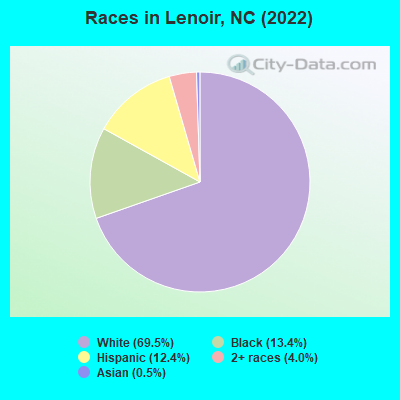
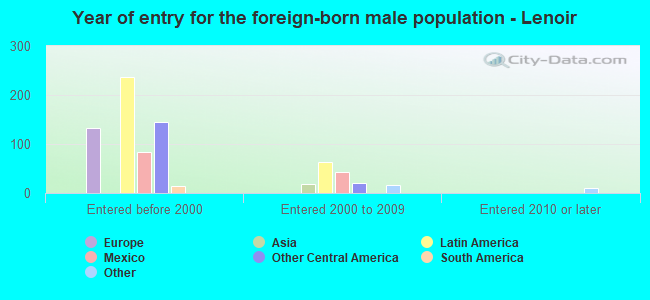
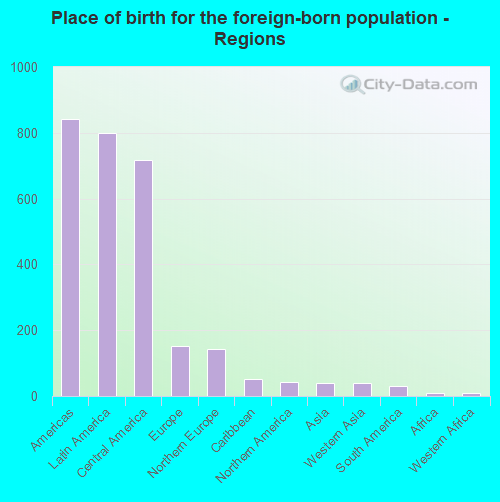
According to 2022 data, the most numerous races in Lenoir, NC are White alone (12,995 residents), Black alone (2,506 residents), and Hispanic (2,314 residents). 88.9% of Lenoir residents speak English at home. 5.7% of Lenoir, NC residents are foreign-born (4.1% born in Latin America, 0.8% born in Europe), which is 40.0% less than the foreign-born rate of 8.0% across the entire state of North Carolina.
Race distribution in Lenoir
2000 2022
5,647,155 70.2% White alone 1,723,301 21.4% Black alone 378,963 4.7% Hispanic 112,416 1.4% Asian alone 95,333 1.2% American Indian alone 79,965 1.0% Two or more races 9,015 0.1% Other race alone 3,165 0.04% Native Hawaiian and Other
6,497,519 60.7% White alone 2,155,650 20.1% Black alone 1,114,799 10.4% Hispanic 438,061 4.1% Two or more races 341,052 3.2% Asian alone 91,758 0.9% American Indian alone 50,180 0.5% Other race alone 9,954 0.09% Native Hawaiian and Other
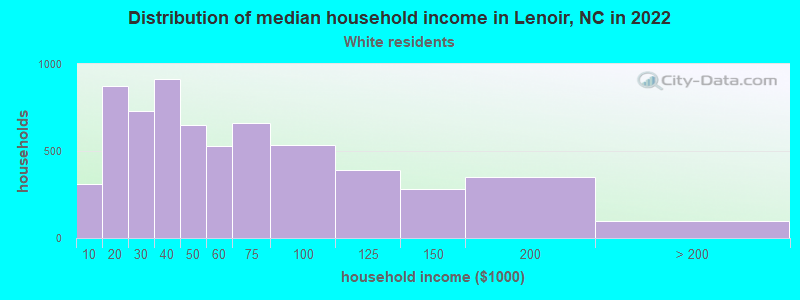
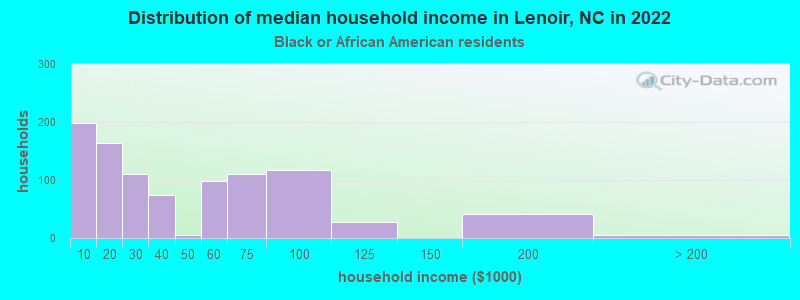
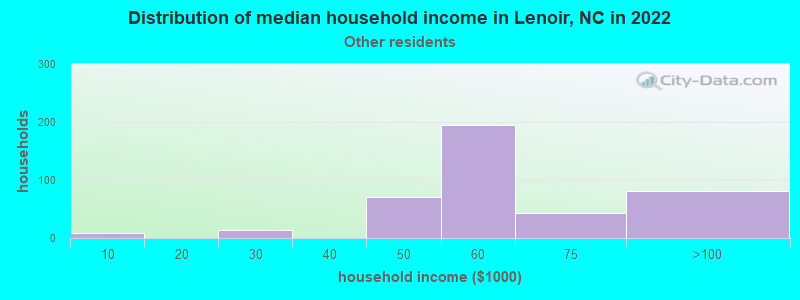
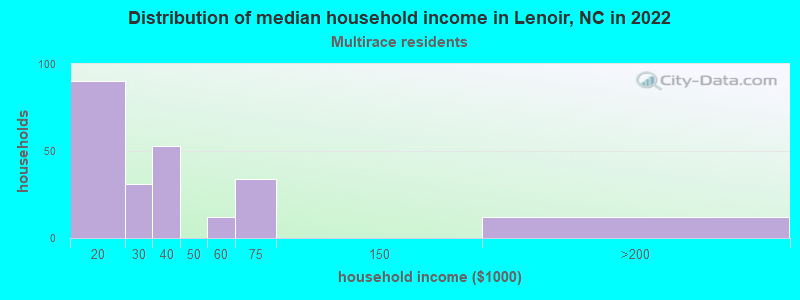
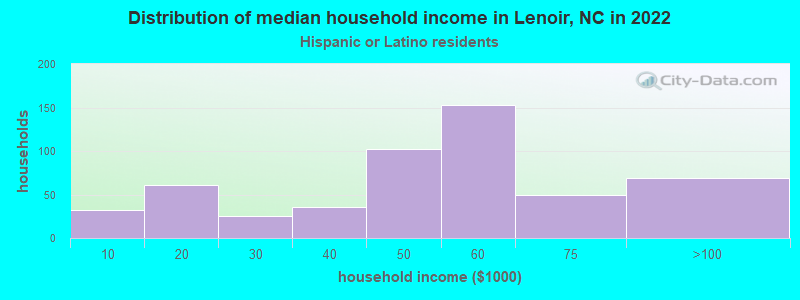
Income and house value in Lenoir Median household income in 2022 $45,470 White non-Hispanic householders$30,971 Black householders$52,637 Some other race householders$28,549 Two or more races householders$51,320 Hispanic or Latino race householdersMedian 2022 house value $191,818 White Non-Hispanic householders$134,666 Black or African American householders$260,308 American Indian or Alaska Native householders $158,730 Asian householders$148,549 Some other race householders$214,031 Two or more races householders$125,873 Hispanic or Latino householders
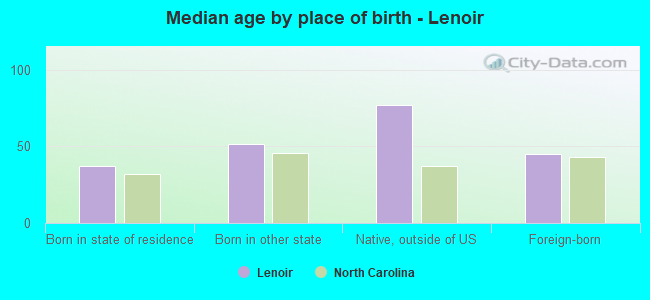
Median age by race in Lenoir
49.1 Median age for White residents44.5 54.1 31.2 Median age for Black or African American residents46.2 23.6 -666,666,666.0 Median age for American Indian / Alaska Native residents-668,604,650.5 -682,971,013.8 -824,016,562.3 Median age for Asian residents-682,080,924.2 -689,075,629.6 -609,884,331.7 Median age for Native Hawaiian / Pacific Islander residents-611,708,482.1 -666,666,666.0 22.9 Median age for Other race residents23.0 27.6 24.7 Median age for Two or more races residents18.8 30.1 48.8 Median age for White alone residents44.6 53.7 22.0 Median age for Hispanic or Latino residents19.9 28.0
Owner/renter occupied households by race in Lenoir
House owners and renters - White residents 4,253 66.1% Owner occupied2,185 33.9% Renter occupiedHouse owners and renters - Black or African American residents 614 51.2% Owner occupied585 48.8% Renter occupiedHouse owners and renters - American Indian / Alaska Native residents 16 100.0% Owner occupiedHouse owners and renters - Asian residents 43 100.0% Owner occupiedHouse owners and renters - Other race residents 196 56.0% Owner occupied154 44.0% Renter occupiedHouse owners and renters - Two or more races residents 56 24.5% Owner occupied172 75.5% Renter occupiedHouse owners and renters - White alone residents 4,143 65.7% Owner occupied2,160 34.3% Renter occupiedHouse owners and renters - Hispanic or Latino residents 392 54.2% Owner occupied331 45.8% Renter occupied
Language usage in Lenoir
English speakers - Total 88.9% of residents of Lenoir speak English at home.
10.1% of residents speak Spanish at home 1,180 66.4% Speak English very well596 33.6% Speak English less than very well0.7% of residents speak other language at home 80 66.1% Speak English very well41 33.9% Speak English less than very well
English speakers - Born in the United States 89.2% of residents of Lenoir speak English at home.
9.7% of residents speak Spanish at home 295 72.7% Speak English very well111 27.3% Speak English less than very well1.4% of residents speak other language at home 41 68.3% Speak English very well19 31.7% Speak English less than very well
All residents speak only English at home
English speakers - Foreign-born 29.3% of residents of Lenoir speak English at home.
64.0% of residents speak Spanish at home 197 29.5% Speak English very well470 70.5% Speak English less than very well4.8% of residents speak other language at home 30 60.0% Speak English very well20 40.0% Speak English less than very well
White (Caucasian) - Speak only English Native:
99.1% (12,126)Foreign-born:
100.0% (184)
White (Caucasian) - Speak another language Native:
1.3% (161)Foreign-born:
12.4% (23)
Other race - Speak only English Native:
6.7% (70)Foreign-born:
2.2% (18)
Other race - Speak another language Native:
92.7% (962)Foreign-born:
98.2% (833)
White alone - Speak only English Native:
99.1% (12,070)Foreign-born:
82.9% (195)
White alone - Speak another language Native:
0.8% (99)Foreign-born:
17.2% (40)
Hispanic or Latino - Speak only English Native:
30.3% (395)Foreign-born:
7.6% (72)
Hispanic or Latino - Speak another language Native:
64.6% (840)Foreign-born:
92.5% (871)
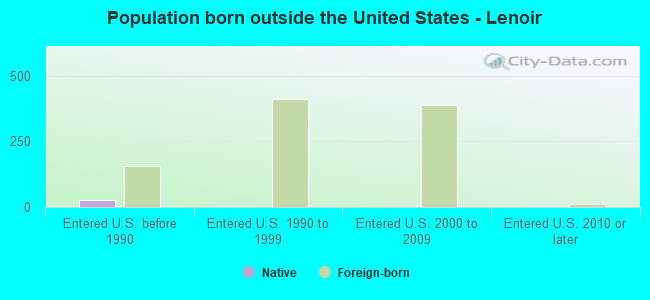
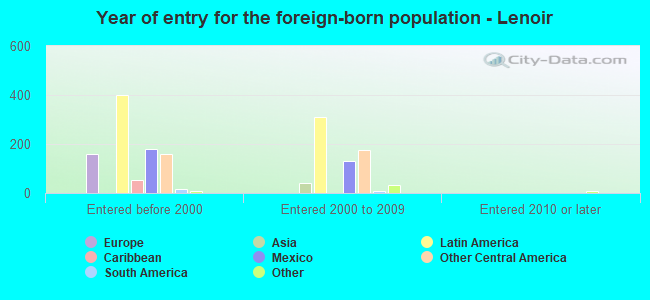
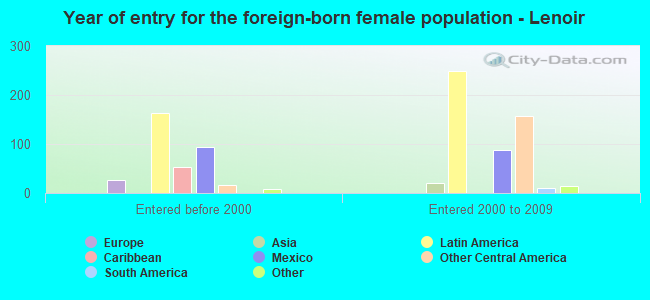
Foreign-born residents in Lenoir 1,043 residents are foreign born (4.1% Latin America , 0.8% Europe ).
This city:
5.7%North Carolina:
8.3%
Marital status for residents in Lenoir Marital status - White (Caucasian) population 15 years and over
Males 28.3% Never married50.6% Now married0.3% Separated3.3% Widowed17.5% DivorcedFemales 21.2% Never married38.0% Now married2.9% Separated18.7% Widowed19.2% DivorcedWomen who gave birth in the past 12 months Now married:
41.0% (68)Unmarried:
59.0% (98)
Women who did not give birth in the past 12 months Now married:
43.6% (1,040)Unmarried:
56.4% (1,346)
Marital status - Black or African American population 15 years and over
Males 43.9% Never married42.6% Now married5.6% Separated0.0% Widowed7.9% DivorcedFemales 47.8% Never married13.7% Now married8.6% Separated7.3% Widowed22.7% DivorcedWomen who gave birth in the past 12 months Now married:
100.0% (18)Unmarried:
0.0% (0)
Women who did not give birth in the past 12 months Now married:
16.9% (111)Unmarried:
83.1% (545)
Marital status - Other race population 15 years and over
Males 63.6% Never married36.4% Now married0.0% Separated0.0% Widowed0.0% DivorcedFemales 47.9% Never married41.9% Now married0.0% Separated0.0% Widowed10.2% DivorcedWomen who did not give birth in the past 12 months Now married:
45.3% (272)Unmarried:
54.7% (328)
Marital status - Two or more races population 15 years and over
Males 68.9% Never married31.1% Now married0.0% Separated0.0% Widowed0.0% DivorcedFemales 66.5% Never married27.1% Now married0.0% Separated0.0% Widowed6.3% DivorcedWomen who gave birth in the past 12 months Now married:
0.0% (0)Unmarried:
100.0% (29)
Women who did not give birth in the past 12 months Now married:
24.8% (71)Unmarried:
75.2% (216)
Marital status - White alone, not Hispanic / Latino population 15 years and over
Males 28.5% Never married50.6% Now married0.3% Separated3.3% Widowed17.3% DivorcedFemales 21.7% Never married38.1% Now married2.1% Separated19.0% Widowed19.2% DivorcedWomen who gave birth in the past 12 months Now married:
32.5% (48)Unmarried:
67.5% (99)
Women who did not give birth in the past 12 months Now married:
42.9% (1,012)Unmarried:
57.1% (1,349)
Marital status - Hispanic or Latino population 15 years and over
Males 61.4% Never married36.1% Now married0.0% Separated0.0% Widowed2.4% DivorcedFemales 39.4% Never married40.3% Now married6.6% Separated2.2% Widowed11.6% DivorcedWomen who gave birth in the past 12 months Now married:
100.0% (24)Unmarried:
0.0% (0)
Women who did not give birth in the past 12 months Now married:
47.8% (308)Unmarried:
52.2% (336)
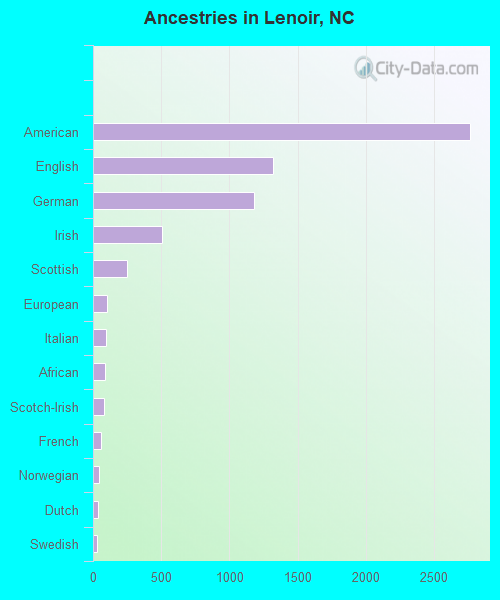
Ancestries in Lenoir
2,765 24.2% American1,322 11.6% English1,179 10.3% German504 4.4% Irish252 2.2% Scottish102 0.9% European94 0.8% Italian85 0.7% African78 0.7% Scotch-Irish60 0.5% French47 0.4% Norwegian34 0.3% Dutch32 0.3% Swedish18 0.2% Canadian15 0.1% Welsh13 0.1% Northern European13 0.1% Nigerian12 0.1% British
Geographical mobility in Lenoir Same house 1 year ago 11,955 93.3% White (Caucasian)2,105 82.0% Black or African American17 100.0% American Indian / Alaska Native96 100.0% Asian1,941 98.4% Other race1,127 91.8% Two or more races11,808 93.7% White alone, not Hispanic / Latino2,180 94.1% Hispanic or LatinoMoved within same county 338 2.6% White / Caucasian326 12.7% Black or African American32 1.6% Other race94 7.7% Two or more races330 2.6% White alone, not Hispanic / Latino50 2.2% Hispanic or LatinoMoved within same state 145 1.1% White / Caucasian102 4.0% Black or African American1 0.1% Other race6 0.5% Two or more races155 1.2% White alone, not Hispanic / Latino1 0.0% Hispanic or LatinoMoved from different state 512 4.0% White / Caucasian1 0.1% Other race427 3.4% White alone, not Hispanic / Latino106 4.6% Hispanic or Latino
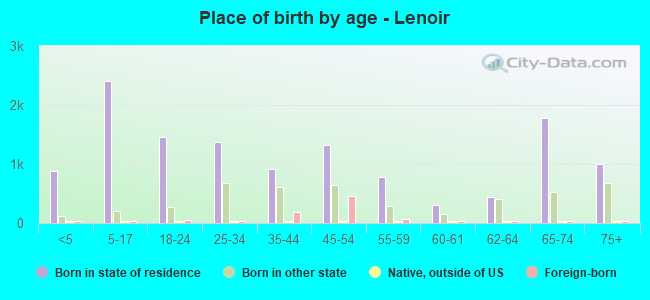
Children Nativity (place of birth) in Lenoir
Children under 6 years - Living with two parents Both parents native 785 100.0% NativeOne native, one foreign-born parent 43 100.0% NativeChildren under 6 years - Living with one parent Native parent 330 100.0% NativeForeign-born parent 28 100.0% NativeChildren 6 to 17 years - Living with two parents Both parents native 1,025 98.4% Native17 1.6% Foreign-bornBoth parents foreign-born 242 100.0% NativeOne native, one foreign-born parent 32 100.0% NativeChildren 6 to 17 years - Living with one parent Native parent 722 100.0% NativeForeign-born parent 198 51.0% Native191 49.0% Foreign-born
Grandparents responsible for own grandchildren in Lenoir
Grandparents (30 to 59 years) White / Caucasian 190 78.8% Responsible for grandchildren51 21.2% Not responsible for grandchildrenBlack or African American 29 34.5% Responsible for grandchildren54 65.5% Not responsible for grandchildrenOther race 8 37.3% Responsible for grandchildren13 62.7% Not responsible for grandchildrenWhite alone, not Hispanic / Latino 156 74.7% Responsible for grandchildren53 25.3% Not responsible for grandchildrenHispanic or Latino 52 81.6% Responsible for grandchildren12 18.4% Not responsible for grandchildrenGrandparents (60 years and over) White / Caucasian 55 84.9% Responsible for grandchildren10 15.1% Not responsible for grandchildrenBlack or African American 113 100.0% Not responsible for grandchildrenOther race 25 100.0% Not responsible for grandchildrenWhite alone, not Hispanic / Latino 57 85.0% Responsible for grandchildren10 15.0% Not responsible for grandchildrenHispanic or Latino 36 100.0% Not responsible for grandchildren