Races in Lompoc Valley, California (CA) Detailed Stats
Ancestries, Foreign-born residents, place of birth
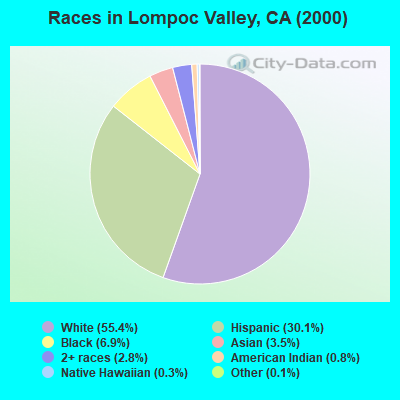
Race distribution in Lompoc Valley

- 32,31555.4%White alone
- 17,56430.1%Hispanic
- 4,0226.9%Black alone
- 2,0623.5%Asian alone
- 1,6062.8%Two or more races
- 4580.8%American Indian alone
- 1880.3%Native Hawaiian and Other
Pacific Islander alone - 860.1%Other race alone
2000
2022
-
- 15,816,79046.7%White alone
- 10,966,55632.4%Hispanic
- 3,648,86010.8%Asian alone
- 2,181,9266.4%Black alone
- 903,1152.7%Two or more races
- 178,9840.5%American Indian alone
- 103,7360.3%Native Hawaiian and Other
Pacific Islander alone - 71,6810.2%Other race alone

-
- 15,732,18440.3%Hispanic
- 13,160,42633.7%White alone
- 5,957,86715.3%Asian alone
- 2,025,2185.2%Black alone
- 1,663,2224.3%Two or more races
- 251,6180.6%Other race alone
- 135,7770.3%Native Hawaiian and Other
Pacific Islander alone - 103,0300.3%American Indian alone

Income and house value in Lompoc Valley
- Median household income in 2022
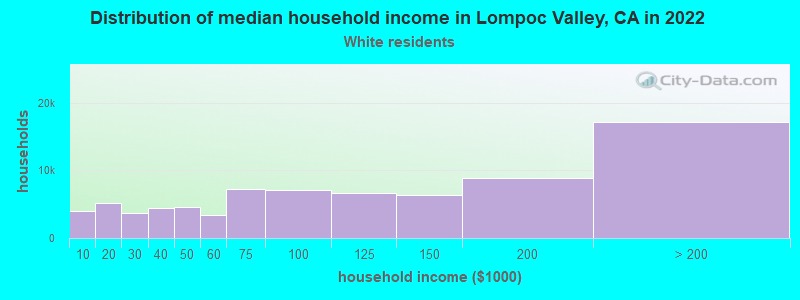
- $86,811White non-Hispanic householders
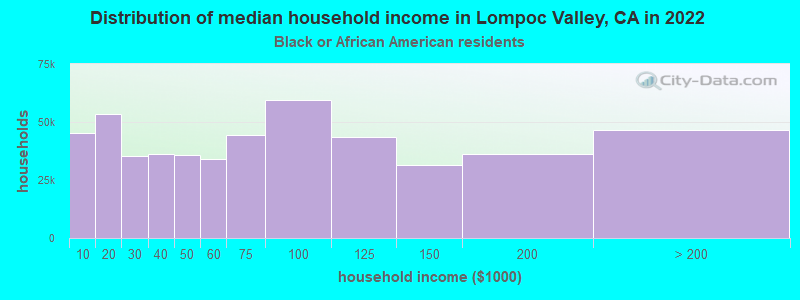
- $77,791Black householders
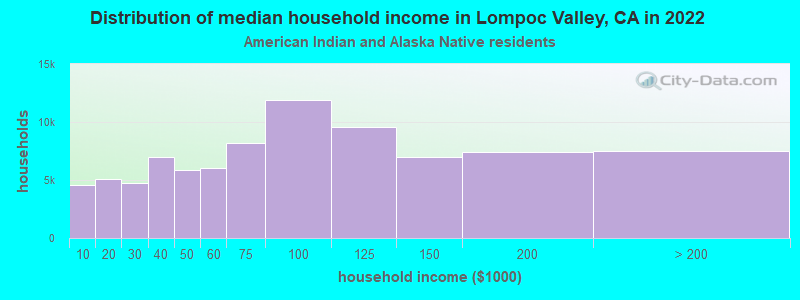
- $82,209American Indian and Alaska Native householders
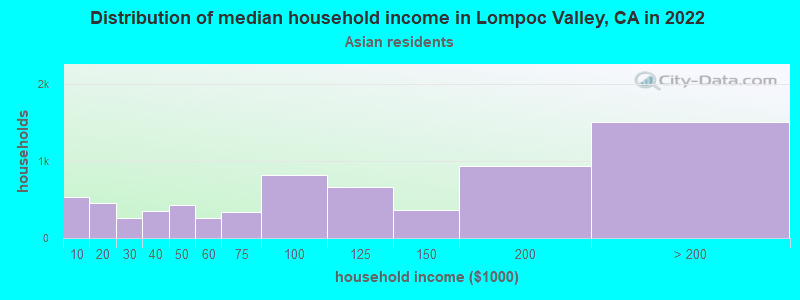
- $95,622Asian householders
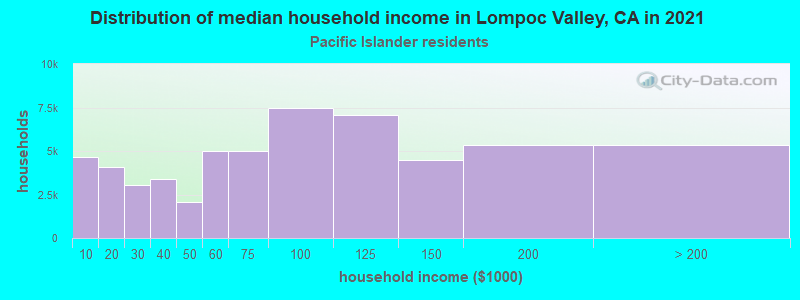
- $121,397Native Hawaiian and other Pacific Islander householders
- $69,176Some other race householders
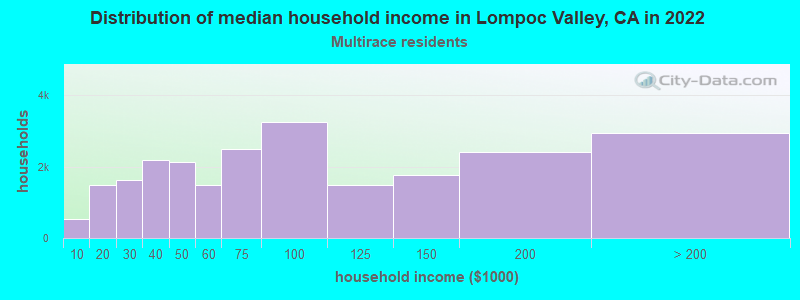
- $67,149Two or more races householders
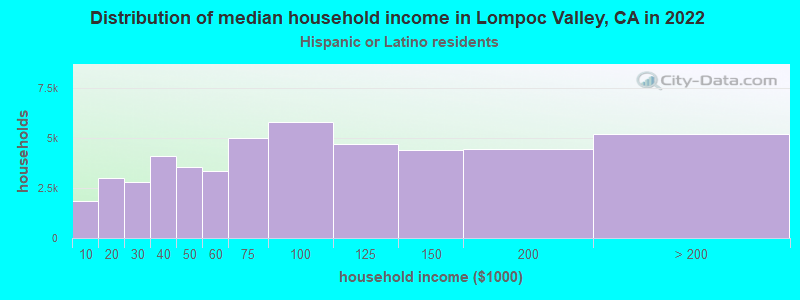
- $68,289Hispanic or Latino race householders
- Median 2022 house value
- $553,571White Non-Hispanic householders
- $557,171Black or African American householders
- $519,738American Indian or Alaska Native householders
- $593,883Asian householders
- $526,936Native Hawaiian and other Pacific Islander householders
- $529,456Some other race householders
- $574,087Two or more races householders
- $512,179Hispanic or Latino householders
Household income for White non-Hispanic householders
Household income for Black householders
Household income for American Indian and Alaska Native householders
Household income for Asian householders
Household income for Native Hawaiian and other Pacific Islander householders
Household income for Two or more races householders
Household income for Hispanic or Latino race householders
Zip code: 93436