Races in Mansfield, Texas (TX) Detailed Stats
Data:
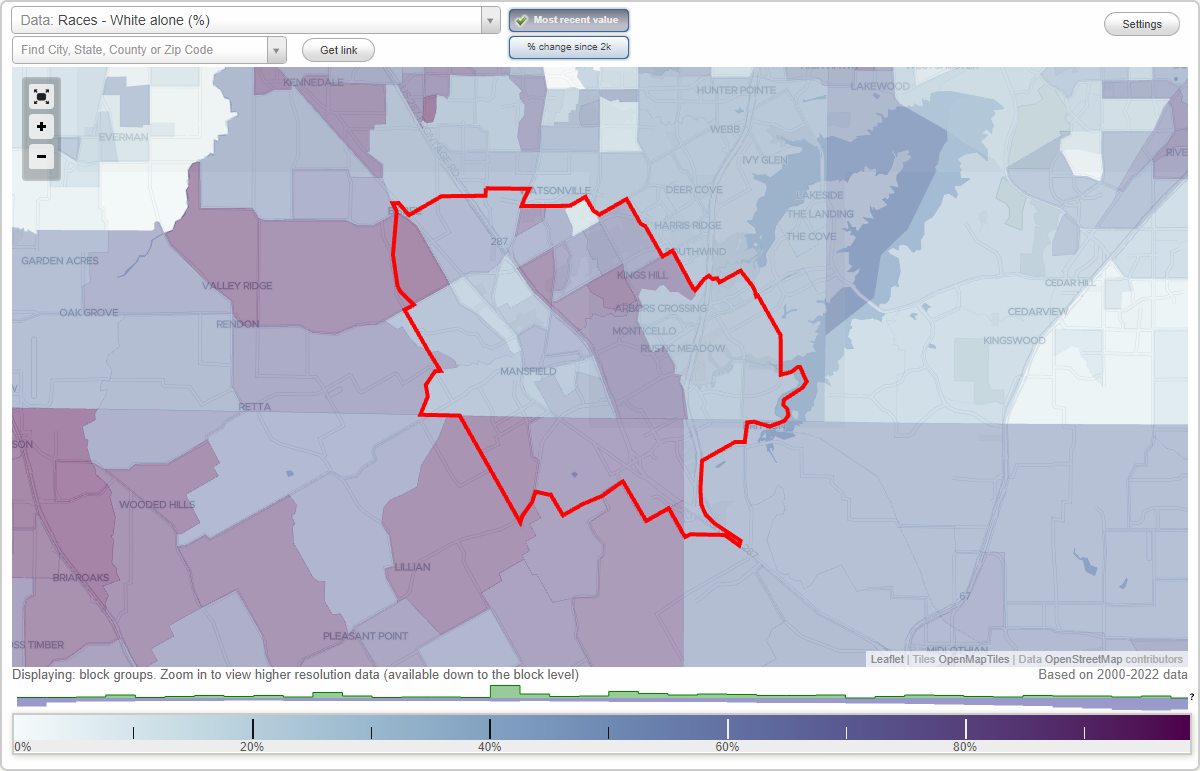
Races - White alone (%)
Races - White alone (% change since 2000)
Races - Black alone (%)
Races - Black alone (% change since 2000)
Races - American Indian alone (%)
Races - American Indian alone (% change since 2000)
Races - Asian alone (%)
Races - Asian alone (% change since 2000)
Races - Hispanic (%)
Races - Hispanic (% change since 2000)
Races - Native Hawaiian and Other Pacific Islander alone (%)
Races - Native Hawaiian and Other Pacific Islander alone (% change since 2000)
Races - Two or more races(%)
Races - Two or more races(% change since 2000)
Races - Other race alone (%)
Races - Other race alone (% change since 2000)
Racial diversity
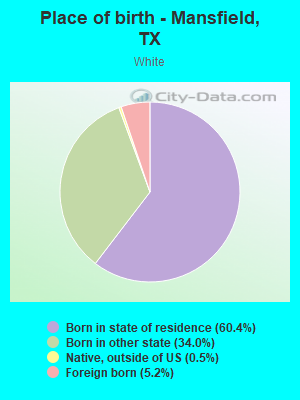
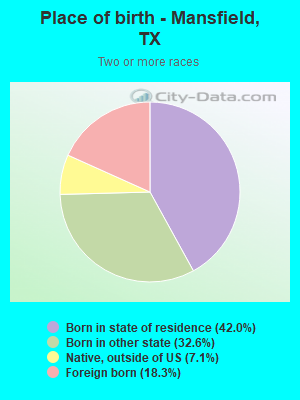
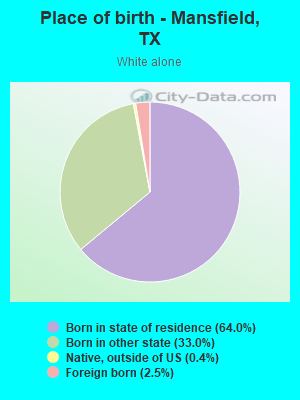
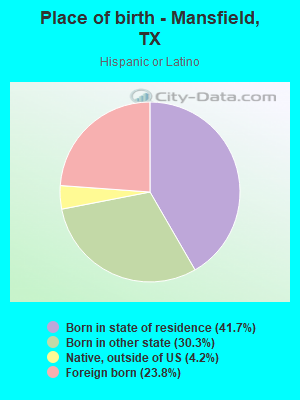
Place of birth - Born in state of residence (%)
Place of birth - Born in state of residence (%) - White
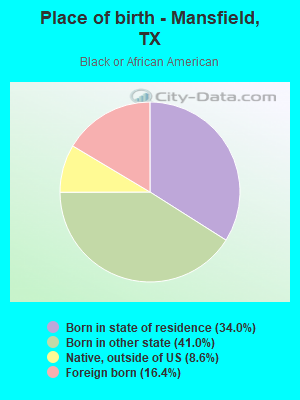
Place of birth - Born in state of residence (%) - Black or African American
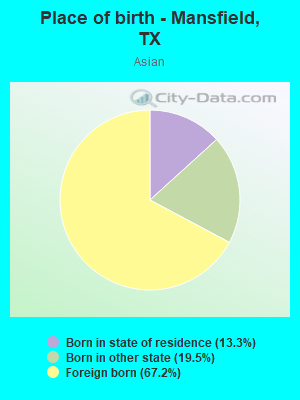
Place of birth - Born in state of residence (%) - Asian
Place of birth - Born in state of residence (%) - Hispanic or Latino
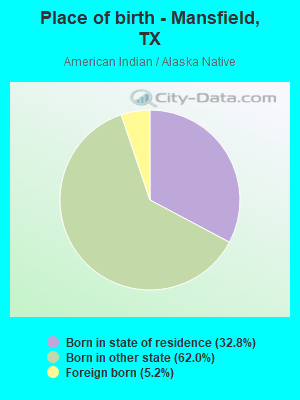
Place of birth - Born in state of residence (%) - American Indian and Alaska Native
Place of birth - Born in state of residence (%) - Multirace
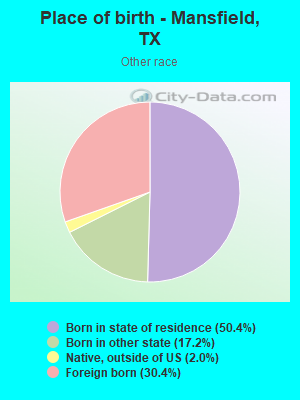
Place of birth - Born in state of residence (%) - Other Race
Place of birth - Born in other state (%)
Place of birth - Born in other state (%) - White
Place of birth - Born in other state (%) - Black or African American
Place of birth - Born in other state (%) - Asian
Place of birth - Born in other state (%) - Hispanic or Latino
Place of birth - Born in other state (%) - American Indian and Alaska Native
Place of birth - Born in other state (%) - Multirace
Place of birth - Born in other state (%) - Other Race
Place of birth - Native, outside of US (%)
Place of birth - Native, outside of US (%) - White
Place of birth - Native, outside of US (%) - Black or African American
Place of birth - Native, outside of US (%) - Asian
Place of birth - Native, outside of US (%) - Hispanic or Latino
Place of birth - Native, outside of US (%) - American Indian and Alaska Native
Place of birth - Native, outside of US (%) - Multirace
Place of birth - Native, outside of US (%) - Other Race
Place of birth - Foreign born (%)
Place of birth - Foreign born (%) - White
Place of birth - Foreign born (%) - Black or African American
Place of birth - Foreign born (%) - Asian
Place of birth - Foreign born (%) - Hispanic or Latino
Place of birth - Foreign born (%) - American Indian and Alaska Native
Place of birth - Foreign born (%) - Multirace
Place of birth - Foreign born (%) - Other Race
Residents speaking English at home (%)
Residents speaking English at home - Born in the United States (%)
Residents speaking English at home - Native, born elsewhere (%)
Residents speaking English at home - Foreign born (%)
Residents speaking Spanish at home (%)
Residents speaking Spanish at home - Born in the United States (%)
Residents speaking Spanish at home - Native, born elsewhere (%)
Residents speaking Spanish at home - Foreign born (%)
Residents speaking other language at home (%)
Residents speaking other language at home - Born in the United States (%)
Residents speaking other language at home - Native, born elsewhere (%)
Residents speaking other language at home - Foreign born (%)
Marital status - Never married (%)
Marital status - Now married (%)
Marital status - Separated (%)
Marital status - Widowed (%)
Marital status - Divorced (%)
Ancestries Reported - Arab (%)
Ancestries Reported - Czech (%)
Ancestries Reported - Danish (%)
Ancestries Reported - Dutch (%)
Ancestries Reported - English (%)
Ancestries Reported - French (%)
Ancestries Reported - French Canadian (%)
Ancestries Reported - German (%)
Ancestries Reported - Greek (%)
Ancestries Reported - Hungarian (%)
Ancestries Reported - Irish (%)
Ancestries Reported - Italian (%)
Ancestries Reported - Lithuanian (%)
Ancestries Reported - Norwegian (%)
Ancestries Reported - Polish (%)
Ancestries Reported - Portuguese (%)
Ancestries Reported - Russian (%)
Ancestries Reported - Scotch-Irish (%)
Ancestries Reported - Scottish (%)
Ancestries Reported - Slovak (%)
Ancestries Reported - Subsaharan African (%)
Ancestries Reported - Swedish (%)
Ancestries Reported - Swiss (%)
Ancestries Reported - Ukrainian (%)
Ancestries Reported - United States (%)
Ancestries Reported - Welsh (%)
Ancestries Reported - West Indian (%)
Ancestries Reported - Other (%)
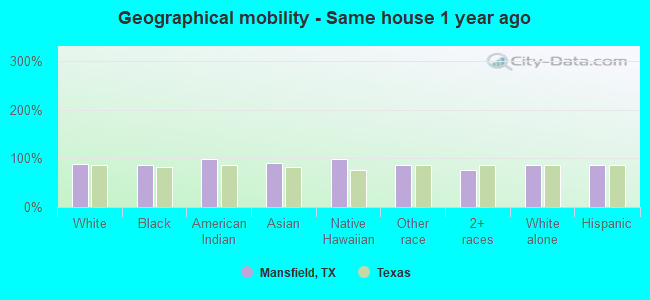
Geographical mobility - Same house 1 year ago (%)
Geographical mobility - Same house 1 year ago (%) - White
Geographical mobility - Same house 1 year ago (%) - Black or African American
Geographical mobility - Same house 1 year ago (%) - Asian
Geographical mobility - Same house 1 year ago (%) - Hispanic or Latino
Geographical mobility - Same house 1 year ago (%) - American Indian and Alaska Native
Geographical mobility - Same house 1 year ago (%) - Multirace
Geographical mobility - Same house 1 year ago (%) - Other Race
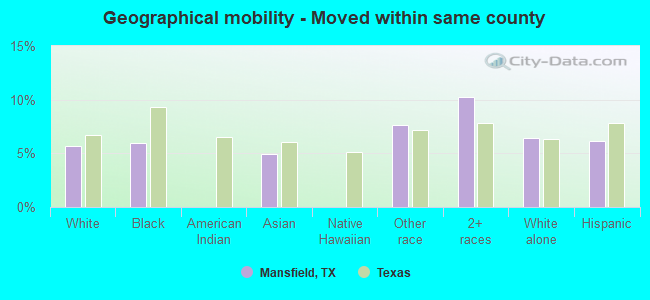
Geographical mobility - Moved within same county (%)
Geographical mobility - Moved within same county (%) - White
Geographical mobility - Moved within same county (%) - Black or African American
Geographical mobility - Moved within same county (%) - Asian
Geographical mobility - Moved within same county (%) - Hispanic or Latino
Geographical mobility - Moved within same county (%) - American Indian and Alaska Native
Geographical mobility - Moved within same county (%) - Multirace
Geographical mobility - Moved within same county (%) - Other Race
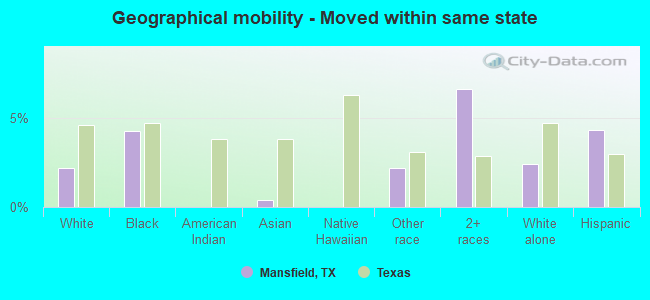
Geographical mobility - Moved from different county within same state (%)
Geographical mobility - Moved from different county within same state (%) - White
Geographical mobility - Moved from different county within same state (%) - Black or African American
Geographical mobility - Moved from different county within same state (%) - Asian
Geographical mobility - Moved from different county within same state (%) - Hispanic or Latino
Geographical mobility - Moved from different county within same state (%) - American Indian and Alaska Native
Geographical mobility - Moved from different county within same state (%) - Multirace
Geographical mobility - Moved from different county within same state (%) - Other Race
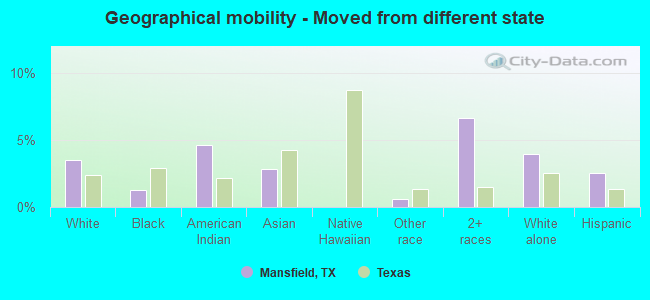
Geographical mobility - Moved from different state (%)
Geographical mobility - Moved from different state (%) - White
Geographical mobility - Moved from different state (%) - Black or African American
Geographical mobility - Moved from different state (%) - Asian
Geographical mobility - Moved from different state (%) - Hispanic or Latino
Geographical mobility - Moved from different state (%) - American Indian and Alaska Native
Geographical mobility - Moved from different state (%) - Multirace
Geographical mobility - Moved from different state (%) - Other Race
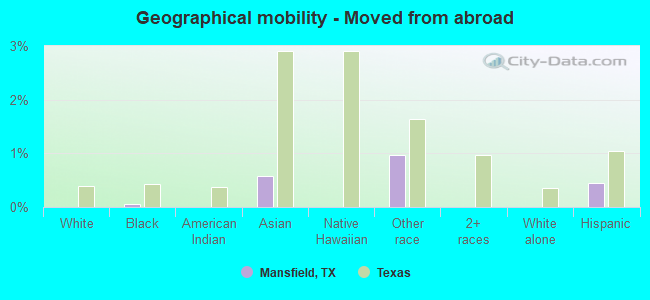
Geographical mobility - Moved from abroad (%)
Geographical mobility - Moved from abroad (%) - White
Geographical mobility - Moved from abroad (%) - Black or African American
Geographical mobility - Moved from abroad (%) - Asian
Geographical mobility - Moved from abroad (%) - Hispanic or Latino
Geographical mobility - Moved from abroad (%) - American Indian and Alaska Native
Geographical mobility - Moved from abroad (%) - Multirace
Geographical mobility - Moved from abroad (%) - Other Race
Place of birth for the foreign-born population - Ireland (%)
Place of birth for the foreign-born population - Denmark (%)
Place of birth for the foreign-born population - Norway (%)
Place of birth for the foreign-born population - Sweden (%)
Place of birth for the foreign-born population - United Kingdom (%)
Place of birth for the foreign-born population - England (%)
Place of birth for the foreign-born population - Scotland (%)
Place of birth for the foreign-born population - Other Northern Europe (%)
Place of birth for the foreign-born population - Austria (%)
Place of birth for the foreign-born population - Belgium (%)
Place of birth for the foreign-born population - France (%)
Place of birth for the foreign-born population - Germany (%)
Place of birth for the foreign-born population - Netherlands (%)
Place of birth for the foreign-born population - Switzerland (%)
Place of birth for the foreign-born population - Other Western Europe (%)
Place of birth for the foreign-born population - Greece (%)
Place of birth for the foreign-born population - Italy (%)
Place of birth for the foreign-born population - Portugal (%)
Place of birth for the foreign-born population - Spain (%)
Place of birth for the foreign-born population - Other Southern Europe (%)
Place of birth for the foreign-born population - Albania (%)
Place of birth for the foreign-born population - Belarus (%)
Place of birth for the foreign-born population - Bosnia and Herzegovina (%)
Place of birth for the foreign-born population - Bulgaria (%)
Place of birth for the foreign-born population - Croatia (%)
Place of birth for the foreign-born population - Czechoslovakia (%)
Place of birth for the foreign-born population - Hungary (%)
Place of birth for the foreign-born population - Latvia (%)
Place of birth for the foreign-born population - Lithuania (%)
Place of birth for the foreign-born population - North Macedonia (Macedonia) (%)
Place of birth for the foreign-born population - Moldova (%)
Place of birth for the foreign-born population - Poland (%)
Place of birth for the foreign-born population - Romania (%)
Place of birth for the foreign-born population - Russia (%)
Place of birth for the foreign-born population - Serbia (%)
Place of birth for the foreign-born population - Ukraine (%)
Place of birth for the foreign-born population - Other Eastern Europe (%)
Place of birth for the foreign-born population - China (%)
Place of birth for the foreign-born population - Hong Kong (%)
Place of birth for the foreign-born population - Taiwan (%)
Place of birth for the foreign-born population - Japan (%)
Place of birth for the foreign-born population - Korea (%)
Place of birth for the foreign-born population - Other Eastern Asia (%)
Place of birth for the foreign-born population - Afghanistan (%)
Place of birth for the foreign-born population - Bangladesh (%)
Place of birth for the foreign-born population - India (%)
Place of birth for the foreign-born population - Iran (%)
Place of birth for the foreign-born population - Kazakhstan (%)
Place of birth for the foreign-born population - Nepal (%)
Place of birth for the foreign-born population - Pakistan (%)
Place of birth for the foreign-born population - Sri Lanka (%)
Place of birth for the foreign-born population - Uzbekistan (%)
Place of birth for the foreign-born population - Other South Central Asia (%)
Place of birth for the foreign-born population - Burma (%)
Place of birth for the foreign-born population - Cambodia (%)
Place of birth for the foreign-born population - Indonesia (%)
Place of birth for the foreign-born population - Laos (%)
Place of birth for the foreign-born population - Malaysia (%)
Place of birth for the foreign-born population - Philippines (%)
Place of birth for the foreign-born population - Singapore (%)
Place of birth for the foreign-born population - Thailand (%)
Place of birth for the foreign-born population - Vietnam (%)
Place of birth for the foreign-born population - Other South Eastern Asia (%)
Place of birth for the foreign-born population - Armenia (%)
Place of birth for the foreign-born population - Iraq (%)
Place of birth for the foreign-born population - Israel (%)
Place of birth for the foreign-born population - Jordan (%)
Place of birth for the foreign-born population - Kuwait (%)
Place of birth for the foreign-born population - Lebanon (%)
Place of birth for the foreign-born population - Saudi Arabia (%)
Place of birth for the foreign-born population - Syria (%)
Place of birth for the foreign-born population - Turkey (%)
Place of birth for the foreign-born population - Yemen (%)
Place of birth for the foreign-born population - Other Western Asia (%)
Place of birth for the foreign-born population - Eritrea (%)
Place of birth for the foreign-born population - Ethiopia (%)
Place of birth for the foreign-born population - Kenya (%)
Place of birth for the foreign-born population - Somalia (%)
Place of birth for the foreign-born population - Uganda (%)
Place of birth for the foreign-born population - Zimbabwe (%)
Place of birth for the foreign-born population - Other Eastern Africa (%)
Place of birth for the foreign-born population - Cameroon (%)
Place of birth for the foreign-born population - Congo (%)
Place of birth for the foreign-born population - Democratic Republic of Congo (Zaire) (%)
Place of birth for the foreign-born population - Other Middle Africa (%)
Place of birth for the foreign-born population - Egypt (%)
Place of birth for the foreign-born population - Morocco (%)
Place of birth for the foreign-born population - Sudan (%)
Place of birth for the foreign-born population - Other Northern Africa (%)
Place of birth for the foreign-born population - South Africa (%)
Place of birth for the foreign-born population - Other Southern Africa (%)
Place of birth for the foreign-born population - Cabo Verde (%)
Place of birth for the foreign-born population - Ghana (%)
Place of birth for the foreign-born population - Liberia (%)
Place of birth for the foreign-born population - Nigeria (%)
Place of birth for the foreign-born population - Senegal (%)
Place of birth for the foreign-born population - Sierra Leone (%)
Place of birth for the foreign-born population - Other Western Africa (%)
Place of birth for the foreign-born population - Australia (%)
Place of birth for the foreign-born population - New Zealand (%)
Place of birth for the foreign-born population - Fiji (%)
Place of birth for the foreign-born population - Micronesia (%)
Place of birth for the foreign-born population - Bahamas (%)
Place of birth for the foreign-born population - Barbados (%)
Place of birth for the foreign-born population - Cuba (%)
Place of birth for the foreign-born population - Dominica (%)
Place of birth for the foreign-born population - Dominican Republic (%)
Place of birth for the foreign-born population - Grenada (%)
Place of birth for the foreign-born population - Haiti (%)
Place of birth for the foreign-born population - Jamaica (%)
Place of birth for the foreign-born population - St. Vincent and the Grenadines (%)
Place of birth for the foreign-born population - Trinidad and Tobago (%)
Place of birth for the foreign-born population - West Indies (%)
Place of birth for the foreign-born population - Other Caribbean (%)
Place of birth for the foreign-born population - Belize (%)
Place of birth for the foreign-born population - Costa Rica (%)
Place of birth for the foreign-born population - El Salvador (%)
Place of birth for the foreign-born population - Guatemala (%)
Place of birth for the foreign-born population - Honduras (%)
Place of birth for the foreign-born population - Mexico (%)
Place of birth for the foreign-born population - Nicaragua (%)
Place of birth for the foreign-born population - Panama (%)
Place of birth for the foreign-born population - Other Central America (%)
Place of birth for the foreign-born population - Argentina (%)
Place of birth for the foreign-born population - Bolivia (%)
Place of birth for the foreign-born population - Brazil (%)
Place of birth for the foreign-born population - Chile (%)
Place of birth for the foreign-born population - Colombia (%)
Place of birth for the foreign-born population - Ecuador (%)
Place of birth for the foreign-born population - Guyana (%)
Place of birth for the foreign-born population - Peru (%)
Place of birth for the foreign-born population - Uruguay (%)
Place of birth for the foreign-born population - Venezuela (%)
Place of birth for the foreign-born population - Other South America (%)
Place of birth for the foreign-born population - Canada (%)
Place of birth for the foreign-born population - Other Northern America (%)
Place of birth for the foreign-born population - Other (%)
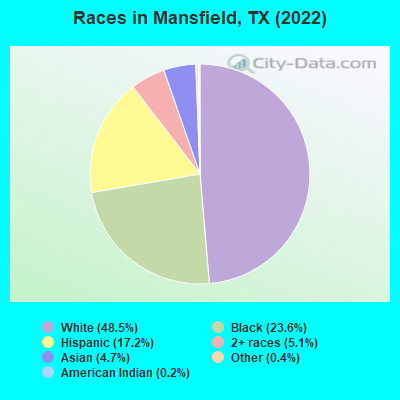
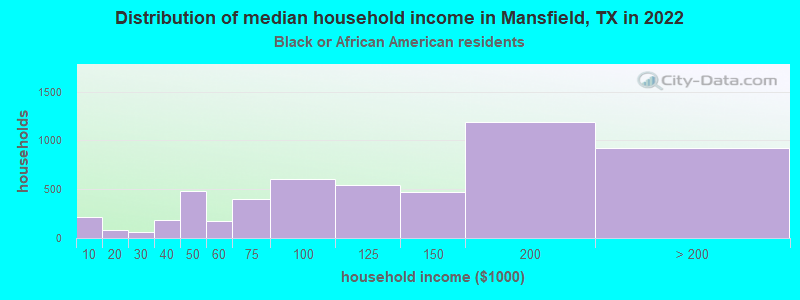
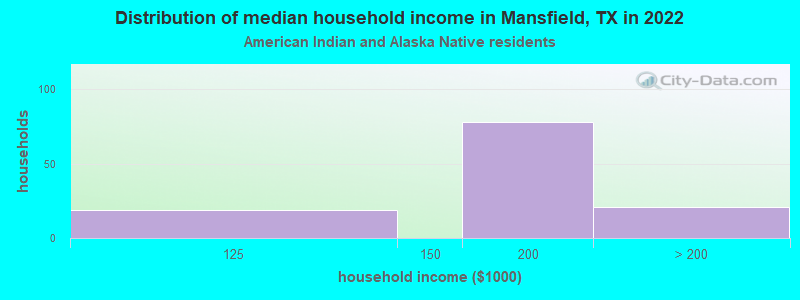
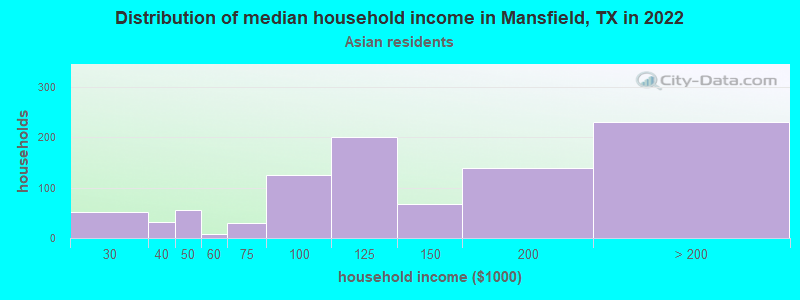
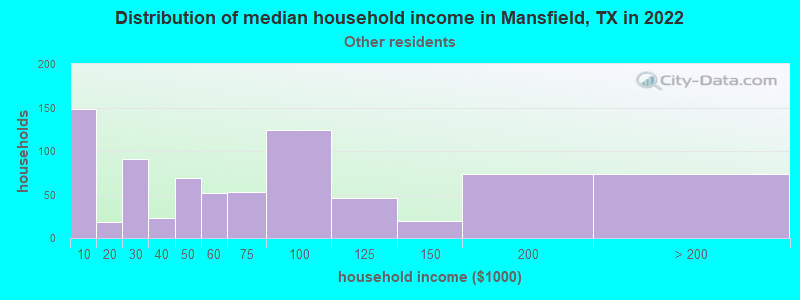
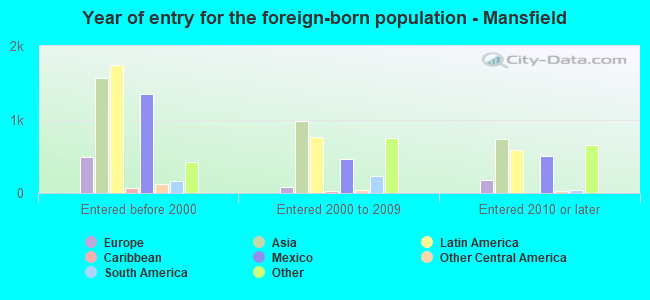
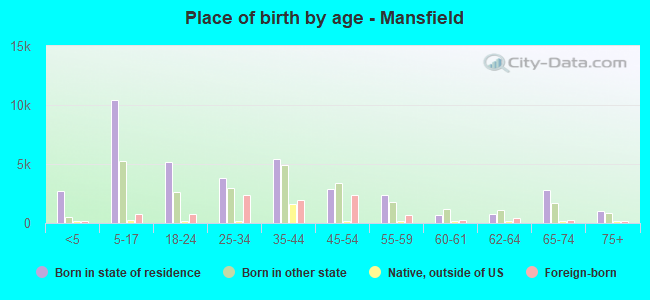
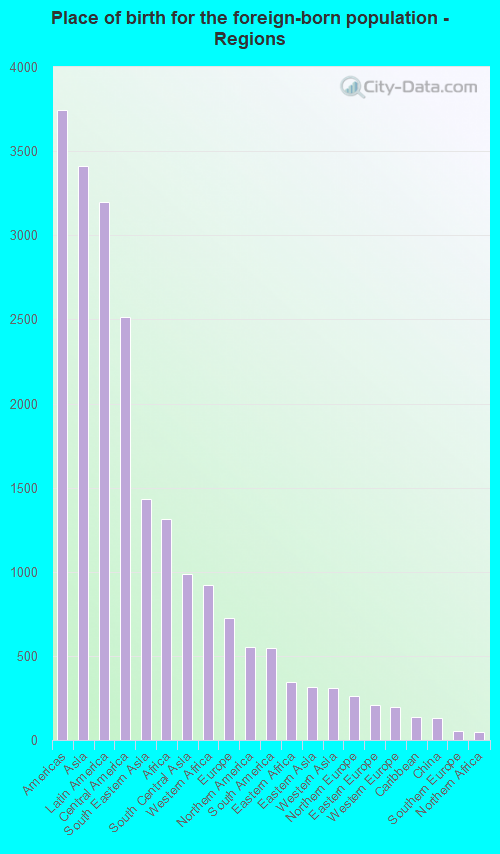
According to 2022 data, the most numerous races in Mansfield, TX are Hispanic (12,941 residents), White alone (36,428 residents), and Black alone (17,705 residents). 81.4% of Mansfield residents speak English at home. 12.3% of Mansfield, TX residents are foreign-born (4.5% born in Asia, 4.2% born in Latin America, 1.7% born in Africa), which is 38.8% less than the foreign-born rate of 17.0% across the entire state of Texas.
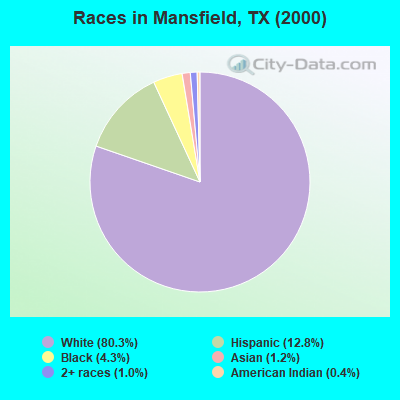
Race distribution in Mansfield
2000 2022
10,933,313 52.4% White alone 6,669,666 32.0% Hispanic 2,364,255 11.3% Black alone 554,445 2.7% Asian alone 230,567 1.1% Two or more races 68,859 0.3% American Indian alone 19,958 0.10% Other race alone 10,757 0.05% Native Hawaiian and Other
12,070,642 40.2% Hispanic 11,683,430 38.9% White alone 3,508,706 11.7% Black alone 1,608,173 5.4% Asian alone 956,560 3.2% Two or more races 125,763 0.4% Other race alone 47,023 0.2% American Indian alone 29,275 0.10% Native Hawaiian and Other
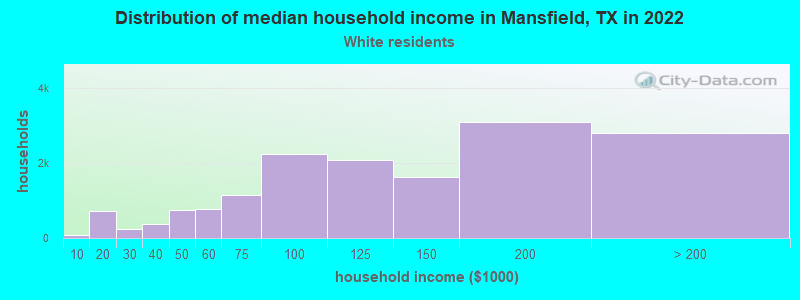
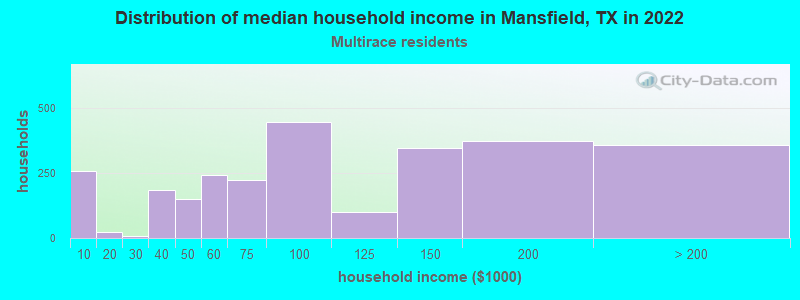
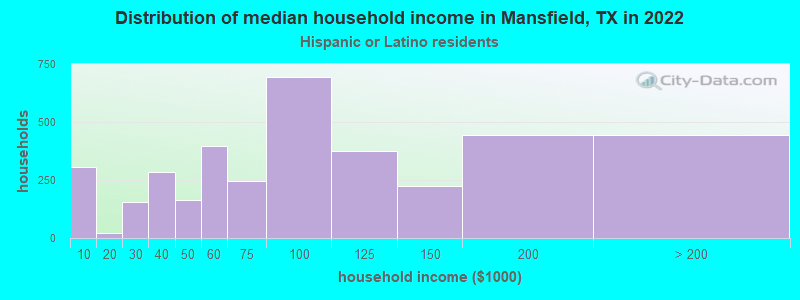
Income and house value in Mansfield Median household income in 2022 $125,678 White non-Hispanic householders$151,472 Black householders$112,559 Asian householders$58,397 Some other race householders$82,633 Two or more races householders$68,770 Hispanic or Latino race householdersMedian 2022 house value $441,169 White Non-Hispanic householders$400,066 Black or African American householders$267,167 American Indian or Alaska Native householders $642,230 Asian householders$264,085 Some other race householders$505,906 Two or more races householders$268,880 Hispanic or Latino householders
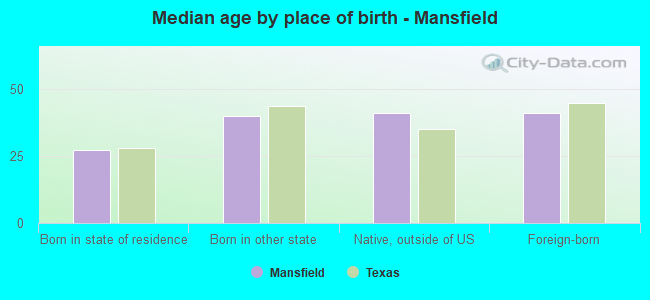
Median age by race in Mansfield
37.4 Median age for White residents36.3 38.4 37.2 Median age for Black or African American residents26.1 39.2 42.7 Median age for American Indian / Alaska Native residents-666,666,666.0 -666,666,666.0 31.9 Median age for Asian residents25.9 40.6 -666,666,666.0 Median age for Native Hawaiian / Pacific Islander residents-666,666,666.0 -666,666,666.0 37.2 Median age for Other race residents33.5 40.2 20.4 Median age for Two or more races residents16.3 25.2 39.1 Median age for White alone residents37.1 39.6 25.9 Median age for Hispanic or Latino residents25.5 26.3
Owner/renter occupied households by race in Mansfield
House owners and renters - White residents 12,242 77.2% Owner occupied3,611 22.8% Renter occupiedHouse owners and renters - Black or African American residents 2,543 64.8% Owner occupied1,380 35.2% Renter occupiedHouse owners and renters - American Indian / Alaska Native residents 125 100.0% Owner occupiedHouse owners and renters - Asian residents 906 90.5% Owner occupied95 9.5% Renter occupiedHouse owners and renters - Other race residents 619 82.1% Owner occupied135 17.9% Renter occupiedHouse owners and renters - Two or more races residents 1,346 58.1% Owner occupied970 41.9% Renter occupiedHouse owners and renters - White alone residents 11,642 79.4% Owner occupied3,019 20.6% Renter occupiedHouse owners and renters - Hispanic or Latino residents 2,234 63.2% Owner occupied1,302 36.8% Renter occupied
Language usage in Mansfield
English speakers - Total 81.4% of residents of Mansfield speak English at home.
10.0% of residents speak Spanish at home 5,992 81.9% Speak English very well1,320 18.1% Speak English less than very well8.7% of residents speak other language at home 4,186 65.8% Speak English very well2,173 34.2% Speak English less than very well
English speakers - Born in the United States 89.6% of residents of Mansfield speak English at home.
8.2% of residents speak Spanish at home 1,649 78.3% Speak English very well457 21.7% Speak English less than very well2.3% of residents speak other language at home 423 71.8% Speak English very well166 28.2% Speak English less than very well
English speakers - Native, born elsewhere 73.5% of residents of Mansfield speak English at home.
23.2% of residents speak Spanish at home 557 100.0% Speak English very well3.4% of residents speak other language at home 81 100.0% Speak English very well
English speakers - Foreign-born 15.8% of residents of Mansfield speak English at home.
29.5% of residents speak Spanish at home 2,434 82.8% Speak English very well506 17.2% Speak English less than very well54.7% of residents speak other language at home 3,549 65.1% Speak English very well1,906 34.9% Speak English less than very well
White (Caucasian) - Speak only English Native:
93.3% (37,804)Foreign-born:
11.6% (271)
White (Caucasian) - Speak another language Native:
6.7% (2,707)Foreign-born:
88.4% (2,058)
Black or African American - Speak only English Native:
98.2% (12,594)Foreign-born:
27.9% (711)
Black or African American - Speak another language Native:
1.8% (226)Foreign-born:
72.1% (1,834)
American Indian / Alaska Native - Speak another language Native:
52.0% (129)Foreign-born:
100.0% (14)
Asian - Speak only English Native:
64.2% (952)Foreign-born:
14.8% (481)
Asian - Speak another language Native:
35.8% (532)Foreign-born:
85.2% (2,759)
Other race - Speak only English Native:
56.9% (870)Foreign-born:
9.4% (65)
Other race - Speak another language Native:
46.2% (707)Foreign-born:
91.0% (632)
Two or more races - Speak only English Native:
78.4% (5,180)Foreign-born:
7.1% (118)
Two or more races - Speak another language Native:
21.6% (1,425)Foreign-born:
92.9% (1,541)
White alone - Speak only English Native:
99.0% (36,884)Foreign-born:
26.4% (271)
White alone - Speak another language Native:
1.0% (385)Foreign-born:
73.6% (754)
Hispanic or Latino - Speak only English Native:
56.2% (5,276)Foreign-born:
3.7% (118)
Hispanic or Latino - Speak another language Native:
43.8% (4,117)Foreign-born:
96.3% (3,048)
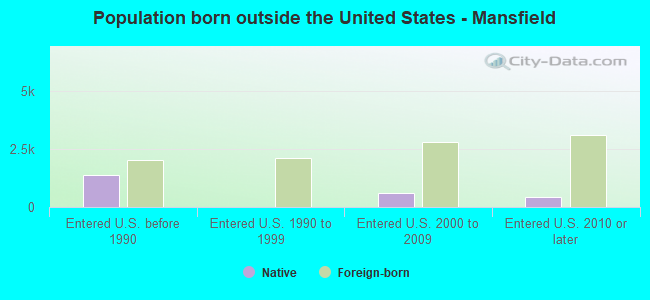
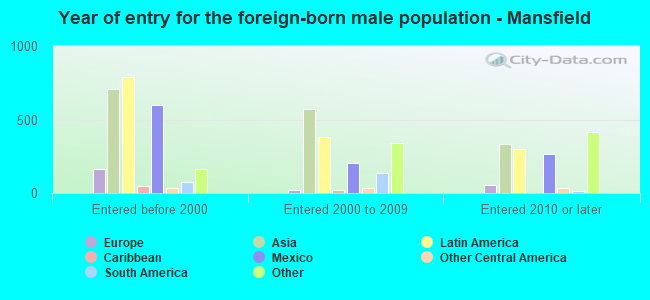
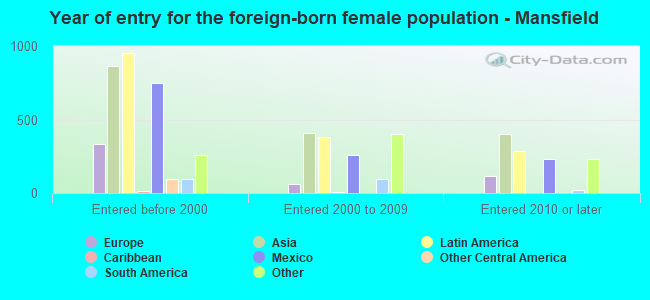
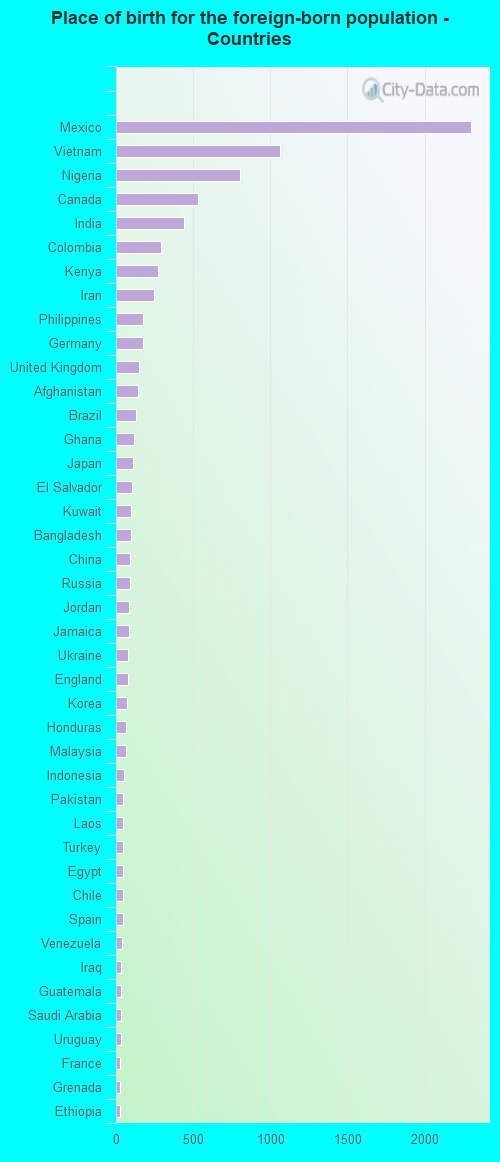
Foreign-born residents in Mansfield 9,201 residents are foreign born (4.5% Asia , 4.2% Latin America , 1.7% Africa ).
This city:
12.3%Texas:
17.1%
Marital status for residents in Mansfield Marital status - White (Caucasian) population 15 years and over
Males 27.7% Never married67.7% Now married0.0% Separated0.5% Widowed4.1% DivorcedFemales 16.4% Never married61.1% Now married0.2% Separated6.5% Widowed15.8% DivorcedWomen who gave birth in the past 12 months Now married:
100.0% (355)Unmarried:
0.0% (0)
Women who did not give birth in the past 12 months Now married:
59.7% (5,821)Unmarried:
40.3% (3,924)
Marital status - Black or African American population 15 years and over
Males 59.5% Never married37.2% Now married0.0% Separated0.3% Widowed3.0% DivorcedFemales 50.2% Never married28.2% Now married0.0% Separated9.7% Widowed11.9% DivorcedWomen who gave birth in the past 12 months Now married:
100.0% (33)Unmarried:
0.0% (0)
Women who did not give birth in the past 12 months Now married:
36.8% (1,805)Unmarried:
63.2% (3,096)
Marital status - American Indian / Alaska Native population 15 years and over
Males 33.3% Never married66.7% Now married0.0% Separated0.0% Widowed0.0% DivorcedFemales 37.3% Never married56.7% Now married0.0% Separated0.0% Widowed6.0% DivorcedWomen who did not give birth in the past 12 months Now married:
57.6% (49)Unmarried:
42.4% (36)
Marital status - Asian population 15 years and over
Males 35.2% Never married58.6% Now married0.4% Separated1.1% Widowed4.6% DivorcedFemales 25.3% Never married59.0% Now married3.8% Separated6.2% Widowed5.8% DivorcedWomen who gave birth in the past 12 months Now married:
100.0% (36)Unmarried:
0.0% (0)
Women who did not give birth in the past 12 months Now married:
58.9% (701)Unmarried:
41.1% (490)
Marital status - Other race population 15 years and over
Males 40.9% Never married53.2% Now married2.6% Separated1.4% Widowed1.9% DivorcedFemales 34.2% Never married48.7% Now married0.0% Separated4.5% Widowed12.5% DivorcedWomen who gave birth in the past 12 months Now married:
100.0% (11)Unmarried:
0.0% (0)
Women who did not give birth in the past 12 months Now married:
32.1% (204)Unmarried:
67.9% (432)
Marital status - Two or more races population 15 years and over
Males 45.2% Never married48.9% Now married2.9% Separated0.0% Widowed2.9% DivorcedFemales 39.5% Never married52.5% Now married0.8% Separated3.7% Widowed3.5% DivorcedWomen who gave birth in the past 12 months Now married:
100.0% (200)Unmarried:
0.0% (0)
Women who did not give birth in the past 12 months Now married:
46.1% (1,263)Unmarried:
53.9% (1,474)
Marital status - White alone, not Hispanic / Latino population 15 years and over
Males 27.0% Never married67.9% Now married0.0% Separated0.6% Widowed4.6% DivorcedFemales 15.5% Never married60.2% Now married0.2% Separated7.1% Widowed17.0% DivorcedWomen who gave birth in the past 12 months Now married:
100.0% (165)Unmarried:
0.0% (0)
Women who did not give birth in the past 12 months Now married:
60.0% (5,237)Unmarried:
40.0% (3,492)
Marital status - Hispanic or Latino population 15 years and over
Males 38.6% Never married55.4% Now married1.2% Separated1.1% Widowed3.7% DivorcedFemales 37.2% Never married49.6% Now married0.8% Separated1.9% Widowed10.6% DivorcedWomen who gave birth in the past 12 months Now married:
100.0% (188)Unmarried:
0.0% (0)
Women who did not give birth in the past 12 months Now married:
40.5% (1,398)Unmarried:
59.5% (2,057)
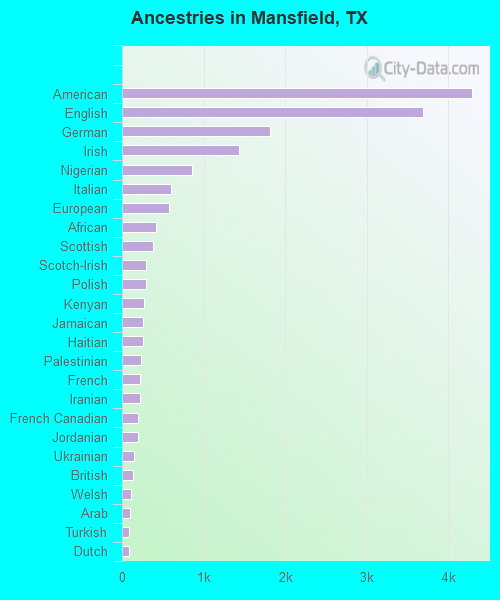
Ancestries in Mansfield
4,285 10.5% American3,687 9.1% English1,809 4.5% German1,436 3.5% Irish857 2.1% Nigerian604 1.5% Italian571 1.4% European414 1.0% African383 0.9% Scottish291 0.7% Scotch-Irish291 0.7% Polish272 0.7% Kenyan263 0.6% Jamaican258 0.6% Haitian234 0.6% Palestinian216 0.5% French215 0.5% Iranian194 0.5% French Canadian193 0.5% Jordanian146 0.4% Ukrainian140 0.3% British110 0.3% Welsh95 0.2% Arab83 0.2% Turkish80 0.2% Dutch79 0.2% Norwegian72 0.2% Finnish72 0.2% Czech66 0.2% Northern European58 0.1% Egyptian53 0.1% Swedish53 0.1% U.S. Virgin Islander51 0.1% Brazilian46 0.1% Russian40 0.10% Greek37 0.09% Lebanese37 0.09% Danish36 0.09% Canadian33 0.08% Ghanaian32 0.08% Portuguese27 0.07% Iraqi24 0.06% Swiss22 0.05% Ethiopian19 0.05% West Indian18 0.04% Bahamian17 0.04% Eastern European14 0.03% Czechoslovakian13 0.03% Cape Verdean11 0.03% Scandinavian10 0.02% Austrian9 0.02% Hungarian8 0.02% Croatian6 0.01% Armenian5 0.01% Romanian4 0.01% Slovak
Geographical mobility in Mansfield Same house 1 year ago 39,695 88.6% White (Caucasian)15,749 87.3% Black or African American278 98.3% American Indian / Alaska Native3,209 90.9% Asian49 98.2% Native Hawaiian / Pacific Islander1,955 87.2% Other race8,623 76.0% Two or more races34,984 87.2% White alone, not Hispanic / Latino11,030 86.3% Hispanic or LatinoMoved within same county 2,561 5.7% White / Caucasian1,073 5.9% Black or African American176 5.0% Asian172 7.7% Other race1,167 10.3% Two or more races2,561 6.4% White alone, not Hispanic / Latino788 6.2% Hispanic or LatinoMoved within same state 970 2.2% White / Caucasian771 4.3% Black or African American13 0.4% Asian49 2.2% Other race745 6.6% Two or more races970 2.4% White alone, not Hispanic / Latino553 4.3% Hispanic or LatinoMoved from different state 1,586 3.5% White / Caucasian235 1.3% Black or African American13 4.6% American Indian / Alaska Native101 2.8% Asian14 0.6% Other race757 6.7% Two or more races1,586 4.0% White alone, not Hispanic / Latino321 2.5% Hispanic or LatinoMoved from abroad 9 0.1% Black or African American21 0.6% Asian22 1.0% Other race58 0.5% Hispanic or Latino
Children Nativity (place of birth) in Mansfield
Children under 6 years - Living with two parents Both parents native 1,955 100.0% NativeBoth parents foreign-born 718 96.4% Native27 3.6% Foreign-bornOne native, one foreign-born parent 433 100.0% NativeChildren under 6 years - Living with one parent Native parent 880 100.0% NativeForeign-born parent 56 100.0% NativeChildren 6 to 17 years - Living with two parents Both parents native 8,686 99.3% Native58 0.7% Foreign-bornBoth parents foreign-born 1,741 93.5% Native121 6.5% Foreign-bornOne native, one foreign-born parent 1,265 100.0% NativeChildren 6 to 17 years - Living with one parent Native parent 3,343 100.0% NativeForeign-born parent 462 53.5% Native402 46.5% Foreign-born
Grandparents responsible for own grandchildren in Mansfield
Grandparents (30 to 59 years) White / Caucasian 47 19.0% Responsible for grandchildren202 81.0% Not responsible for grandchildrenBlack or African American 118 48.7% Responsible for grandchildren125 51.3% Not responsible for grandchildrenOther race 5 100.0% Not responsible for grandchildrenTwo or more races 35 66.9% Responsible for grandchildren17 33.1% Not responsible for grandchildrenWhite alone, not Hispanic / Latino 57 25.4% Responsible for grandchildren168 74.6% Not responsible for grandchildrenHispanic or Latino 17 12.9% Responsible for grandchildren114 87.1% Not responsible for grandchildrenGrandparents (60 years and over) White / Caucasian 70 12.2% Responsible for grandchildren504 87.8% Not responsible for grandchildrenBlack or African American 164 40.6% Responsible for grandchildren240 59.4% Not responsible for grandchildrenOther race 45 100.0% Not responsible for grandchildrenTwo or more races 12 100.0% Not responsible for grandchildrenWhite alone, not Hispanic / Latino 75 14.6% Responsible for grandchildren442 85.4% Not responsible for grandchildrenHispanic or Latino 165 100.0% Not responsible for grandchildren