Mansfield, Texas Submit your own pictures of this city and show them to the world
OSM Map
General Map
Google Map
MSN Map
OSM Map
General Map
Google Map
MSN Map
OSM Map
General Map
Google Map
MSN Map
OSM Map
General Map
Google Map
MSN Map
Please wait while loading the map...
Population in 2022: 76,724 (98% urban, 2% rural). Population change since 2000: +173.7%Males: 36,683 Females: 40,041
March 2022 cost of living index in Mansfield: 96.1 (near average, U.S. average is 100) Percentage of residents living in poverty in 2022: 5.5%for White Non-Hispanic residents , 3.7% for Black residents , 9.6% for Hispanic or Latino residents , 9.3% for American Indian residents , 8.2% for other race residents , 12.5% for two or more races residents )
Profiles of local businesses
Business Search - 14 Million verified businesses
Data:
Median household income ($)
Median household income (% change since 2000)
Household income diversity
Ratio of average income to average house value (%)
Ratio of average income to average rent
Median household income ($) - White
Median household income ($) - Black or African American
Median household income ($) - Asian
Median household income ($) - Hispanic or Latino
Median household income ($) - American Indian and Alaska Native
Median household income ($) - Multirace
Median household income ($) - Other Race
Median household income for houses/condos with a mortgage ($)
Median household income for apartments without a mortgage ($)
Races - White alone (%)
Races - White alone (% change since 2000)
Races - Black alone (%)
Races - Black alone (% change since 2000)
Races - American Indian alone (%)
Races - American Indian alone (% change since 2000)
Races - Asian alone (%)
Races - Asian alone (% change since 2000)
Races - Hispanic (%)
Races - Hispanic (% change since 2000)
Races - Native Hawaiian and Other Pacific Islander alone (%)
Races - Native Hawaiian and Other Pacific Islander alone (% change since 2000)
Races - Two or more races (%)
Races - Two or more races (% change since 2000)
Races - Other race alone (%)
Races - Other race alone (% change since 2000)
Racial diversity
Unemployment (%)
Unemployment (% change since 2000)
Unemployment (%) - White
Unemployment (%) - Black or African American
Unemployment (%) - Asian
Unemployment (%) - Hispanic or Latino
Unemployment (%) - American Indian and Alaska Native
Unemployment (%) - Multirace
Unemployment (%) - Other Race
Population density (people per square mile)
Population - Males (%)
Population - Females (%)
Population - Males (%) - White
Population - Males (%) - Black or African American
Population - Males (%) - Asian
Population - Males (%) - Hispanic or Latino
Population - Males (%) - American Indian and Alaska Native
Population - Males (%) - Multirace
Population - Males (%) - Other Race
Population - Females (%) - White
Population - Females (%) - Black or African American
Population - Females (%) - Asian
Population - Females (%) - Hispanic or Latino
Population - Females (%) - American Indian and Alaska Native
Population - Females (%) - Multirace
Population - Females (%) - Other Race
Coronavirus confirmed cases (Apr 27, 2024)
Deaths caused by coronavirus (Apr 27, 2024)
Coronavirus confirmed cases (per 100k population) (Apr 27, 2024)
Deaths caused by coronavirus (per 100k population) (Apr 27, 2024)
Daily increase in number of cases (Apr 27, 2024)
Weekly increase in number of cases (Apr 27, 2024)
Cases doubled (in days) (Apr 27, 2024)
Hospitalized patients (Apr 18, 2022)
Negative test results (Apr 18, 2022)
Total test results (Apr 18, 2022)
COVID Vaccine doses distributed (per 100k population) (Sep 19, 2023)
COVID Vaccine doses administered (per 100k population) (Sep 19, 2023)
COVID Vaccine doses distributed (Sep 19, 2023)
COVID Vaccine doses administered (Sep 19, 2023)
Likely homosexual households (%)
Likely homosexual households (% change since 2000)
Likely homosexual households - Lesbian couples (%)
Likely homosexual households - Lesbian couples (% change since 2000)
Likely homosexual households - Gay men (%)
Likely homosexual households - Gay men (% change since 2000)
Cost of living index
Median gross rent ($)
Median contract rent ($)
Median monthly housing costs ($)
Median house or condo value ($)
Median house or condo value ($ change since 2000)
Mean house or condo value by units in structure - 1, detached ($)
Mean house or condo value by units in structure - 1, attached ($)
Mean house or condo value by units in structure - 2 ($)
Mean house or condo value by units in structure by units in structure - 3 or 4 ($)
Mean house or condo value by units in structure - 5 or more ($)
Mean house or condo value by units in structure - Boat, RV, van, etc. ($)
Mean house or condo value by units in structure - Mobile home ($)
Median house or condo value ($) - White
Median house or condo value ($) - Black or African American
Median house or condo value ($) - Asian
Median house or condo value ($) - Hispanic or Latino
Median house or condo value ($) - American Indian and Alaska Native
Median house or condo value ($) - Multirace
Median house or condo value ($) - Other Race
Median resident age
Resident age diversity
Median resident age - Males
Median resident age - Females
Median resident age - White
Median resident age - Black or African American
Median resident age - Asian
Median resident age - Hispanic or Latino
Median resident age - American Indian and Alaska Native
Median resident age - Multirace
Median resident age - Other Race
Median resident age - Males - White
Median resident age - Males - Black or African American
Median resident age - Males - Asian
Median resident age - Males - Hispanic or Latino
Median resident age - Males - American Indian and Alaska Native
Median resident age - Males - Multirace
Median resident age - Males - Other Race
Median resident age - Females - White
Median resident age - Females - Black or African American
Median resident age - Females - Asian
Median resident age - Females - Hispanic or Latino
Median resident age - Females - American Indian and Alaska Native
Median resident age - Females - Multirace
Median resident age - Females - Other Race
Commute - mean travel time to work (minutes)
Travel time to work - Less than 5 minutes (%)
Travel time to work - Less than 5 minutes (% change since 2000)
Travel time to work - 5 to 9 minutes (%)
Travel time to work - 5 to 9 minutes (% change since 2000)
Travel time to work - 10 to 19 minutes (%)
Travel time to work - 10 to 19 minutes (% change since 2000)
Travel time to work - 20 to 29 minutes (%)
Travel time to work - 20 to 29 minutes (% change since 2000)
Travel time to work - 30 to 39 minutes (%)
Travel time to work - 30 to 39 minutes (% change since 2000)
Travel time to work - 40 to 59 minutes (%)
Travel time to work - 40 to 59 minutes (% change since 2000)
Travel time to work - 60 to 89 minutes (%)
Travel time to work - 60 to 89 minutes (% change since 2000)
Travel time to work - 90 or more minutes (%)
Travel time to work - 90 or more minutes (% change since 2000)
Marital status - Never married (%)
Marital status - Now married (%)
Marital status - Separated (%)
Marital status - Widowed (%)
Marital status - Divorced (%)
Median family income ($)
Median family income (% change since 2000)
Median non-family income ($)
Median non-family income (% change since 2000)
Median per capita income ($)
Median per capita income (% change since 2000)
Median family income ($) - White
Median family income ($) - Black or African American
Median family income ($) - Asian
Median family income ($) - Hispanic or Latino
Median family income ($) - American Indian and Alaska Native
Median family income ($) - Multirace
Median family income ($) - Other Race
Median year house/condo built
Median year apartment built
Year house built - Built 2005 or later (%)
Year house built - Built 2000 to 2004 (%)
Year house built - Built 1990 to 1999 (%)
Year house built - Built 1980 to 1989 (%)
Year house built - Built 1970 to 1979 (%)
Year house built - Built 1960 to 1969 (%)
Year house built - Built 1950 to 1959 (%)
Year house built - Built 1940 to 1949 (%)
Year house built - Built 1939 or earlier (%)
Average household size
Household density (households per square mile)
Average household size - White
Average household size - Black or African American
Average household size - Asian
Average household size - Hispanic or Latino
Average household size - American Indian and Alaska Native
Average household size - Multirace
Average household size - Other Race
Occupied housing units (%)
Vacant housing units (%)
Owner occupied housing units (%)
Renter occupied housing units (%)
Vacancy status - For rent (%)
Vacancy status - For sale only (%)
Vacancy status - Rented or sold, not occupied (%)
Vacancy status - For seasonal, recreational, or occasional use (%)
Vacancy status - For migrant workers (%)
Vacancy status - Other vacant (%)
Residents with income below the poverty level (%)
Residents with income below 50% of the poverty level (%)
Children below poverty level (%)
Poor families by family type - Married-couple family (%)
Poor families by family type - Male, no wife present (%)
Poor families by family type - Female, no husband present (%)
Poverty status for native-born residents (%)
Poverty status for foreign-born residents (%)
Poverty among high school graduates not in families (%)
Poverty among people who did not graduate high school not in families (%)
Residents with income below the poverty level (%) - White
Residents with income below the poverty level (%) - Black or African American
Residents with income below the poverty level (%) - Asian
Residents with income below the poverty level (%) - Hispanic or Latino
Residents with income below the poverty level (%) - American Indian and Alaska Native
Residents with income below the poverty level (%) - Multirace
Residents with income below the poverty level (%) - Other Race
Air pollution - Air Quality Index (AQI)
Air pollution - CO
Air pollution - NO2
Air pollution - SO2
Air pollution - Ozone
Air pollution - PM10
Air pollution - PM25
Air pollution - Pb
Crime - Murders per 100,000 population
Crime - Rapes per 100,000 population
Crime - Robberies per 100,000 population
Crime - Assaults per 100,000 population
Crime - Burglaries per 100,000 population
Crime - Thefts per 100,000 population
Crime - Auto thefts per 100,000 population
Crime - Arson per 100,000 population
Crime - City-data.com crime index
Crime - Violent crime index
Crime - Property crime index
Crime - Murders per 100,000 population (5 year average)
Crime - Rapes per 100,000 population (5 year average)
Crime - Robberies per 100,000 population (5 year average)
Crime - Assaults per 100,000 population (5 year average)
Crime - Burglaries per 100,000 population (5 year average)
Crime - Thefts per 100,000 population (5 year average)
Crime - Auto thefts per 100,000 population (5 year average)
Crime - Arson per 100,000 population (5 year average)
Crime - City-data.com crime index (5 year average)
Crime - Violent crime index (5 year average)
Crime - Property crime index (5 year average)
1996 Presidential Elections Results (%) - Democratic Party (Clinton)
1996 Presidential Elections Results (%) - Republican Party (Dole)
1996 Presidential Elections Results (%) - Other
2000 Presidential Elections Results (%) - Democratic Party (Gore)
2000 Presidential Elections Results (%) - Republican Party (Bush)
2000 Presidential Elections Results (%) - Other
2004 Presidential Elections Results (%) - Democratic Party (Kerry)
2004 Presidential Elections Results (%) - Republican Party (Bush)
2004 Presidential Elections Results (%) - Other
2008 Presidential Elections Results (%) - Democratic Party (Obama)
2008 Presidential Elections Results (%) - Republican Party (McCain)
2008 Presidential Elections Results (%) - Other
2012 Presidential Elections Results (%) - Democratic Party (Obama)
2012 Presidential Elections Results (%) - Republican Party (Romney)
2012 Presidential Elections Results (%) - Other
2016 Presidential Elections Results (%) - Democratic Party (Clinton)
2016 Presidential Elections Results (%) - Republican Party (Trump)
2016 Presidential Elections Results (%) - Other
2020 Presidential Elections Results (%) - Democratic Party (Biden)
2020 Presidential Elections Results (%) - Republican Party (Trump)
2020 Presidential Elections Results (%) - Other
Ancestries Reported - Arab (%)
Ancestries Reported - Czech (%)
Ancestries Reported - Danish (%)
Ancestries Reported - Dutch (%)
Ancestries Reported - English (%)
Ancestries Reported - French (%)
Ancestries Reported - French Canadian (%)
Ancestries Reported - German (%)
Ancestries Reported - Greek (%)
Ancestries Reported - Hungarian (%)
Ancestries Reported - Irish (%)
Ancestries Reported - Italian (%)
Ancestries Reported - Lithuanian (%)
Ancestries Reported - Norwegian (%)
Ancestries Reported - Polish (%)
Ancestries Reported - Portuguese (%)
Ancestries Reported - Russian (%)
Ancestries Reported - Scotch-Irish (%)
Ancestries Reported - Scottish (%)
Ancestries Reported - Slovak (%)
Ancestries Reported - Subsaharan African (%)
Ancestries Reported - Swedish (%)
Ancestries Reported - Swiss (%)
Ancestries Reported - Ukrainian (%)
Ancestries Reported - United States (%)
Ancestries Reported - Welsh (%)
Ancestries Reported - West Indian (%)
Ancestries Reported - Other (%)
Educational Attainment - No schooling completed (%)
Educational Attainment - Less than high school (%)
Educational Attainment - High school or equivalent (%)
Educational Attainment - Less than 1 year of college (%)
Educational Attainment - 1 or more years of college (%)
Educational Attainment - Associate degree (%)
Educational Attainment - Bachelor's degree (%)
Educational Attainment - Master's degree (%)
Educational Attainment - Professional school degree (%)
Educational Attainment - Doctorate degree (%)
School Enrollment - Nursery, preschool (%)
School Enrollment - Kindergarten (%)
School Enrollment - Grade 1 to 4 (%)
School Enrollment - Grade 5 to 8 (%)
School Enrollment - Grade 9 to 12 (%)
School Enrollment - College undergrad (%)
School Enrollment - Graduate or professional (%)
School Enrollment - Not enrolled in school (%)
School enrollment - Public schools (%)
School enrollment - Private schools (%)
School enrollment - Not enrolled (%)
Median number of rooms in houses and condos
Median number of rooms in apartments
Housing units lacking complete plumbing facilities (%)
Housing units lacking complete kitchen facilities (%)
Density of houses
Urban houses (%)
Rural houses (%)
Households with people 60 years and over (%)
Households with people 65 years and over (%)
Households with people 75 years and over (%)
Households with one or more nonrelatives (%)
Households with no nonrelatives (%)
Population in households (%)
Family households (%)
Nonfamily households (%)
Population in families (%)
Family households with own children (%)
Median number of bedrooms in owner occupied houses
Mean number of bedrooms in owner occupied houses
Median number of bedrooms in renter occupied houses
Mean number of bedrooms in renter occupied houses
Median number of vehichles in owner occupied houses
Mean number of vehichles in owner occupied houses
Median number of vehichles in renter occupied houses
Mean number of vehichles in renter occupied houses
Mortgage status - with mortgage (%)
Mortgage status - with second mortgage (%)
Mortgage status - with home equity loan (%)
Mortgage status - with both second mortgage and home equity loan (%)
Mortgage status - without a mortgage (%)
Average family size
Average family size - White
Average family size - Black or African American
Average family size - Asian
Average family size - Hispanic or Latino
Average family size - American Indian and Alaska Native
Average family size - Multirace
Average family size - Other Race
Geographical mobility - Same house 1 year ago (%)
Geographical mobility - Moved within same county (%)
Geographical mobility - Moved from different county within same state (%)
Geographical mobility - Moved from different state (%)
Geographical mobility - Moved from abroad (%)
Place of birth - Born in state of residence (%)
Place of birth - Born in other state (%)
Place of birth - Native, outside of US (%)
Place of birth - Foreign born (%)
Housing units in structures - 1, detached (%)
Housing units in structures - 1, attached (%)
Housing units in structures - 2 (%)
Housing units in structures - 3 or 4 (%)
Housing units in structures - 5 to 9 (%)
Housing units in structures - 10 to 19 (%)
Housing units in structures - 20 to 49 (%)
Housing units in structures - 50 or more (%)
Housing units in structures - Mobile home (%)
Housing units in structures - Boat, RV, van, etc. (%)
House/condo owner moved in on average (years ago)
Renter moved in on average (years ago)
Year householder moved into unit - Moved in 1999 to March 2000 (%)
Year householder moved into unit - Moved in 1995 to 1998 (%)
Year householder moved into unit - Moved in 1990 to 1994 (%)
Year householder moved into unit - Moved in 1980 to 1989 (%)
Year householder moved into unit - Moved in 1970 to 1979 (%)
Year householder moved into unit - Moved in 1969 or earlier (%)
Means of transportation to work - Drove car alone (%)
Means of transportation to work - Carpooled (%)
Means of transportation to work - Public transportation (%)
Means of transportation to work - Bus or trolley bus (%)
Means of transportation to work - Streetcar or trolley car (%)
Means of transportation to work - Subway or elevated (%)
Means of transportation to work - Railroad (%)
Means of transportation to work - Ferryboat (%)
Means of transportation to work - Taxicab (%)
Means of transportation to work - Motorcycle (%)
Means of transportation to work - Bicycle (%)
Means of transportation to work - Walked (%)
Means of transportation to work - Other means (%)
Working at home (%)
Industry diversity
Most Common Industries - Agriculture, forestry, fishing and hunting, and mining (%)
Most Common Industries - Agriculture, forestry, fishing and hunting (%)
Most Common Industries - Mining, quarrying, and oil and gas extraction (%)
Most Common Industries - Construction (%)
Most Common Industries - Manufacturing (%)
Most Common Industries - Wholesale trade (%)
Most Common Industries - Retail trade (%)
Most Common Industries - Transportation and warehousing, and utilities (%)
Most Common Industries - Transportation and warehousing (%)
Most Common Industries - Utilities (%)
Most Common Industries - Information (%)
Most Common Industries - Finance and insurance, and real estate and rental and leasing (%)
Most Common Industries - Finance and insurance (%)
Most Common Industries - Real estate and rental and leasing (%)
Most Common Industries - Professional, scientific, and management, and administrative and waste management services (%)
Most Common Industries - Professional, scientific, and technical services (%)
Most Common Industries - Management of companies and enterprises (%)
Most Common Industries - Administrative and support and waste management services (%)
Most Common Industries - Educational services, and health care and social assistance (%)
Most Common Industries - Educational services (%)
Most Common Industries - Health care and social assistance (%)
Most Common Industries - Arts, entertainment, and recreation, and accommodation and food services (%)
Most Common Industries - Arts, entertainment, and recreation (%)
Most Common Industries - Accommodation and food services (%)
Most Common Industries - Other services, except public administration (%)
Most Common Industries - Public administration (%)
Occupation diversity
Most Common Occupations - Management, business, science, and arts occupations (%)
Most Common Occupations - Management, business, and financial occupations (%)
Most Common Occupations - Management occupations (%)
Most Common Occupations - Business and financial operations occupations (%)
Most Common Occupations - Computer, engineering, and science occupations (%)
Most Common Occupations - Computer and mathematical occupations (%)
Most Common Occupations - Architecture and engineering occupations (%)
Most Common Occupations - Life, physical, and social science occupations (%)
Most Common Occupations - Education, legal, community service, arts, and media occupations (%)
Most Common Occupations - Community and social service occupations (%)
Most Common Occupations - Legal occupations (%)
Most Common Occupations - Education, training, and library occupations (%)
Most Common Occupations - Arts, design, entertainment, sports, and media occupations (%)
Most Common Occupations - Healthcare practitioners and technical occupations (%)
Most Common Occupations - Health diagnosing and treating practitioners and other technical occupations (%)
Most Common Occupations - Health technologists and technicians (%)
Most Common Occupations - Service occupations (%)
Most Common Occupations - Healthcare support occupations (%)
Most Common Occupations - Protective service occupations (%)
Most Common Occupations - Fire fighting and prevention, and other protective service workers including supervisors (%)
Most Common Occupations - Law enforcement workers including supervisors (%)
Most Common Occupations - Food preparation and serving related occupations (%)
Most Common Occupations - Building and grounds cleaning and maintenance occupations (%)
Most Common Occupations - Personal care and service occupations (%)
Most Common Occupations - Sales and office occupations (%)
Most Common Occupations - Sales and related occupations (%)
Most Common Occupations - Office and administrative support occupations (%)
Most Common Occupations - Natural resources, construction, and maintenance occupations (%)
Most Common Occupations - Farming, fishing, and forestry occupations (%)
Most Common Occupations - Construction and extraction occupations (%)
Most Common Occupations - Installation, maintenance, and repair occupations (%)
Most Common Occupations - Production, transportation, and material moving occupations (%)
Most Common Occupations - Production occupations (%)
Most Common Occupations - Transportation occupations (%)
Most Common Occupations - Material moving occupations (%)
People in Group quarters - Institutionalized population (%)
People in Group quarters - Correctional institutions (%)
People in Group quarters - Federal prisons and detention centers (%)
People in Group quarters - Halfway houses (%)
People in Group quarters - Local jails and other confinement facilities (including police lockups) (%)
People in Group quarters - Military disciplinary barracks (%)
People in Group quarters - State prisons (%)
People in Group quarters - Other types of correctional institutions (%)
People in Group quarters - Nursing homes (%)
People in Group quarters - Hospitals/wards, hospices, and schools for the handicapped (%)
People in Group quarters - Hospitals/wards and hospices for chronically ill (%)
People in Group quarters - Hospices or homes for chronically ill (%)
People in Group quarters - Military hospitals or wards for chronically ill (%)
People in Group quarters - Other hospitals or wards for chronically ill (%)
People in Group quarters - Hospitals or wards for drug/alcohol abuse (%)
People in Group quarters - Mental (Psychiatric) hospitals or wards (%)
People in Group quarters - Schools, hospitals, or wards for the mentally retarded (%)
People in Group quarters - Schools, hospitals, or wards for the physically handicapped (%)
People in Group quarters - Institutions for the deaf (%)
People in Group quarters - Institutions for the blind (%)
People in Group quarters - Orthopedic wards and institutions for the physically handicapped (%)
People in Group quarters - Wards in general hospitals for patients who have no usual home elsewhere (%)
People in Group quarters - Wards in military hospitals for patients who have no usual home elsewhere (%)
People in Group quarters - Juvenile institutions (%)
People in Group quarters - Long-term care (%)
People in Group quarters - Homes for abused, dependent, and neglected children (%)
People in Group quarters - Residential treatment centers for emotionally disturbed children (%)
People in Group quarters - Training schools for juvenile delinquents (%)
People in Group quarters - Short-term care, detention or diagnostic centers for delinquent children (%)
People in Group quarters - Type of juvenile institution unknown (%)
People in Group quarters - Noninstitutionalized population (%)
People in Group quarters - College dormitories (includes college quarters off campus) (%)
People in Group quarters - Military quarters (%)
People in Group quarters - On base (%)
People in Group quarters - Barracks, unaccompanied personnel housing (UPH), (Enlisted/Officer), ;and similar group living quarters for military personnel (%)
People in Group quarters - Transient quarters for temporary residents (%)
People in Group quarters - Military ships (%)
People in Group quarters - Group homes (%)
People in Group quarters - Homes or halfway houses for drug/alcohol abuse (%)
People in Group quarters - Homes for the mentally ill (%)
People in Group quarters - Homes for the mentally retarded (%)
People in Group quarters - Homes for the physically handicapped (%)
People in Group quarters - Other group homes (%)
People in Group quarters - Religious group quarters (%)
People in Group quarters - Dormitories (%)
People in Group quarters - Agriculture workers' dormitories on farms (%)
People in Group quarters - Job Corps and vocational training facilities (%)
People in Group quarters - Other workers' dormitories (%)
People in Group quarters - Crews of maritime vessels (%)
People in Group quarters - Other nonhousehold living situations (%)
People in Group quarters - Other noninstitutional group quarters (%)
Residents speaking English at home (%)
Residents speaking English at home - Born in the United States (%)
Residents speaking English at home - Native, born elsewhere (%)
Residents speaking English at home - Foreign born (%)
Residents speaking Spanish at home (%)
Residents speaking Spanish at home - Born in the United States (%)
Residents speaking Spanish at home - Native, born elsewhere (%)
Residents speaking Spanish at home - Foreign born (%)
Residents speaking other language at home (%)
Residents speaking other language at home - Born in the United States (%)
Residents speaking other language at home - Native, born elsewhere (%)
Residents speaking other language at home - Foreign born (%)
Class of Workers - Employee of private company (%)
Class of Workers - Self-employed in own incorporated business (%)
Class of Workers - Private not-for-profit wage and salary workers (%)
Class of Workers - Local government workers (%)
Class of Workers - State government workers (%)
Class of Workers - Federal government workers (%)
Class of Workers - Self-employed workers in own not incorporated business and Unpaid family workers (%)
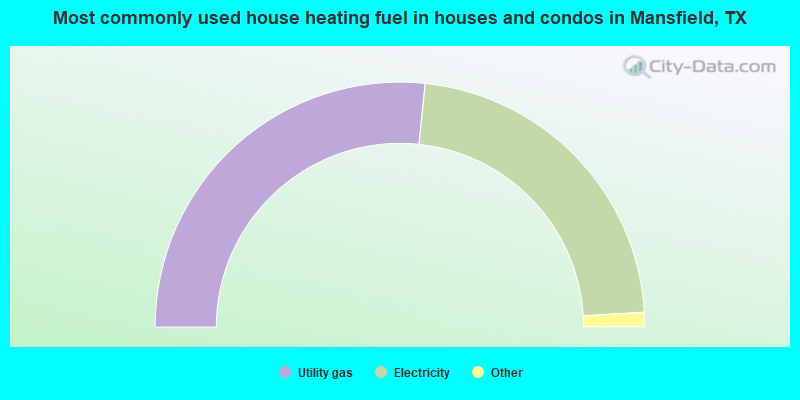
House heating fuel used in houses and condos - Utility gas (%)
House heating fuel used in houses and condos - Bottled, tank, or LP gas (%)
House heating fuel used in houses and condos - Electricity (%)
House heating fuel used in houses and condos - Fuel oil, kerosene, etc. (%)
House heating fuel used in houses and condos - Coal or coke (%)
House heating fuel used in houses and condos - Wood (%)
House heating fuel used in houses and condos - Solar energy (%)
House heating fuel used in houses and condos - Other fuel (%)
House heating fuel used in houses and condos - No fuel used (%)
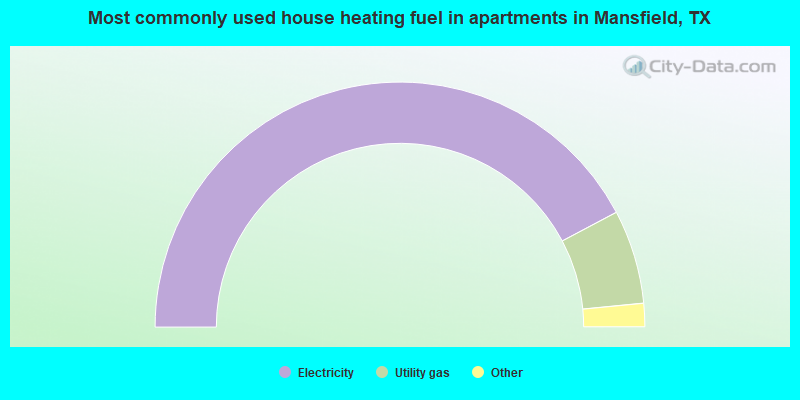
House heating fuel used in apartments - Utility gas (%)
House heating fuel used in apartments - Bottled, tank, or LP gas (%)
House heating fuel used in apartments - Electricity (%)
House heating fuel used in apartments - Fuel oil, kerosene, etc. (%)
House heating fuel used in apartments - Coal or coke (%)
House heating fuel used in apartments - Wood (%)
House heating fuel used in apartments - Solar energy (%)
House heating fuel used in apartments - Other fuel (%)
House heating fuel used in apartments - No fuel used (%)
Armed forces status - In Armed Forces (%)
Armed forces status - Civilian (%)
Armed forces status - Civilian - Veteran (%)
Armed forces status - Civilian - Nonveteran (%)
Fatal accidents locations in years 2005-2021
Fatal accidents locations in 2005
Fatal accidents locations in 2006
Fatal accidents locations in 2007
Fatal accidents locations in 2008
Fatal accidents locations in 2009
Fatal accidents locations in 2010
Fatal accidents locations in 2011
Fatal accidents locations in 2012
Fatal accidents locations in 2013
Fatal accidents locations in 2014
Fatal accidents locations in 2015
Fatal accidents locations in 2016
Fatal accidents locations in 2017
Fatal accidents locations in 2018
Fatal accidents locations in 2019
Fatal accidents locations in 2020
Fatal accidents locations in 2021
Alcohol use - People drinking some alcohol every month (%)
Alcohol use - People not drinking at all (%)
Alcohol use - Average days/month drinking alcohol
Alcohol use - Average drinks/week
Alcohol use - Average days/year people drink much
Audiometry - Average condition of hearing (%)
Audiometry - People that can hear a whisper from across a quiet room (%)
Audiometry - People that can hear normal voice from across a quiet room (%)
Audiometry - Ears ringing, roaring, buzzing (%)
Audiometry - Had a job exposure to loud noise (%)
Audiometry - Had off-work exposure to loud noise (%)
Blood Pressure & Cholesterol - Has high blood pressure (%)
Blood Pressure & Cholesterol - Checking blood pressure at home (%)
Blood Pressure & Cholesterol - Frequently checking blood cholesterol (%)
Blood Pressure & Cholesterol - Has high cholesterol level (%)
Consumer Behavior - Money monthly spent on food at supermarket/grocery store
Consumer Behavior - Money monthly spent on food at other stores
Consumer Behavior - Money monthly spent on eating out
Consumer Behavior - Money monthly spent on carryout/delivered foods
Consumer Behavior - Income spent on food at supermarket/grocery store (%)
Consumer Behavior - Income spent on food at other stores (%)
Consumer Behavior - Income spent on eating out (%)
Consumer Behavior - Income spent on carryout/delivered foods (%)
Current Health Status - General health condition (%)
Current Health Status - Blood donors (%)
Current Health Status - Has blood ever tested for HIV virus (%)
Current Health Status - Left-handed people (%)
Dermatology - People using sunscreen (%)
Diabetes - Diabetics (%)
Diabetes - Had a blood test for high blood sugar (%)
Diabetes - People taking insulin (%)
Diet Behavior & Nutrition - Diet health (%)
Diet Behavior & Nutrition - Milk product consumption (# of products/month)
Diet Behavior & Nutrition - Meals not home prepared (#/week)
Diet Behavior & Nutrition - Meals from fast food or pizza place (#/week)
Diet Behavior & Nutrition - Ready-to-eat foods (#/month)
Diet Behavior & Nutrition - Frozen meals/pizza (#/month)
Drug Use - People that ever used marijuana or hashish (%)
Drug Use - Ever used hard drugs (%)
Drug Use - Ever used any form of cocaine (%)
Drug Use - Ever used heroin (%)
Drug Use - Ever used methamphetamine (%)
Health Insurance - People covered by health insurance (%)
Kidney Conditions-Urology - Avg. # of times urinating at night
Medical Conditions - People with asthma (%)
Medical Conditions - People with anemia (%)
Medical Conditions - People with psoriasis (%)
Medical Conditions - People with overweight (%)
Medical Conditions - Elderly people having difficulties in thinking or remembering (%)
Medical Conditions - People who ever received blood transfusion (%)
Medical Conditions - People having trouble seeing even with glass/contacts (%)
Medical Conditions - People with arthritis (%)
Medical Conditions - People with gout (%)
Medical Conditions - People with congestive heart failure (%)
Medical Conditions - People with coronary heart disease (%)
Medical Conditions - People with angina pectoris (%)
Medical Conditions - People who ever had heart attack (%)
Medical Conditions - People who ever had stroke (%)
Medical Conditions - People with emphysema (%)
Medical Conditions - People with thyroid problem (%)
Medical Conditions - People with chronic bronchitis (%)
Medical Conditions - People with any liver condition (%)
Medical Conditions - People who ever had cancer or malignancy (%)
Mental Health - People who have little interest in doing things (%)
Mental Health - People feeling down, depressed, or hopeless (%)
Mental Health - People who have trouble sleeping or sleeping too much (%)
Mental Health - People feeling tired or having little energy (%)
Mental Health - People with poor appetite or overeating (%)
Mental Health - People feeling bad about themself (%)
Mental Health - People who have trouble concentrating on things (%)
Mental Health - People moving or speaking slowly or too fast (%)
Mental Health - People having thoughts they would be better off dead (%)
Oral Health - Average years since last visit a dentist
Oral Health - People embarrassed because of mouth (%)
Oral Health - People with gum disease (%)
Oral Health - General health of teeth and gums (%)
Oral Health - Average days a week using dental floss/device
Oral Health - Average days a week using mouthwash for dental problem
Oral Health - Average number of teeth
Pesticide Use - Households using pesticides to control insects (%)
Pesticide Use - Households using pesticides to kill weeds (%)
Physical Activity - People doing vigorous-intensity work activities (%)
Physical Activity - People doing moderate-intensity work activities (%)
Physical Activity - People walking or bicycling (%)
Physical Activity - People doing vigorous-intensity recreational activities (%)
Physical Activity - People doing moderate-intensity recreational activities (%)
Physical Activity - Average hours a day doing sedentary activities
Physical Activity - Average hours a day watching TV or videos
Physical Activity - Average hours a day using computer
Physical Functioning - People having limitations keeping them from working (%)
Physical Functioning - People limited in amount of work they can do (%)
Physical Functioning - People that need special equipment to walk (%)
Physical Functioning - People experiencing confusion/memory problems (%)
Physical Functioning - People requiring special healthcare equipment (%)
Prescription Medications - Average number of prescription medicines taking
Preventive Aspirin Use - Adults 40+ taking low-dose aspirin (%)
Reproductive Health - Vaginal deliveries (%)
Reproductive Health - Cesarean deliveries (%)
Reproductive Health - Deliveries resulted in a live birth (%)
Reproductive Health - Pregnancies resulted in a delivery (%)
Reproductive Health - Women breastfeeding newborns (%)
Reproductive Health - Women that had a hysterectomy (%)
Reproductive Health - Women that had both ovaries removed (%)
Reproductive Health - Women that have ever taken birth control pills (%)
Reproductive Health - Women taking birth control pills (%)
Reproductive Health - Women that have ever used Depo-Provera or injectables (%)
Reproductive Health - Women that have ever used female hormones (%)
Sexual Behavior - People 18+ that ever had sex (vaginal, anal, or oral) (%)
Sexual Behavior - Males 18+ that ever had vaginal sex with a woman (%)
Sexual Behavior - Males 18+ that ever performed oral sex on a woman (%)
Sexual Behavior - Males 18+ that ever had anal sex with a woman (%)
Sexual Behavior - Males 18+ that ever had any sex with a man (%)
Sexual Behavior - Females 18+ that ever had vaginal sex with a man (%)
Sexual Behavior - Females 18+ that ever performed oral sex on a man (%)
Sexual Behavior - Females 18+ that ever had anal sex with a man (%)
Sexual Behavior - Females 18+ that ever had any kind of sex with a woman (%)
Sexual Behavior - Average age people first had sex
Sexual Behavior - Average number of female sex partners in lifetime (males 18+)
Sexual Behavior - Average number of female vaginal sex partners in lifetime (males 18+)
Sexual Behavior - Average age people first performed oral sex on a woman (18+)
Sexual Behavior - Average number of woman performed oral sex on in lifetime (18+)
Sexual Behavior - Average number of male sex partners in lifetime (males 18+)
Sexual Behavior - Average number of male anal sex partners in lifetime (males 18+)
Sexual Behavior - Average age people first performed oral sex on a man (18+)
Sexual Behavior - Average number of male oral sex partners in lifetime (18+)
Sexual Behavior - People using protection when performing oral sex (%)
Sexual Behavior - Average number of times people have vaginal or anal sex a year
Sexual Behavior - People having sex without condom (%)
Sexual Behavior - Average number of male sex partners in lifetime (females 18+)
Sexual Behavior - Average number of male vaginal sex partners in lifetime (females 18+)
Sexual Behavior - Average number of female sex partners in lifetime (females 18+)
Sexual Behavior - Circumcised males 18+ (%)
Sleep Disorders - Average hours sleeping at night
Sleep Disorders - People that has trouble sleeping (%)
Smoking-Cigarette Use - People smoking cigarettes (%)
Taste & Smell - People 40+ having problems with smell (%)
Taste & Smell - People 40+ having problems with taste (%)
Taste & Smell - People 40+ that ever had wisdom teeth removed (%)
Taste & Smell - People 40+ that ever had tonsils teeth removed (%)
Taste & Smell - People 40+ that ever had a loss of consciousness because of a head injury (%)
Taste & Smell - People 40+ that ever had a broken nose or other serious injury to face or skull (%)
Taste & Smell - People 40+ that ever had two or more sinus infections (%)
Weight - Average height (inches)
Weight - Average weight (pounds)
Weight - Average BMI
Weight - People that are obese (%)
Weight - People that ever were obese (%)
Weight - People trying to lose weight (%)
According to our research of Texas and other state lists, there were 70 registered sex offenders living in Mansfield, Texas as of April 27, 2024 . The ratio of all residents to sex offenders in Mansfield is 934 to 1.The ratio of registered sex offenders to all residents in this city is lower than the state average.
Officers per 1,000 residents here:
1.32Texas average:
2.07
Latest news from Mansfield, TX collected exclusively by city-data.com from local newspapers, TV, and radio stations
Ancestries: American (10.9%), English (6.6%), German (3.8%), Irish (3.4%), European (2.2%), Nigerian (1.9%).
Current Local Time:
Land area: 36.5 square miles.
Population density: 2,103 people per square mile (low).
9,201 residents are foreign born (4.5% Asia , 4.2% Latin America , 1.7% Africa ).
This city:
12.3%Texas:
17.1%
Median real estate property taxes paid for housing units with mortgages in 2022: $7,441 (1.8%)Median real estate property taxes paid for housing units with no mortgage in 2022: $5,966 (1.5%)
Nearest city with pop. 50,000+: Arlington, TX
Nearest city with pop. 1,000,000+: Dallas, TX
Nearest cities:
Latitude: 32.58 N, Longitude: 97.13 W
Daytime population change due to commuting: -5,937 (-7.8%)Workers who live and work in this city: 13,161 (31.1%)
Property values in Mansfield, TX
Single-family new house construction building permits:
2022: 842 buildings , average cost: $346,1002021: 1050 buildings , average cost: $332,0002020: 845 buildings , average cost: $349,9002019: 466 buildings , average cost: $350,1002018: 558 buildings , average cost: $335,7002017: 505 buildings , average cost: $347,9002016: 370 buildings , average cost: $348,4002015: 320 buildings , average cost: $349,6002014: 224 buildings , average cost: $368,5002013: 208 buildings , average cost: $316,8002012: 193 buildings , average cost: $222,9002011: 226 buildings , average cost: $198,8002010: 236 buildings , average cost: $193,3002009: 237 buildings , average cost: $165,5002008: 300 buildings , average cost: $191,9002007: 393 buildings , average cost: $219,9002006: 655 buildings , average cost: $211,1002005: 1194 buildings , average cost: $169,9002004: 1191 buildings , average cost: $166,2002003: 591 buildings , average cost: $141,8002002: 539 buildings , average cost: $141,8002001: 500 buildings , average cost: $141,8002000: 474 buildings , average cost: $141,8001999: 491 buildings , average cost: $141,8001998: 476 buildings , average cost: $141,9001997: 409 buildings , average cost: $141,700Unemployment in December 2023:
Population change in the 1990s: +12,451 (+79.9%).
Most common occupations in Mansfield, TX (%)
Both Males Females
Other management occupations, except farmers and farm managers (6.0%)
Other sales and related occupations, including supervisors (4.3%)
Other office and administrative support workers, including supervisors (4.2%)
Preschool, kindergarten, elementary, and middle school teachers (4.1%)
Sales representatives, services, wholesale and manufacturing (3.7%)
Top executives (3.5%)
Computer specialists (3.3%)
Other management occupations, except farmers and farm managers (7.1%)
Top executives (5.5%)
Electrical equipment mechanics and other installation, maintenance, and repair workers, including supervisors (5.1%)
Other sales and related occupations, including supervisors (4.5%)
Computer specialists (4.5%)
Sales representatives, services, wholesale and manufacturing (4.5%)
Driver/sales workers and truck drivers (4.4%)
Preschool, kindergarten, elementary, and middle school teachers (8.0%)
Other office and administrative support workers, including supervisors (6.7%)
Secretaries and administrative assistants (6.0%)
Information and record clerks, except customer service representatives (5.9%)
Other management occupations, except farmers and farm managers (4.6%)
Other sales and related occupations, including supervisors (4.0%)
Retail sales workers, except cashiers (3.9%)
Tornado activity:
Mansfield-area historical tornado activity is above Texas state average. It is 151% greater than the overall U.S. average.
On 4/25/1994, a category F4 (max. wind speeds 207-260 mph) tornado 22.0 miles away from the Mansfield city center killed 3 people and injured 48 people and caused between $50,000,000 and $500,000,000 in damages.
On 5/26/1976, a category F4 tornado 23.0 miles away from the city center caused between $500,000 and $5,000,000 in damages.
Earthquake activity:
Mansfield-area historical earthquake activity is significantly above Texas state average. It is 443% greater than the overall U.S. average. On 11/6/2011 at 03:53:10, a magnitude 5.7 (5.7 MW, Depth: 3.2 mi, Class: Moderate, Intensity: VI - VII) earthquake occurred 205.4 miles away from Mansfield center On 9/3/2016 at 12:02:44, a magnitude 5.8 (5.8 MW, Depth: 3.5 mi) earthquake occurred 266.4 miles away from the city center On 6/16/1978 at 11:46:54, a magnitude 5.3 (4.4 MB, 4.6 UK, 5.3 ML) earthquake occurred 213.9 miles away from the city center On 5/17/2012 at 08:12:00, a magnitude 4.8 (4.8 MW, Depth: 3.1 mi, Class: Light, Intensity: IV - V) earthquake occurred 167.5 miles away from the city center On 5/7/2015 at 22:58:05, a magnitude 4.0 (4.0 MW, Depth: 1.6 mi) earthquake occurred 6.8 miles away from the city center On 11/7/2016 at 01:44:24, a magnitude 5.0 (5.0 MW, Depth: 2.8 mi) earthquake occurred 236.8 miles away from the city center Magnitude types: body-wave magnitude (MB), local magnitude (ML), moment magnitude (MW) Natural disasters: The number of natural disasters in Tarrant County (23) is greater than the US average (15).Major Disasters (Presidential) Declared: 10Emergencies Declared: 10Storms: 8, Floods: 7, Hurricanes: 7, Fires: 6, Tornadoes: 5, Wind: 1, Other: 2 (Note: some incidents may be assigned to more than one category). Hospitals in Mansfield: KINDRED HOSPITAL FORT WORTH (provides emergency services, 1802 HIGHWAY 157 SOUTH) MANSFIELD COMM HOSP (provides emergency services, 1802 HWY 157 NORTH) METHODIST MANSFIELD MEDICAL CENTER (Voluntary non-profit - Private, 2700 E BROAD STREET) WALNUT CREEK (622 S WALNUT CRK) Nursing Homes in Mansfield: KINDRED TRANSITIONAL CARE AND REHABILITATION-MANSF (301 N MILLER RD) MANSFIELD NURSING AND REHABILITATION LP (1402 E BROAD ST) MANSFIELD SNF, LLC, DBA ISLE AT WATERCREST-MANSF (200 E DEBBIE LANE) Dialysis Facilities in Mansfield: MANSFIELD DIALYSIS CENTER (987 N. WALNUT CREEK DRIVE) TARRANT DIALYSIS CENTER MANSFIELD (1800 HWY 157 N.) Home Health Centers in Mansfield: ABLECARE HEALTHCARE SERVICES (1000 WALNUT CREEK DRIVE SUITE B) COE HOME HEALTH (560 N WALNUT CREEK DRIVE #120) LIFE FIRST HOME HEALTH CARE (2110 SANDSTONE CT) OMEGA HOME HEALTHCARE AGENCY (2364 NORTH HWY SUITE 119) PANCARE HOMECARE INC (3165 KINGSWOOD CT) STAR HOME HEALTH (99 REGENCY PKWY SUITE 211) Amtrak station near Mansfield: 17 miles: FORT WORTH (1501 JONES ST.) Services: ticket office, fully wheelchair accessible, enclosed waiting area, public restrooms, public payphones, vending machines, free short-term parking, paid long-term parking, call for car rental service, call for taxi service, public transit connection.
Colleges/universities with over 2000 students nearest to Mansfield:
The University of Texas at Arlington (about 11 miles; Arlington, TX ; Full-time enrollment: 27,453)
Dallas Baptist University (about 14 miles; Dallas, TX ; FT enrollment: 4,280)
Texas Christian University (about 17 miles; Fort Worth, TX ; FT enrollment: 9,131)
Mountain View College (about 17 miles; Dallas, TX ; FT enrollment: 4,988)
Tarrant County College District (about 17 miles; Fort Worth, TX ; FT enrollment: 33,775)
Cedar Valley College (about 22 miles; Lancaster, TX ; FT enrollment: 3,603)
University of Dallas (about 23 miles; Irving, TX ; FT enrollment: 2,192)
Public high schools in Mansfield: MANSFIELD H S Students: 2,367, Location: 3001 E BROAD ST, Grades: 9-12)MANSFIELD LEGACY H S Students: 2,313, Location: 1263 N MAIN, Grades: 9-12)DANNY JONES MIDDLE Students: 818, Location: 4500 E BROAD ST, Grades: 7-9)TARRANT CO J J A E P Students: 5, Location: 902 E BROAD ST, Grades: 7-11)ALTER ED CTR Location: 902 E BROAD, Grades: 9-12)
MANSFIELD LAKE RIDGE H S Location: 101 N DAY MIAR, Grades: 9-12)
MANSFIELD FRONTIER H S Location: 1120 W DEBBIE LN, Grades: 11-12)Biggest public elementary/middle schools in Mansfield: BROOKS WESTER MIDDLE Students: 939, Location: 1520 N WALNUT CREEK DR, Grades: 7-8)ASA E LOW JR INT Students: 877, Location: 1526 N WALNUT CREEK DR, Grades: 5-6)MARY ORR INT Students: 849, Location: 2900 E BROAD ST, Grades: 5-6)ROBERTA TIPPS EL Students: 811, Location: 3001 N WALNUT CREEK, Grades: PK-4)MARY LILLARD I S Students: 783, Location: 1301 DAY MIAR, Grades: 5-6)DONNA SHEPARD INT Students: 744, Location: 1280 FM 1187, Grades: 5-6)ROGENE WORLEY MIDDLE Students: 721, Location: 500 PLEASANT RDG RD, Grades: 7-8)MARY JO SHEPPARD EL Students: 713, Location: 1701 FM 1187, Grades: PK-4)LINDA JOBE MIDDLE Students: 693, Location: 2491 GERTIE BARRETT RD, Grades: 7-8)J L BOREN EL Students: 687, Location: 1402 COUNTRY CLUB DR, Grades: PK-4)Private elementary/middle schools in Mansfield: WALNUT CREEK PRIVATE SCHOOL Students: 139, Location: 1751 N WALNUT CREEK DR, Grades: PK-5)
PANTEGO CHRISTIAN ACADEMY-MANSFIELD CAMPUS Students: 113, Location: 2351 COUNTRY CLUB DR, Grades: PK-5)
See full list of schools located in Mansfield Library in Mansfield: MANSFIELD PUBLIC LIBRARY Operating income: $811,171; Location: 104 S WISTERIA ST; 64,532 books ; 2,563 e-books ; 2,540 audio materials ; 4,847 video materials ; 8 local licensed databases ; 50 state licensed databases ; 153 print serial subscriptions )
User-submitted facts and corrections:
you only have Mansfield High School and the Alternative campus listed as High Schools in Mansfield. There in fact 2 more high Schools, Summit High School, and Timberview High School, and the 4th will open in the fall of 2007, called Legacy High School.
St Jude Catholic Church is in Mansfield.
Mansfield now has their own hospital called Methodist Mansfield Medical Center at 2700 East Broad Street near Matlock Road. added by cry baby becky
Notable locations in Mansfield: (A) , Mansfield Fire Department Station 2 (B) . Display/hide their locations on the map
Churches in Mansfield include: (A) , Saint Paul Church (B) , Mansfield Community Church (C) , New Zion Missionary Baptist Church (D) , Walnut Ridge Baptist Church (E) , Church of Christ Mansfield (F) , Walnut Creek Church of God (G) , Saint Gregorys Episcopal Church (H) , First Church of the Nazarene (I) . Display/hide their locations on the map
Cemeteries: (1) , Grimsley Cemetery (2) , Cope Cemetery (3) . Display/hide their locations on the map
Streams, rivers, and creeks: (A) , Hogpen Branch (B) . Display/hide their locations on the map
Parks in Mansfield include: (1) , Mansfield City Park (2) , R L Anderson Stadium (3) , Britton Park (4) . Display/hide their locations on the map
Tourist attractions: (1) , Celebration Station (Amusement & Theme Parks; 913 Cumberland Trail) (2) , Casino Network (Arcades & Amusements; 1109 Hilton Drive) (3) . Display/hide their approximate locations on the map
Hotel: (1) . Display/hide its approximate location on the map
Birthplace of: Ella Mae Morse - Popular music singer, B.J. Medley - College football player (Northern Iowa Panthers), Kellen Allen - College basketball player (LIU Brooklyn Blackbirds), Ross DeRogatis - College basketball player (San Diego Toreros).
Tarrant County has a predicted average indoor radon screening level less than 2 pCi/L (pico curies per liter) - Low Potential Drinking water stations with addresses in Mansfield and their reported violations in the past:
CANYON CREEK ADDITION (Population served: 912, Groundwater):
Past health violations:
MCL, Monthly (TCR) - In JUL-2010, Contaminant: Coliform. Follow-up actions: St Formal NOV issued (3 times from JAN-28-2009 to JUL-27-2009), St Compliance achieved (SEP-08-2009), St Public Notif requested (AUG-03-2010), St Violation/Reminder Notice (AUG-03-2010)
MCL, Monthly (TCR) - In JUL-2006, Contaminant: Coliform. Follow-up actions: St Compliance achieved (JUL-31-2006), St Public Notif requested (AUG-02-2006), St Violation/Reminder Notice (AUG-02-2006), St Public Notif received (SEP-01-2006)
Past monitoring violations:
Monitoring and Reporting (DBP) - Between APR-2013 and JUN-2013, Contaminant: Chlorine. Follow-up actions: St Public Notif requested (NOV-14-2013), St Violation/Reminder Notice (NOV-14-2013), St Compliance achieved (JUL-17-2014)
Monitoring and Reporting (DBP) - Between JAN-2013 and MAR-2013, Contaminant: Chlorine. Follow-up actions: St Public Notif requested (NOV-14-2013), St Violation/Reminder Notice (NOV-14-2013), St Compliance achieved (JUL-17-2014)
Monitoring, Repeat Major (TCR) - In OCT-2008, Contaminant: Coliform (TCR). Follow-up actions: St Compliance achieved (OCT-31-2008), St Public Notif requested (DEC-04-2008), St Violation/Reminder Notice (DEC-04-2008)
62 regular monitoring violations
Population served: 183, Groundwater):
Past monitoring violations:
Lead Consumer Notice - In DEC-30-2013, Contaminant: Lead and Copper Rule
Monitoring, Source Water (GWR) - In AUG-01-2013, Contaminant: E. COLI. Follow-up actions: St Violation/Reminder Notice (OCT-30-2013), St Public Notif requested (OCT-30-2013), St Public Notif received (MAR-03-2014)
Monitoring and Reporting (DBP) - Between APR-2013 and JUN-2013, Contaminant: Chlorine. Follow-up actions: St Violation/Reminder Notice (NOV-14-2013), St Public Notif requested (NOV-14-2013), St Compliance achieved (JUL-17-2014)
Monitoring and Reporting (DBP) - Between JAN-2013 and MAR-2013, Contaminant: Chlorine. Follow-up actions: St Violation/Reminder Notice (NOV-14-2013), St Public Notif requested (NOV-14-2013), St Compliance achieved (JUL-17-2014)
Follow-up Or Routine LCR Tap M/R - In OCT-01-2010, Contaminant: Lead and Copper Rule. Follow-up actions: St Compliance achieved (NOV-08-2013)
Population served: 76, Groundwater):
Past monitoring violations:
One routine major monitoring violation
Average household size: This city:
3.1 peopleTexas:
2.8 people
Percentage of family households: This city:
82.1%Whole state:
69.9%
Percentage of households with unmarried partners: This city:
4.2%Whole state:
6.0%
Likely homosexual households (counted as self-reported same-sex unmarried-partner households)
Lesbian couples: 0.4% of all households Gay men: 0.2% of all households
People in group quarters in Mansfield in 2010:
196 people in local jails and other municipal confinement facilities
159 people in nursing facilities/skilled-nursing facilities
6 people in group homes intended for adults
People in group quarters in Mansfield in 2000:
354 people in other types of correctional institutions
134 people in local jails and other confinement facilities (including police lockups)
68 people in nursing homes
37 people in other group homes
31 people in other nonhousehold living situations
18 people in hospitals/wards and hospices for chronically ill
18 people in other hospitals or wards for chronically ill
6 people in homes for the mentally retarded
Banks with most branches in Mansfield (2011 data):
JPMorgan Chase Bank, National Association: Mansfield Branch, Debbie And Matlock Banking Ctr. Bran, South Mansfield. Info updated 2011/11/10: Bank assets: $1,811,678.0 mil, Deposits: $1,190,738.0 mil, headquarters in Columbus, OH, positive income , International Specialization, 5577 total offices , Holding Company: Jpmorgan Chase & Co.
First National Bank Texas: Mansfield Banking Center - Rc 584 at 3001 Matlock Road, branch established on 2004/02/09; Walnut Creek Banking Center - Rc 893 at 930 North Walnut Creek Drive, branch established on 2004/12/08. Info updated 2006/11/03: Bank assets: $944.3 mil, Deposits: $815.9 mil, headquarters in Killeen, TX, positive income , Mortgage Lending Specialization, 250 total offices , Holding Company: First Community Bancshares, Inc.
Bank of America, National Association: Matlock Banking Center Branch at 2821 Matlock Road, branch established on 2002/01/28. Info updated 2009/11/18: Bank assets: $1,451,969.3 mil, Deposits: $1,077,176.8 mil, headquarters in Charlotte, NC, positive income , 5782 total offices , Holding Company: Bank Of America Corporation
Comerica Bank: Highway 57n-Mansfield Branch at 2901 Highway 157 N, branch established on 2006/08/28. Info updated 2011/07/29: Bank assets: $60,970.5 mil, Deposits: $48,300.9 mil, headquarters in Dallas, TX, positive income , Commercial Lending Specialization, 497 total offices , Holding Company: Comerica Incorporated
The Frost National Bank: Mansfield Branch at 1000 Walnut Creek Drive, branch established on 1982/03/01. Info updated 2006/12/21: Bank assets: $20,372.1 mil, Deposits: $16,846.8 mil, headquarters in San Antonio, TX, positive income , Commercial Lending Specialization, 133 total offices , Holding Company: Cullen/Frost Bankers, Inc.
Wells Fargo Bank, National Association: Debbie And Matlock at 3000 Matlock Road, branch established on 2007/09/27. Info updated 2011/04/05: Bank assets: $1,161,490.0 mil, Deposits: $905,653.0 mil, headquarters in Sioux Falls, SD, positive income , 6395 total offices , Holding Company: Wells Fargo & Company
Southwest Bank: Mansfield 287 Branch at 1701 N Us Hwy 287, branch established on 2003/09/03. Info updated 2009/07/30: Bank assets: $954.3 mil, Deposits: $750.1 mil, headquarters in Fort Worth, TX, positive income , Commercial Lending Specialization, 11 total offices , Holding Company: First Texas Bhc, Inc.
American Bank of Commerce: Mansfield Branch at 1748 East Broad Street, branch established on 2008/06/30. Info updated 2006/11/03: Bank assets: $645.3 mil, Deposits: $564.6 mil, headquarters in Wolfforth, TX, positive income , Commercial Lending Specialization, 18 total offices , Holding Company: Americo Bancshares, Inc.
Compass Bank: Mansfield Branch at 3101 Matlock Road, branch established on 2002/10/21. Info updated 2011/02/24: Bank assets: $63,107.0 mil, Deposits: $46,232.4 mil, headquarters in Birmingham, AL, negative income in the last year , Commercial Lending Specialization, 720 total offices , Holding Company: Banco Bilbao Vizcaya Argentaria, S.A.
4 other banks with 4 local branches
For population 15 years and over in Mansfield:
Never married: 33.2%Now married: 53.9%Separated: 0.6%Widowed: 3.3%Divorced: 9.0% For population 25 years and over in Mansfield:
High school or higher: 96.0%Bachelor's degree or higher: 45.7%Graduate or professional degree: 15.4%Unemployed: 3.9%Mean travel time to work (commute): 24.4 minutes
Education Gini index (Inequality in education) Here:
9.5Texas average:
14.0
Religion statistics for Mansfield, TX (based on Tarrant County data)
Religion Adherents Congregations Evangelical Protestant 544,670 1,272 Catholic 200,645 33 Mainline Protestant 141,938 158 Other 75,335 122 Black Protestant 33,665 103 Orthodox 2,596 7 None 810,185 -
Source: Clifford Grammich, Kirk Hadaway, Richard Houseal, Dale E.Jones, Alexei Krindatch, Richie Stanley and Richard H.Taylor. 2012. 2010 U.S.Religion Census: Religious Congregations & Membership Study. Association of Statisticians of American Religious Bodies. Jones, Dale E., et al. 2002. Congregations and Membership in the United States 2000. Nashville, TN: Glenmary Research Center. Graphs represent county-level data
Food Environment Statistics: Number of grocery stores : 212This county :
1.24 / 10,000 pop.Texas :
1.47 / 10,000 pop.
Number of supercenters and club stores : 25Tarrant County :
0.15 / 10,000 pop.Texas :
0.14 / 10,000 pop.
Number of convenience stores (no gas) : 194This county :
1.14 / 10,000 pop.Texas :
1.11 / 10,000 pop.
Number of convenience stores (with gas) : 609This county :
3.56 / 10,000 pop.Texas :
3.95 / 10,000 pop.
Number of full-service restaurants : 970Tarrant County :
5.68 / 10,000 pop.Texas :
6.13 / 10,000 pop.
Adult diabetes rate : Tarrant County :
8.1%State :
8.9%
Adult obesity rate : Tarrant County :
26.1%Texas :
26.6%
Low-income preschool obesity rate : This county :
14.5%Texas :
15.7%
Health and Nutrition: Healthy diet rate : This city:
50.4%Texas:
48.6%
Average overall health of teeth and gums : People feeling badly about themselves : Mansfield:
20.6%State:
20.6%
People not drinking alcohol at all : Mansfield:
8.9%Texas:
10.3%
Average hours sleeping at night : General health condition : This city:
58.7%Texas:
56.2%
Average condition of hearing : More about Health and Nutrition of Mansfield, TX Residents
Local government employment and payroll (March 2022)
Function
Full-time employees
Monthly full-time payroll
Average yearly full-time wage
Part-time employees
Monthly part-time payroll
Police Protection - Officers
110 $848,132 $92,523 1 $3,777 Firefighters
94 $751,879 $95,985 0 $0 Other and Unallocable
51 $360,539 $84,833 2 $3,856 Parks and Recreation
44 $218,247 $59,522 18 $23,570 Police - Other
39 $209,055 $64,325 0 $0 Water Supply
32 $175,027 $65,635 1 $3,094 Streets and Highways
31 $190,380 $73,695 0 $0 Health
17 $90,342 $63,771 0 $0 Other Government Administration
14 $150,393 $128,908 0 $0 Financial Administration
12 $106,372 $106,372 0 $0 Fire - Other
10 $96,754 $116,105 0 $0 Local Libraries
8 $43,857 $65,786 4 $7,149 Sewerage
7 $36,833 $63,142 0 $0 Judicial and Legal
3 $15,485 $61,940 0 $0
Totals for Government
472 $3,293,292 $83,728 26 $41,446
Mansfield government finances - Expenditure in 2021 (per resident):
Construction - Regular Highways: $8,890,000 ($115.87)
Parks and Recreation: $2,601,000 ($33.90)Local Fire Protection: $2,429,000 ($31.66)Housing and Community Development: $2,337,000 ($30.46)Sewerage: $259,000 ($3.38)Water Utilities: $259,000 ($3.38)General Public Buildings: $134,000 ($1.75)Central Staff Services: $103,000 ($1.34)Health - Other: $93,000 ($1.21)Police Protection: $21,000 ($0.27)Libraries: $3,000 ($0.04)Current Operations - Police Protection: $21,592,000 ($281.42)
Water Utilities: $20,663,000 ($269.32)Local Fire Protection: $16,624,000 ($216.67)General - Other: $11,142,000 ($145.22)Sewerage: $8,450,000 ($110.14)Parks and Recreation: $7,773,000 ($101.31)Correctional Institutions: $5,302,000 ($69.10)Central Staff Services: $5,217,000 ($68.00)Regular Highways: $5,023,000 ($65.47)Solid Waste Management: $3,024,000 ($39.41)Protective Inspection and Regulation - Other: $2,326,000 ($30.32)Financial Administration: $1,590,000 ($20.72)Health - Other: $1,243,000 ($16.20)General Public Buildings: $1,195,000 ($15.58)Libraries: $1,009,000 ($13.15)Judicial and Legal Services: $974,000 ($12.69)General - Interest on Debt: $8,137,000 ($106.06)
Intergovernmental to Local - Other - Libraries: $19,000 ($0.25)
Other Capital Outlay - Police Protection: $756,000 ($9.85)
Water Utilities: $595,000 ($7.76)Parks and Recreation: $279,000 ($3.64)Regular Highways: $199,000 ($2.59)Local Fire Protection: $158,000 ($2.06)Protective Inspection and Regulation - Other: $101,000 ($1.32)General - Other: $69,000 ($0.90)General Public Building: $66,000 ($0.86)Libraries: $61,000 ($0.80)Judicial and Legal Services: $42,000 ($0.55)Sewerage: $4,000 ($0.05)Total Salaries and Wages: $39,034,000 ($508.76)
Water Utilities - Interest on Debt: $1,009,000 ($13.15)
Mansfield government finances - Revenue in 2021 (per resident):
Charges - Sewerage: $13,340,000 ($173.87)
Other: $5,121,000 ($66.75)Solid Waste Management: $2,585,000 ($33.69)Natural Resources - Other: $2,421,000 ($31.55)Parks and Recreation: $592,000 ($7.72)Federal Intergovernmental - Health and Hospitals: $3,553,000 ($46.31)
Other: $8,000 ($0.10)Miscellaneous - General Revenue - Other: $12,263,000 ($159.83)
Special Assessments: $9,715,000 ($126.62)Fines and Forfeits: $1,390,000 ($18.12)Rents: $1,146,000 ($14.94)Interest Earnings: $765,000 ($9.97)Royalties: $95,000 ($1.24)Sale of Property: $65,000 ($0.85)Donations From Private Sources: $57,000 ($0.74)Revenue - Water Utilities: $22,974,000 ($299.44)
State Intergovernmental - Other: $416,000 ($5.42)
General Local Government Support: $181,000 ($2.36)Housing and Community Development: $3,000 ($0.04)Tax - Property: $59,165,000 ($771.14)
General Sales and Gross Receipts: $27,176,000 ($354.20)Public Utilities Sales: $7,752,000 ($101.04)Occupation and Business License - Other: $2,880,000 ($37.54)Other Selective Sales: $546,000 ($7.12)
Mansfield government finances - Debt in 2021 (per resident):
Long Term Debt - Outstanding Unspecified Public Purpose: $243,015,000 ($3167.39)
Beginning Outstanding - Unspecified Public Purpose: $236,040,000 ($3076.48)Issue, Unspecified Public Purpose: $28,720,000 ($374.33)Retired Unspecified Public Purpose: $21,745,000 ($283.42)
Mansfield government finances - Cash and Securities in 2021 (per resident):
Bond Funds - Cash and Securities: $20,667,000 ($269.37)
Other Funds - Cash and Securities: $120,022,000 ($1564.33)
Sinking Funds - Cash and Securities: $9,084,000 ($118.40)
7.43% of this county's 2021 resident taxpayers lived in other counties in 2020 ($70,478 average adjusted gross income )
Here:
7.43%Texas average:
8.12%
0.03% of residents moved from foreign countries ($213 average AGI )Tarrant County:
0.03%Texas average:
0.04%
Top counties from which taxpayers relocated into this county between 2020 and 2021:
7.19% of this county's 2020 resident taxpayers moved to other counties in 2021 ($70,939 average adjusted gross income )
Here:
7.19%Texas average:
7.40%
0.03% of residents moved to foreign countries ($199 average AGI )Tarrant County:
0.03%Texas average:
0.03%
Top counties to which taxpayers relocated from this county between 2020 and 2021:
Businesses in Mansfield, TX
Name Count Name Count
24 Hour Fitness 1 La Quinta 1 7-Eleven 2 Little Caesars Pizza 1 ALDI 1 Lowe's 1 AT&T 2 Marriott 1 Ace Hardware 1 Marshalls 1 Applebee's 1 McDonald's 2 AutoZone 2 Nike 4 Baskin-Robbins 1 Olive Garden 1 Bed Bath & Beyond 1 On The Border 1 Best Western 1 Panda Express 2 Blockbuster 2 Papa John's Pizza 1 Burger King 1 Payless 1 CVS 3 PetSmart 1 Chick-Fil-A 1 Pier 1 Imports 1 Cinnabon 1 Pizza Hut 3 Cold Stone Creamery 1 Popeyes 1 Comfort Inn 1 Quiznos 1 Curves 1 RadioShack 1 Dairy Queen 1 Rue21 1 Discount Tire 1 SONIC Drive-In 3 Domino's Pizza 1 Safeway 1 Famous Footwear 1 Sears 1 Fashion Bug 1 Sprint Nextel 1 FedEx 8 Staples 1 Firestone Complete Auto Care 1 Starbucks 4 GNC 1 Subway 7 GameStop 2 T-Mobile 3 H&R Block 2 Taco Bell 1 Hilton 1 Target 1 Holiday Inn 1 U-Haul 1 Home Depot 1 UPS 8 IHOP 1 Vons 1 Jack In The Box 1 Waffle House 1 Jimmy John's 1 Walgreens 2 KFC 1 Walmart 2 Kohl's 1 Wendy's 1 Kroger 1
Strongest AM radio stations in Mansfield:
WBAP (820 AM; 50 kW; FORT WORTH, TX; Owner: WBAP-KSCS OPERATING, LTD.)
KESS (1270 AM; 50 kW; FORT WORTH, TX; Owner: KESS-AM LICENSE CORP.)
KZMP (1540 AM; 50 kW; UNIVERSITY PARK, TX; Owner: ENTRAVISION HOLDINGS, LLC)
KAHZ (1360 AM; 50 kW; HURST, TX)
KSKY (660 AM; 20 kW; BALCH SPRINGS, TX; Owner: BISON MEDIA, INC.)
KRLD (1080 AM; 50 kW; DALLAS, TX; Owner: TEXAS INFINITY BROADCASTING L.P.)
KBIS (1150 AM; 25 kW; HIGHLAND PARK, TX; Owner: DALLAS AM RADIO PARTNERS, L.P.)
KHVN (970 AM; 10 kW; FORT WORTH, TX; Owner: MORTENSON BROADCASTING COMPANY)
KNAX (1630 AM; 10 kW; FT. WORTH, TX; Owner: MORTENSON BROADCASTING COMPANY)
KFXR (1190 AM; 50 kW; DALLAS, TX; Owner: CLEAR CHANNEL BROADCASTING LICENSES, INC.)
KLIF (570 AM; 5 kW; DALLAS, TX; Owner: KLIF LICO, INC.)
KTCK (1310 AM; 9 kW; DALLAS, TX; Owner: KRBE LICO, INC.)
KGGR (1040 AM; daytime; 5 kW; DALLAS, TX; Owner: MORTENSON BROADCASTING COMPANY)
Strongest FM radio stations in Mansfield:
KLLI (105.3 FM; DALLAS, TX; Owner: INFINITY BROADCASTING CORPORATION OF DALLAS)
KKDA-FM (104.5 FM; DALLAS, TX; Owner: SERVICE BROADCASTING I, LTD.)
KZPS (92.5 FM; DALLAS, TX; Owner: AMFM TEXAS LICENSES LIMITED PARTNERSHIP)
KHKS (106.1 FM; DENTON, TX; Owner: AMFM TEXAS LICENSES LIMITED PARTNERSHIP)
KVIL-FM (103.7 FM; HIGHLAND PARK-DALLAS, TX; Owner: INFINITY BROADCASTING CORPORATION OF TEXAS)
KRBV (100.3 FM; DALLAS, TX; Owner: INFINITY BROADCASTING CORP. OF FORT WORTH)
KLNO (94.1 FM; FORT WORTH, TX; Owner: HBC LICENSE CORPORATION)
KOAI (107.5 FM; FORT WORTH, TX; Owner: INFINITY KOAI-FM, INC.)
KBFB (97.9 FM; DALLAS, TX; Owner: RADIO ONE LICENSES, LLC)
KSCS (96.3 FM; FORT WORTH, TX; Owner: WBAP-KSCS OPERATING, LTD.)
KDGE (102.1 FM; FORT WORTH-DALLAS, TX; Owner: CAPSTAR TX LIMITED PARTNERSHIP)
KCBI (90.9 FM; DALLAS, TX; Owner: CRISWELL CENTER FOR BIBLICAL STUDIES)
KEGL (97.1 FM; FORT WORTH, TX; Owner: CITICASTERS LICENSES, L.P.)
KDMX (102.9 FM; DALLAS, TX; Owner: CITICASTERS LICENSES, L.P.)
KVTT (91.7 FM; DALLAS, TX; Owner: RESEARCH EDUCATIONAL FOUNDATION, INC)
KERA (90.1 FM; DALLAS, TX; Owner: NORTH TEXAS PUBLIC BROADCASTING, INC.)
KNON (89.3 FM; DALLAS, TX; Owner: AGAPE BROADCASTING FOUNDATION, INC.)
KLUV-FM (98.7 FM; DALLAS, TX; Owner: INFINITY BROADCASTING CORPORATION OF DALLAS)
WRR (101.1 FM; DALLAS, TX; Owner: CITY OF DALLAS, TEXAS)
KPLX (99.5 FM; FORT WORTH, TX; Owner: KPLX LICO, INC.)
TV broadcast stations around Mansfield:
KDTN (Channel 2; DENTON, TX; Owner: NORTH TEXAS PUBLIC BROADCASTING, INC.)
KXAS-TV (Channel 5; FORT WORTH, TX; Owner: STATION VENTURE OPERATIONS, LP)
KTVT (Channel 11; FORT WORTH, TX; Owner: CBS STATIONS GROUP OF TEXAS L.P.)
WFAA-TV (Channel 8; DALLAS, TX; Owner: WFAA-TV, L.P.)
KPXD (Channel 68; ARLINGTON, TX; Owner: PAXSON DALLAS LICENSE, INC.)
KSTR-TV (Channel 49; IRVING, TX; Owner: TELEFUTURA DALLAS LLC)
KDFW (Channel 4; DALLAS, TX; Owner: KDFW LICENSE, INC.)
KUVN (Channel 23; GARLAND, TX; Owner: KUVN LICENSE PARTNERSHIP, L.P.)
KTXA (Channel 21; FORT WORTH, TX; Owner: VIACOM TELEVISION STATIONS GROUP OF DALLAS/FORT WORTH L.P.)
KMPX (Channel 29; DECATUR, TX; Owner: WORD OF GOD FELLOWSHIP, INC.)
KDTX-TV (Channel 58; DALLAS, TX; Owner: TRINITY BROADCASTING OF TEXAS, INC.)
KXTX-TV (Channel 39; DALLAS, TX; Owner: TELEMUNDO OF TEXAS PARTNERSHIP, LP)
KDAF (Channel 33; DALLAS, TX; Owner: TRIBUNE TELEVISION COMPANY)
KDFI (Channel 27; DALLAS, TX; Owner: NEW DMIC, INC.)
KERA-TV (Channel 13; DALLAS, TX; Owner: NORTH TEXAS PUBLIC BROADCASTING, INC.)
K26HF (Channel 26; BRITTON, TX; Owner: MAKO COMMUNICATIONS, LLC)
KHPK-LP (Channel 28; DE SOTO, TX; Owner: MAKO COMMUNICATIONS, LLC)
K25FW (Channel 25; CORSICANA, TX; Owner: VENTANA TELEVISION, INC.)
KATA-LP (Channel 60; MESQUITE, TX; Owner: JANE McGINNIS)
KFWD (Channel 52; FORT WORTH, TX; Owner: HIC BROADCAST, INC.)
KVFW-LP (Channel 65; FORT WORTH, TX; Owner: GERALD BENAVIDES)
KLDT (Channel 55; LAKE DALLAS, TX; Owner: JOHNSON BROADCASTING OF DALLAS, INC.)
KLEG-LP (Channel 44; DALLAS, TX; Owner: DILIP VISWANATH)
KUVN-CA (Channel 31; FORT WORTH, TX; Owner: KUVN LICENSE PARTNERSHIP, L.P.)
KJJM-LP (Channel 46; DALLAS/MESQUITE, TX; Owner: JANE McGINNIS)
National Bridge Inventory (NBI) Statistics 126 Number of bridges1,939ft / 591m Total length $1,458,000 Total costs1,829,691 Total average daily traffic130,582 Total average daily truck traffic
New bridges - historical statistics
1 1920-1929 3 1930-1939 4 1940-1949 2 1950-1959 10 1970-1979 21 1980-1989 14 1990-1999 30 2000-2009 41 2010-2019
See full National Bridge Inventory statistics for Mansfield, TX
Home Mortgage Disclosure Act Aggregated Statistics For Year 2009(Based on 3 full and 4 partial tracts) A) FHA, FSA/RHS & VA B) Conventional C) Refinancings D) Home Improvement Loans E) Loans on Dwellings For 5+ Families F) Non-occupant Loans on G) Loans On Manufactured Number Average Value Number Average Value Number Average Value Number Average Value Number Average Value Number Average Value Number Average Value
LOANS ORIGINATED 476 $161,100 300 $161,578 866 $165,964 38 $53,808 2 $10,237,930 63 $112,540 14 $51,256 APPLICATIONS APPROVED, NOT ACCEPTED 18 $153,114 26 $174,048 98 $159,908 14 $21,819 0 $0 5 $118,962 2 $54,030 APPLICATIONS DENIED 57 $166,611 66 $158,058 354 $165,008 72 $30,972 0 $0 19 $116,002 11 $53,083 APPLICATIONS WITHDRAWN 55 $167,518 50 $183,826 242 $157,208 8 $27,578 0 $0 9 $105,869 2 $86,770 FILES CLOSED FOR INCOMPLETENESS 17 $165,728 14 $164,746 67 $159,897 4 $44,208 0 $0 4 $89,355 2 $20,880
Aggregated Statistics For Year 2008(Based on 3 full and 4 partial tracts) A) FHA, FSA/RHS & VA B) Conventional C) Refinancings D) Home Improvement Loans E) Loans on Dwellings For 5+ Families F) Non-occupant Loans on G) Loans On Manufactured Number Average Value Number Average Value Number Average Value Number Average Value Number Average Value Number Average Value Number Average Value
LOANS ORIGINATED 364 $159,803 629 $159,768 451 $155,975 80 $43,340 0 $0 139 $108,499 30 $40,591 APPLICATIONS APPROVED, NOT ACCEPTED 29 $158,091 58 $184,603 77 $163,869 23 $41,688 0 $0 19 $118,549 6 $52,927 APPLICATIONS DENIED 77 $167,509 125 $161,781 398 $151,853 179 $35,198 1 $130,000 50 $118,657 19 $59,085 APPLICATIONS WITHDRAWN 68 $164,440 87 $176,177 158 $156,605 19 $59,741 0 $0 17 $119,619 3 $55,473 FILES CLOSED FOR INCOMPLETENESS 12 $145,590 25 $187,349 42 $168,130 8 $44,319 0 $0 3 $107,567 1 $86,820
Aggregated Statistics For Year 2007(Based on 3 full and 4 partial tracts) A) FHA, FSA/RHS & VA B) Conventional C) Refinancings D) Home Improvement Loans E) Loans on Dwellings For 5+ Families F) Non-occupant Loans on G) Loans On Manufactured Number Average Value Number Average Value Number Average Value Number Average Value Number Average Value Number Average Value Number Average Value
LOANS ORIGINATED 272 $154,916 1,310 $140,268 448 $149,572 155 $46,016 2 $7,035,940 183 $124,700 10 $69,011 APPLICATIONS APPROVED, NOT ACCEPTED 20 $146,469 181 $141,138 116 $156,528 63 $37,563 0 $0 38 $113,841 7 $58,551 APPLICATIONS DENIED 41 $158,320 293 $158,867 636 $147,405 201 $38,228 0 $0 82 $121,266 23 $56,386 APPLICATIONS WITHDRAWN 37 $165,975 189 $154,827 229 $144,406 26 $51,804 0 $0 27 $129,253 3 $53,207 FILES CLOSED FOR INCOMPLETENESS 3 $131,567 33 $173,299 112 $177,015 6 $38,975 0 $0 12 $191,387 0 $0
Aggregated Statistics For Year 2006(Based on 3 full and 4 partial tracts) A) FHA, FSA/RHS & VA B) Conventional C) Refinancings D) Home Improvement Loans F) Non-occupant Loans on G) Loans On Manufactured Number Average Value Number Average Value Number Average Value Number Average Value Number Average Value Number Average Value
LOANS ORIGINATED 253 $145,812 2,147 $120,413 427 $140,049 126 $43,542 334 $101,767 16 $62,946 APPLICATIONS APPROVED, NOT ACCEPTED 14 $139,110 301 $116,563 94 $122,919 42 $36,386 45 $108,562 11 $46,113 APPLICATIONS DENIED 48 $145,952 485 $131,126 512 $144,793 210 $33,756 90 $104,159 31 $47,333 APPLICATIONS WITHDRAWN 67 $147,231 342 $130,394 312 $147,180 17 $47,180 52 $113,020 4 $101,630 FILES CLOSED FOR INCOMPLETENESS 3 $170,800 73 $128,859 133 $154,504 4 $140,275 28 $127,634 0 $0
Aggregated Statistics For Year 2005(Based on 3 full and 4 partial tracts) A) FHA, FSA/RHS & VA B) Conventional C) Refinancings D) Home Improvement Loans F) Non-occupant Loans on G) Loans On Manufactured Number Average Value Number Average Value Number Average Value Number Average Value Number Average Value Number Average Value
LOANS ORIGINATED 285 $141,763 2,305 $113,194 605 $134,523 138 $49,511 339 $94,213 31 $55,075 APPLICATIONS APPROVED, NOT ACCEPTED 13 $139,197 296 $120,471 88 $139,655 40 $31,474 24 $117,436 17 $47,606 APPLICATIONS DENIED 63 $138,507 548 $119,884 619 $142,624 180 $32,345 98 $109,479 40 $45,816 APPLICATIONS WITHDRAWN 66 $146,368 444 $125,692 349 $149,915 60 $199,616 72 $104,462 11 $41,453 FILES CLOSED FOR INCOMPLETENESS 2 $138,885 79 $130,094 212 $149,167 9 $97,318 20 $100,170 0 $0
Aggregated Statistics For Year 2004(Based on 3 full and 4 partial tracts) A) FHA, FSA/RHS & VA B) Conventional C) Refinancings D) Home Improvement Loans F) Non-occupant Loans on G) Loans On Manufactured Number Average Value Number Average Value Number Average Value Number Average Value Number Average Value Number Average Value
LOANS ORIGINATED 381 $136,376 1,679 $120,096 912 $131,761 105 $41,934 180 $99,931 25 $61,178 APPLICATIONS APPROVED, NOT ACCEPTED 17 $127,704 224 $120,102 131 $125,906 32 $35,756 43 $113,159 7 $38,143 APPLICATIONS DENIED 93 $133,503 372 $119,155 616 $121,610 156 $32,464 69 $104,789 33 $41,207 APPLICATIONS WITHDRAWN 85 $139,057 288 $129,340 335 $136,632 20 $47,448 35 $105,951 4 $131,210 FILES CLOSED FOR INCOMPLETENESS 9 $141,312 70 $122,115 234 $135,812 3 $36,217 9 $122,933 0 $0
Aggregated Statistics For Year 2003(Based on 3 full and 4 partial tracts) A) FHA, FSA/RHS & VA B) Conventional C) Refinancings D) Home Improvement Loans E) Loans on Dwellings For 5+ Families F) Non-occupant Loans on Number Average Value Number Average Value Number Average Value Number Average Value Number Average Value Number Average Value
LOANS ORIGINATED 426 $132,472 1,539 $126,370 2,419 $125,189 118 $34,467 1 $1,720,000 115 $92,613 APPLICATIONS APPROVED, NOT ACCEPTED 16 $142,747 186 $119,523 249 $128,944 37 $53,760 0 $0 18 $139,940 APPLICATIONS DENIED 95 $132,115 268 $109,978 884 $108,313 135 $25,249 0 $0 45 $86,508 APPLICATIONS WITHDRAWN 83 $135,577 305 $131,165 447 $123,012 10 $86,562 0 $0 17 $94,544 FILES CLOSED FOR INCOMPLETENESS 6 $135,257 70 $127,948 88 $137,912 2 $37,005 1 $1,000,000 5 $142,132
Aggregated Statistics For Year 2002(Based on 3 full and 3 partial tracts) A) FHA, FSA/RHS & VA B) Conventional C) Refinancings D) Home Improvement Loans E) Loans on Dwellings For 5+ Families F) Non-occupant Loans on Number Average Value Number Average Value Number Average Value Number Average Value Number Average Value Number Average Value
LOANS ORIGINATED 440 $130,586 1,172 $120,440 1,209 $127,114 126 $29,475 2 $8,408,500 63 $101,506 APPLICATIONS APPROVED, NOT ACCEPTED 24 $129,141 138 $106,027 136 $106,793 39 $28,564 0 $0 8 $67,844 APPLICATIONS DENIED 42 $136,949 212 $99,196 335 $98,143 122 $25,359 0 $0 22 $85,837 APPLICATIONS WITHDRAWN 94 $131,917 152 $127,895 234 $109,568 13 $23,277 0 $0 13 $95,811 FILES CLOSED FOR INCOMPLETENESS 9 $137,363 69 $127,201 130 $110,306 5 $32,830 1 $800,000 2 $67,730
Aggregated Statistics For Year 2001(Based on 3 full and 3 partial tracts) A) FHA, FSA/RHS & VA B) Conventional C) Refinancings D) Home Improvement Loans F) Non-occupant Loans on Number Average Value Number Average Value Number Average Value Number Average Value Number Average Value
LOANS ORIGINATED 613 $121,786 1,081 $117,951 735 $122,011 166 $27,030 52 $95,186 APPLICATIONS APPROVED, NOT ACCEPTED 23 $129,754 114 $93,873 80 $99,008 57 $33,899 12 $80,422 APPLICATIONS DENIED 44 $112,816 229 $76,845 235 $91,829 114 $24,867 21 $77,497 APPLICATIONS WITHDRAWN 125 $129,020 133 $123,680 155 $105,183 18 $24,322 14 $111,509 FILES CLOSED FOR INCOMPLETENESS 13 $124,483 49 $149,955 45 $110,882 2 $19,565 4 $88,245
Aggregated Statistics For Year 2000(Based on 3 full and 3 partial tracts) A) FHA, FSA/RHS & VA B) Conventional C) Refinancings D) Home Improvement Loans E) Loans on Dwellings For 5+ Families F) Non-occupant Loans on Number Average Value Number Average Value Number Average Value Number Average Value Number Average Value Number Average Value
LOANS ORIGINATED 511 $110,016 812 $110,698 143 $109,394 169 $24,403 0 $0 29 $77,144 APPLICATIONS APPROVED, NOT ACCEPTED 25 $90,730 131 $78,579 38 $89,041 65 $22,196 0 $0 9 $64,678 APPLICATIONS DENIED 43 $84,758 287 $74,236 100 $107,870 117 $19,031 0 $0 16 $67,629 APPLICATIONS WITHDRAWN 69 $115,029 102 $133,813 46 $124,614 7 $42,356 1 $440,920 2 $129,910 FILES CLOSED FOR INCOMPLETENESS 7 $101,777 47 $97,684 30 $113,755 2 $27,700 0 $0 1 $86,590
Aggregated Statistics For Year 1999(Based on 3 full and 4 partial tracts) A) FHA, FSA/RHS & VA B) Conventional C) Refinancings D) Home Improvement Loans E) Loans on Dwellings For 5+ Families F) Non-occupant Loans on Number Average Value Number Average Value Number Average Value Number Average Value Number Average Value Number Average Value
LOANS ORIGINATED 436 $102,692 695 $107,528 313 $101,031 150 $23,588 1 $210,000 34 $70,830 APPLICATIONS APPROVED, NOT ACCEPTED 15 $101,855 123 $81,873 64 $83,877 52 $38,882 0 $0 6 $51,802 APPLICATIONS DENIED 33 $112,315 384 $58,180 129 $69,914 116 $18,744 0 $0 27 $50,523 APPLICATIONS WITHDRAWN 50 $107,978 95 $118,683 84 $86,065 14 $22,051 0 $0 5 $71,132 FILES CLOSED FOR INCOMPLETENESS 9 $104,563 27 $116,910 39 $98,595 4 $27,050 0 $0 0 $0
Detailed HMDA statistics for the following Tracts:
1113.03
, 1113.04 , 1113.05 , 1113.06 , 1114.01 , 1115.19 , 1304.07
Private Mortgage Insurance Companies Aggregated Statistics For Year 2009(Based on 3 full and 4 partial tracts) A) Conventional B) Refinancings C) Non-occupant Loans on Number Average Value Number Average Value Number Average Value
LOANS ORIGINATED 64 $192,130 64 $196,371 0 $0 APPLICATIONS APPROVED, NOT ACCEPTED 23 $215,040 21 $232,201 1 $99,760 APPLICATIONS DENIED 9 $199,529 5 $190,368 0 $0 APPLICATIONS WITHDRAWN 2 $184,335 7 $189,994 0 $0 FILES CLOSED FOR INCOMPLETENESS 3 $197,880 2 $382,885 0 $0
Aggregated Statistics For Year 2008(Based on 3 full and 4 partial tracts) A) Conventional B) Refinancings C) Non-occupant Loans on D) Loans On Manufactured Number Average Value Number Average Value Number Average Value Number Average Value
LOANS ORIGINATED 278 $181,082 65 $184,253 36 $129,287 1 $144,640 APPLICATIONS APPROVED, NOT ACCEPTED 74 $197,746 39 $166,256 20 $120,961 0 $0 APPLICATIONS DENIED 19 $185,217 6 $174,517 8 $133,995 0 $0 APPLICATIONS WITHDRAWN 9 $211,212 5 $209,860 1 $68,570 0 $0 FILES CLOSED FOR INCOMPLETENESS 5 $153,102 1 $259,790 2 $217,365 0 $0
Aggregated Statistics For Year 2007(Based on 3 full and 4 partial tracts) A) Conventional B) Refinancings C) Non-occupant Loans on Number Average Value Number Average Value Number Average Value
LOANS ORIGINATED 385 $175,963 64 $179,356 37 $137,091 APPLICATIONS APPROVED, NOT ACCEPTED 54 $185,454 13 $189,852 7 $153,476 APPLICATIONS DENIED 7 $207,433 0 $0 3 $151,580 APPLICATIONS WITHDRAWN 24 $200,303 5 $133,056 4 $195,208 FILES CLOSED FOR INCOMPLETENESS 1 $181,610 1 $166,050 0 $0
Aggregated Statistics For Year 2006(Based on 3 full and 4 partial tracts) A) Conventional B) Refinancings C) Non-occupant Loans on Number Average Value Number Average Value Number Average Value
LOANS ORIGINATED 213 $165,126 29 $187,297 35 $139,983 APPLICATIONS APPROVED, NOT ACCEPTED 35 $189,174 15 $200,307 3 $118,737 APPLICATIONS DENIED 4 $174,142 0 $0 1 $237,000 APPLICATIONS WITHDRAWN 6 $185,237 4 $218,605 0 $0 FILES CLOSED FOR INCOMPLETENESS 1 $154,040 0 $0 0 $0
Aggregated Statistics For Year 2005(Based on 3 full and 4 partial tracts) A) Conventional B) Refinancings C) Non-occupant Loans on D) Loans On Manufactured Number Average Value Number Average Value Number Average Value Number Average Value
LOANS ORIGINATED 227 $154,478 44 $165,677 33 $123,379 3 $93,857 APPLICATIONS APPROVED, NOT ACCEPTED 38 $156,682 12 $167,262 6 $128,703 0 $0 APPLICATIONS DENIED 2 $149,530 1 $104,580 1 $74,190 0 $0 APPLICATIONS WITHDRAWN 11 $152,653 4 $167,732 0 $0 0 $0 FILES CLOSED FOR INCOMPLETENESS 5 $183,518 2 $154,505 2 $102,505 0 $0
Aggregated Statistics For Year 2004(Based on 3 full and 4 partial tracts) A) Conventional B) Refinancings C) Non-occupant Loans on D) Loans On Manufactured Number Average Value Number Average Value Number Average Value Number Average Value
LOANS ORIGINATED 281 $157,183 69 $154,216 30 $108,076 2 $46,785 APPLICATIONS APPROVED, NOT ACCEPTED 49 $165,697 39 $155,444 5 $106,634 0 $0 APPLICATIONS DENIED 1 $191,000 0 $0 1 $191,000 0 $0 APPLICATIONS WITHDRAWN 20 $206,926 8 $183,568 3 $143,927 0 $0 FILES CLOSED FOR INCOMPLETENESS 9 $158,384 3 $152,457 0 $0 0 $0
Aggregated Statistics For Year 2003(Based on 3 full and 4 partial tracts) A) Conventional B) Refinancings C) Non-occupant Loans on Number Average Value Number Average Value Number Average Value
LOANS ORIGINATED 345 $166,179 239 $150,896 18 $109,838 APPLICATIONS APPROVED, NOT ACCEPTED 53 $165,015 62 $163,001 4 $101,245 APPLICATIONS DENIED 8 $145,471 1 $248,750 3 $127,210 APPLICATIONS WITHDRAWN 26 $185,652 10 $137,470 3 $170,513 FILES CLOSED FOR INCOMPLETENESS 2 $193,600 0 $0 0 $0
Aggregated Statistics For Year 2002(Based on 3 full and 3 partial tracts) A) Conventional B) Refinancings C) Non-occupant Loans on Number Average Value Number Average Value Number Average Value
LOANS ORIGINATED 260 $152,054 99 $159,094 15 $110,558 APPLICATIONS APPROVED, NOT ACCEPTED 41 $158,122 22 $158,039 3 $107,667 APPLICATIONS DENIED 5 $144,340 2 $231,355 2 $189,270 APPLICATIONS WITHDRAWN 15 $160,981 5 $129,960 0 $0 FILES CLOSED FOR INCOMPLETENESS 2 $134,285 0 $0 0 $0
Aggregated Statistics For Year 2001(Based on 3 full and 3 partial tracts) A) Conventional B) Refinancings C) Non-occupant Loans on Number Average Value Number Average Value Number Average Value
LOANS ORIGINATED 258 $149,850 54 $150,569 17 $115,462 APPLICATIONS APPROVED, NOT ACCEPTED 37 $164,165 10 $221,917 0 $0 APPLICATIONS DENIED 8 $211,686 2 $131,415 1 $277,300 APPLICATIONS WITHDRAWN 4 $113,550 3 $184,667 0 $0 FILES CLOSED FOR INCOMPLETENESS 3 $131,000 1 $145,560 0 $0
Aggregated Statistics For Year 2000(Based on 3 full and 3 partial tracts) A) Conventional B) Refinancings C) Non-occupant Loans on Number Average Value Number Average Value Number Average Value
LOANS ORIGINATED 206 $136,606 16 $129,431 3 $80,143 APPLICATIONS APPROVED, NOT ACCEPTED 24 $128,777 12 $122,592 5 $80,200 APPLICATIONS DENIED 10 $124,094 1 $104,750 0 $0 APPLICATIONS WITHDRAWN 5 $106,250 1 $123,000 0 $0 FILES CLOSED FOR INCOMPLETENESS 5 $179,224 1 $124,000 0 $0
Aggregated Statistics For Year 1999(Based on 3 full and 4 partial tracts) A) Conventional B) Refinancings C) Non-occupant Loans on Number Average Value Number Average Value Number Average Value
LOANS ORIGINATED 221 $132,085 52 $137,434 5 $74,610 APPLICATIONS APPROVED, NOT ACCEPTED 26 $140,221 10 $121,974 1 $64,000 APPLICATIONS DENIED 13 $130,973 4 $127,142 0 $0 APPLICATIONS WITHDRAWN 3 $104,760 1 $85,090 0 $0 FILES CLOSED FOR INCOMPLETENESS 3 $132,743 2 $90,395 0 $0
Detailed PMIC statistics for the following Tracts:
1113.03
, 1113.04 , 1113.05 , 1113.06 , 1114.01 , 1115.19 , 1304.07 Fire-safe hotels and motels in Mansfield, Texas:
Holiday Inn Express And Suites, 201 Hwy 287 N, Mansfield, Texas 76063 Phone: (817) 453-8722, Fax: (817) 453-8792
La Quinta Inn & Suites, 1503 Breckenridge Rd, Mansfield, Texas 76063 Phone: (817) 453-5040, Fax: (817) 453-6459
Hampton Inn & Suites Mansfield, 1640 Us Hwy 287 N, Mansfield, Texas 76063 Phone: (817) 539-0060, Fax: (817) 539-0989
Fairfield Inn & Suites, 1480 Us Hwy 287 N, Mansfield, Texas 76063 Phone: (817) 473-2700, Fax: (817) 473-2709
Best Western Mansfield, 775 N Hwy 287, Mansfield, Texas 76063 Phone: (817) 539-0707, Fax: (817) 539-0306
All 5 fire-safe hotels and motels in Mansfield, Texas
Most common first names in Mansfield, TX among deceased individuals Name Count Lived (average)
James 92 71.4 years Mary 85 80.9 years John 78 74.7 years William 72 75.3 years Robert 60 69.4 years Charles 36 70.6 years Dorothy 35 75.6 years Thomas 29 73.1 years Joe 27 70.6 years Betty 26 68.4 years
Most common last names in Mansfield, TX among deceased individuals Last name Count Lived (average)
Smith 37 74.8 years Wilson 30 74.7 years Johnson 29 74.4 years Jones 26 78.5 years Brown 25 81.0 years Williams 25 70.9 years Martin 21 78.5 years Thompson 20 73.5 years Moore 17 77.8 years Davis 17 67.2 years
Mansfield compared to Texas state average:
Median household income above state average. Unemployed percentage significantly below state average. Black race population percentage significantly above state average. Foreign-born population percentage above state average. Renting percentage below state average. Number of rooms per house above state average. House age significantly below state average. Number of college students above state average. Percentage of population with a bachelor's degree or higher above state average.
#10 on the list of "Top 100 cities with highest median household income and median resident age less than 35 (pop. 50,000+)"
#14 on the list of "Top 100 cities with newest houses (pop. 50,000+)"
#17 on the list of "Top 101 cities with largest percentage of females in occupations: education, training, and library occupations (population 50,000+)"
#18 on the list of "Top 101 cities with the largest percentage population increase from 2000 (population 50,000+)"
#18 on the list of "Top 100 cities with lowest ratio of median house value to median household income (pop. 50,000+)"
#28 on the list of "Top 101 cities with largest percentage of females in industries: educational services (population 50,000+)"
#28 on the list of "Top 100 fastest growing cities from 2000 to 2014 (pop. 50,000+)"
#31 on the list of "Top 101 cities with the least people below 50% of the poverty level (population 50,000+)"
#36 on the list of "Top 101 cities with largest percentage of males in occupations: education, training, and library occupations (population 50,000+)"
#38 on the list of "Top 101 cities with largest percentage of females in industries: management of companies and enterprises (population 50,000+)"
#40 on the list of "Top 101 cities with largest percentage population increases in the 1990s) (population 50,000+)"
#42 on the list of "Top 100 cities with biggest houses (pop. 50,000+)"
#50 on the list of "Top 101 cities with largest percentage of males in occupations: healthcare support occupations (population 50,000+)"
#51 on the list of "Top 101 cities with the largest percentage of people in other types of correctional institutions (population 1,000+)"
#57 on the list of "Top 101 cities with the hottest summers (population 50,000+)"
#58 on the list of "Top 100 cities with highest median household income (pop. 50,000+)"
#59 on the list of "Top 101 cities with most building permits per 10,000 residents (population 50,000+)"
#63 on the list of "Top 101 cities with largest percentage of females in industries: wholesale trade (population 50,000+)"
#69 on the list of "Top 101 cities with largest percentage of males in occupations: management occupations (population 50,000+)"
#73 on the list of "Top 101 larger cities with the highest increase in household income from 2000 (population 50,000+)"
#4 on the list of "Top 101 counties with the most Evangelical Protestant adherents"
#5 on the list of "Top 101 counties with the most Evangelical Protestant congregations"
#7 on the list of "Top 101 counties with the most Mainline Protestant adherents"
#13 on the list of "Top 101 counties with the most Black Protestant congregations"
#28 on the list of "Top 101 counties with the most Black Protestant adherents"
Top Patent Applicants
Donald S. Rahrig (15)
Melaney Northrop (13)
James Marshall Barker (11)
Carl A. May (10)
Eric W. Stratton (9)
Bradley D. Linton (7)
Stanley W. Sipe (7)
Lei Shi (7)
Todd A. Garcia (7)
Raymond G. Jay (6)
Total of 421 patent applications in 2008-2024.

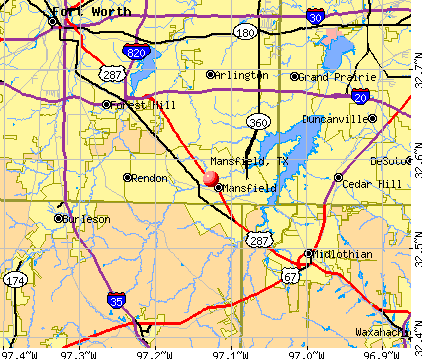


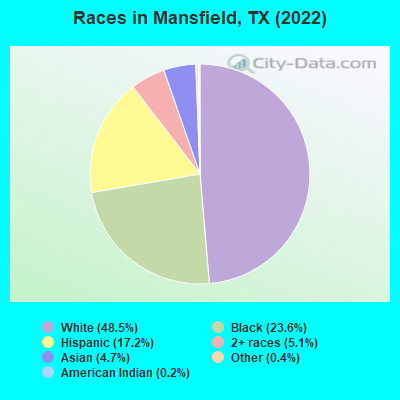
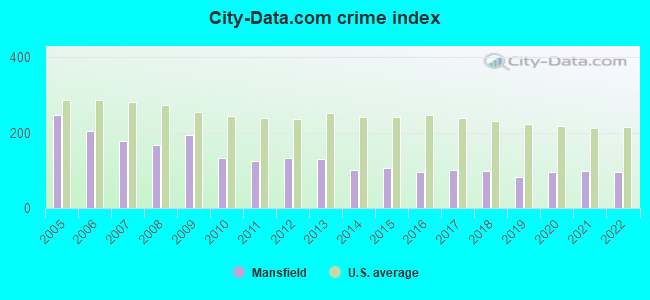
 Recent articles from our blog. Our writers, many of them Ph.D. graduates or candidates, create easy-to-read articles on a wide variety of topics.

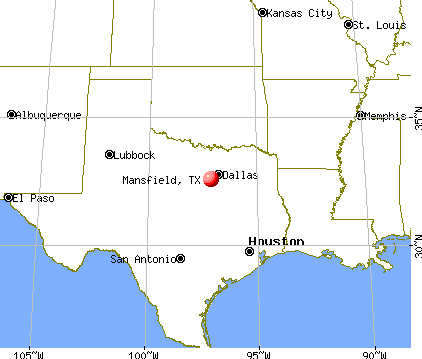
 (8.9 miles
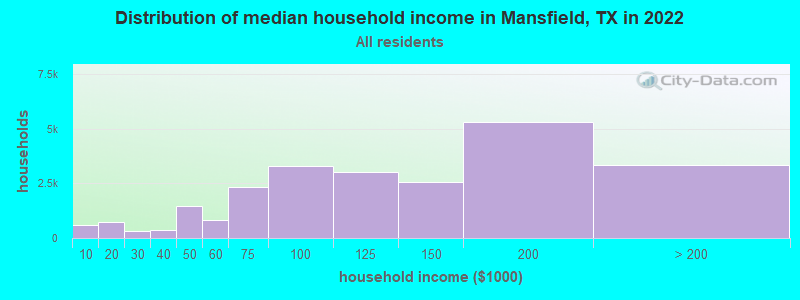
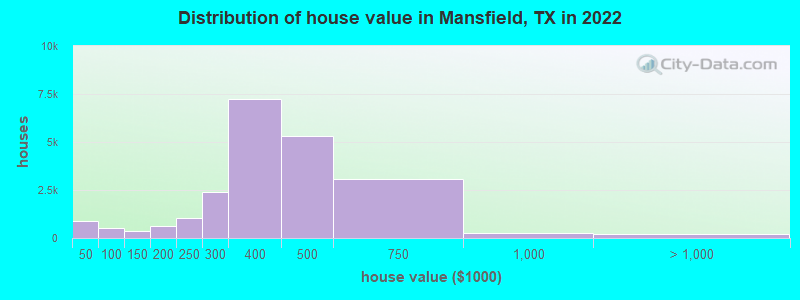

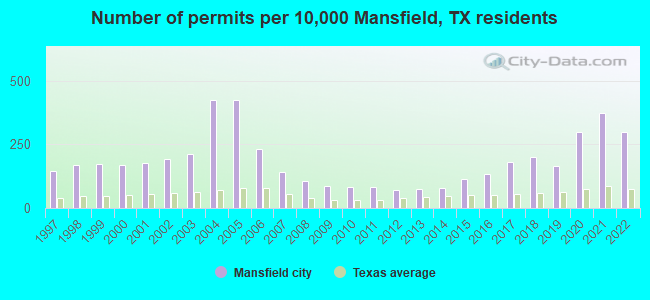
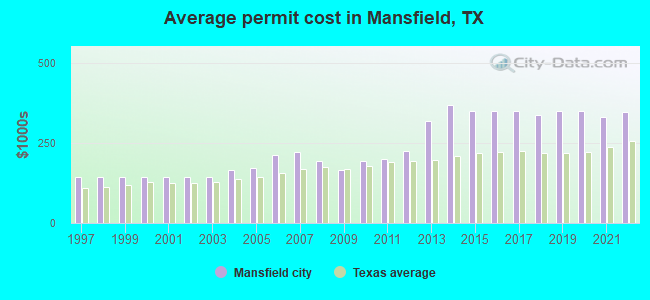
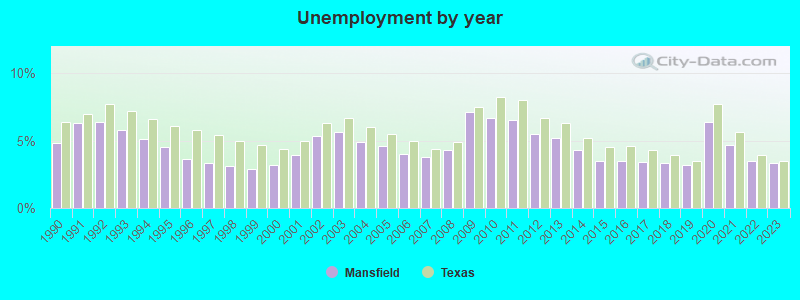
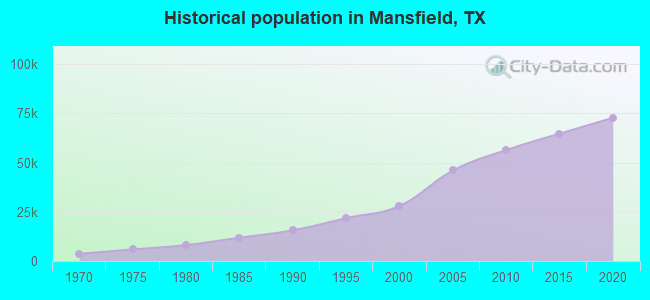
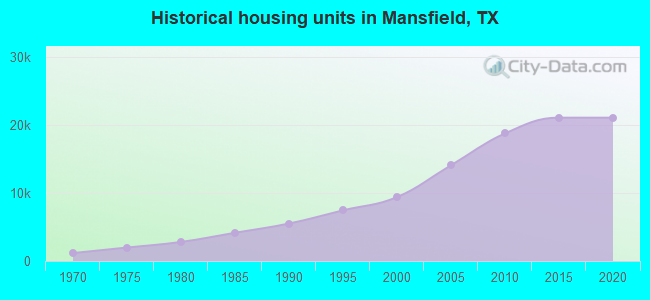
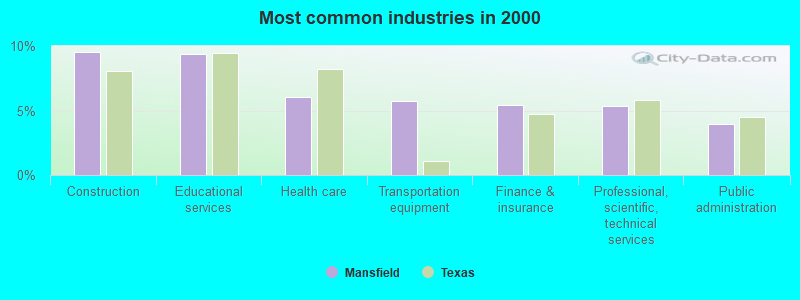
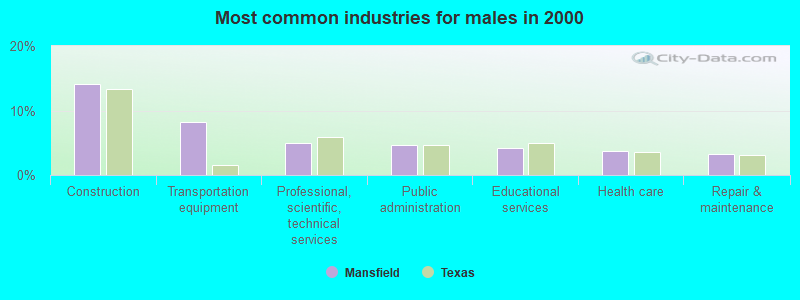
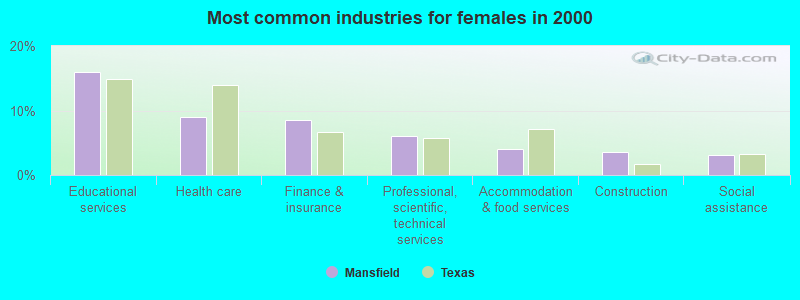
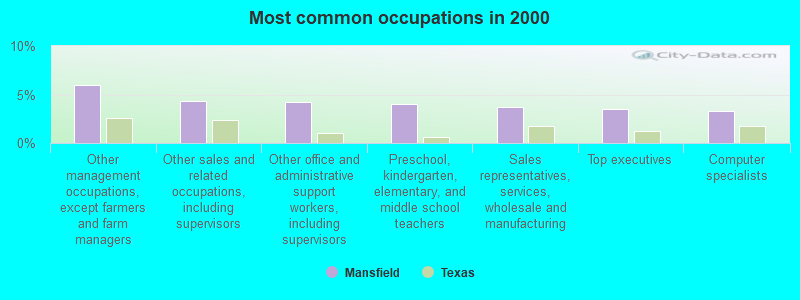
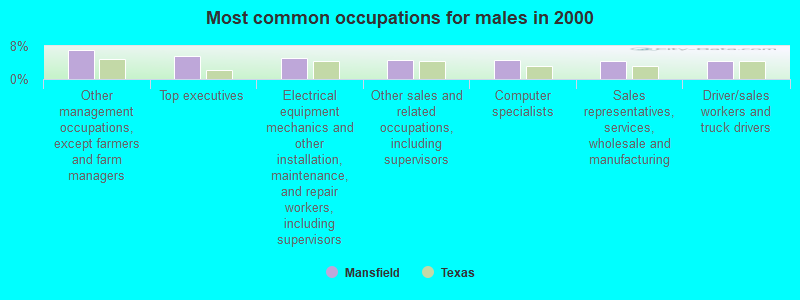
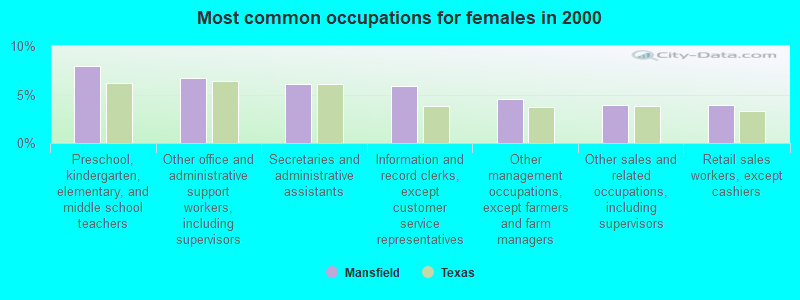
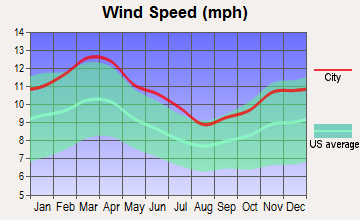
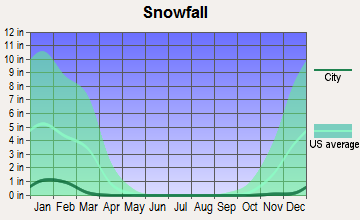
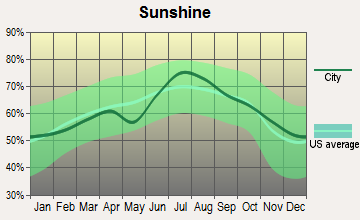
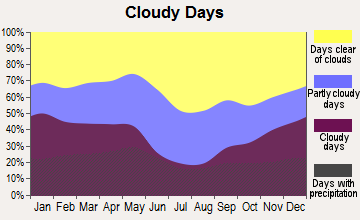

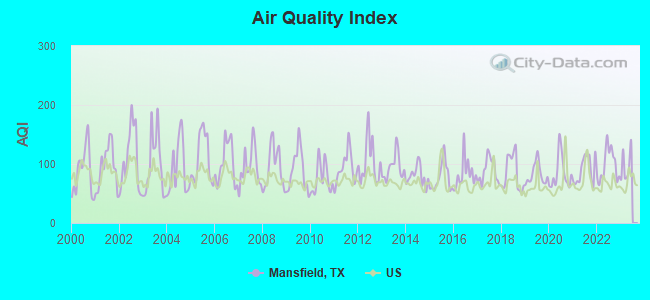
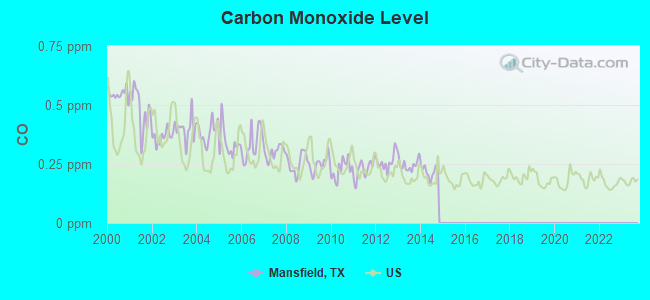
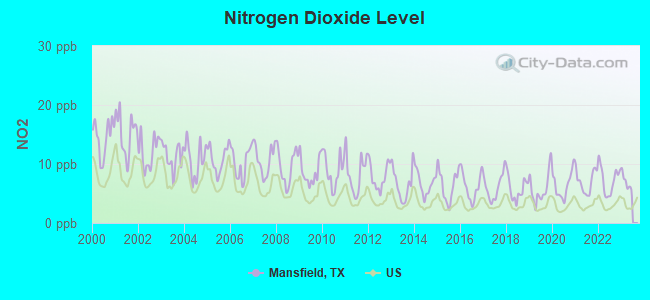
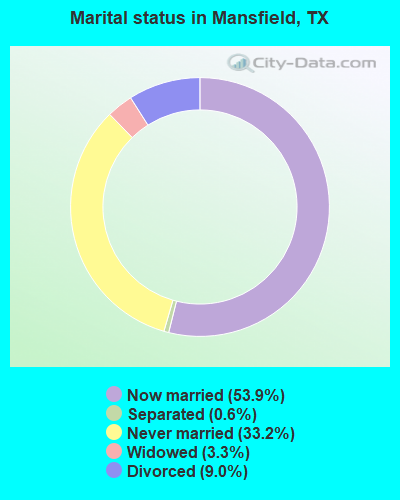
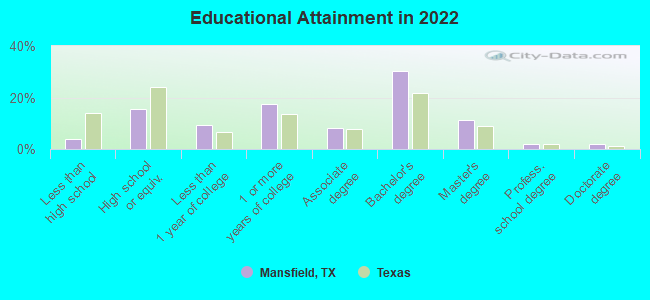
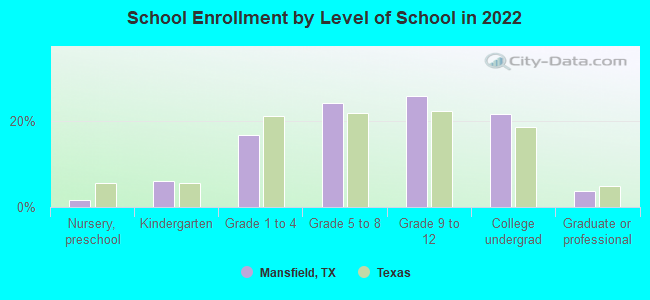
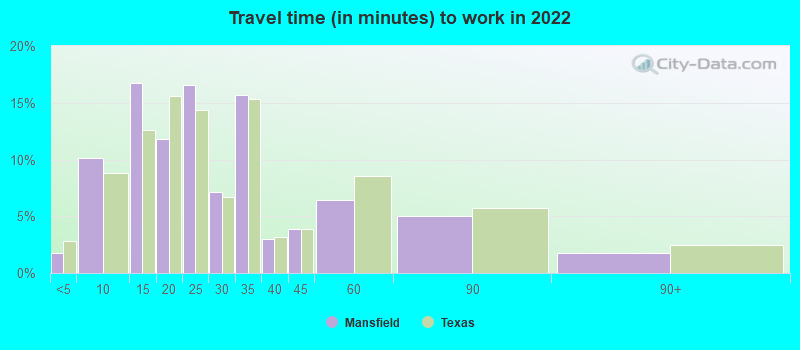
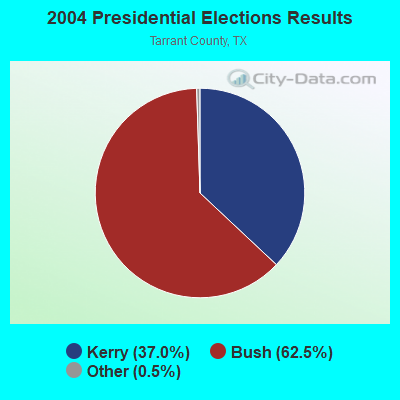
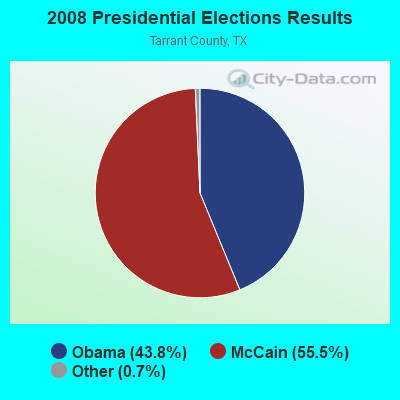
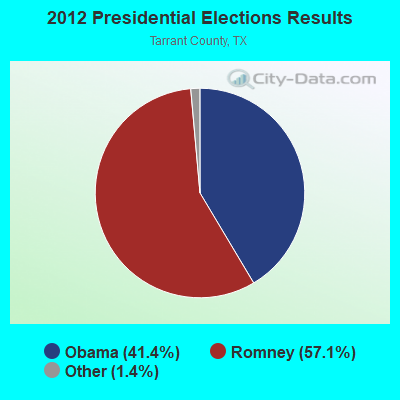
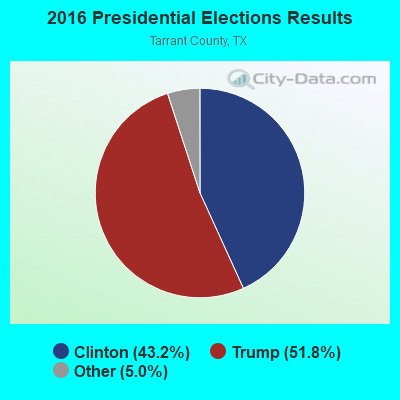
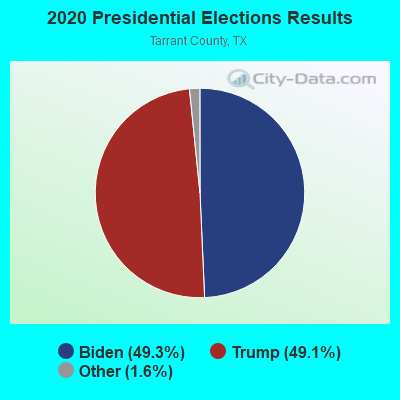
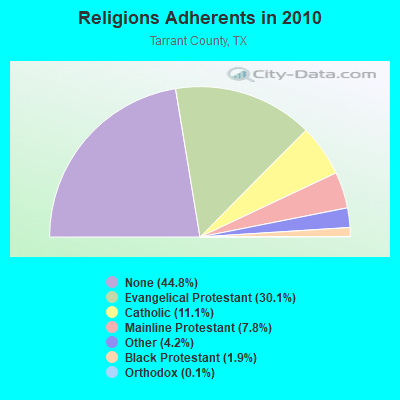
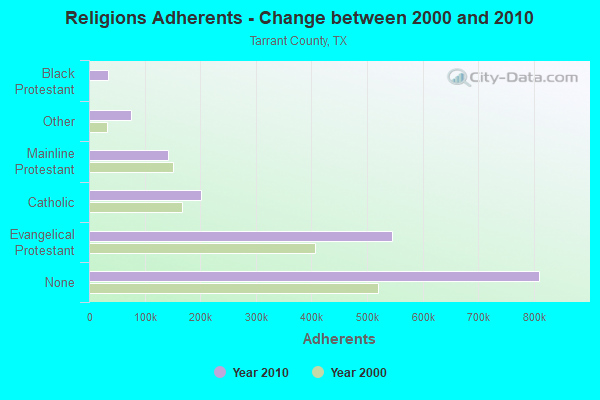
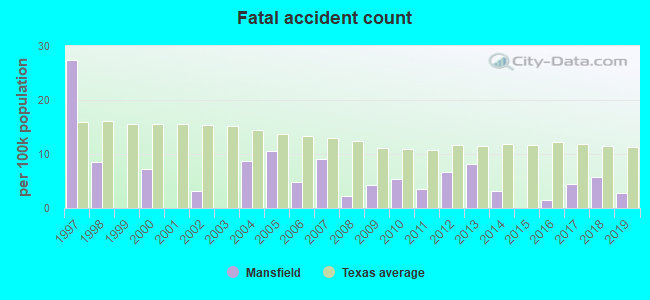
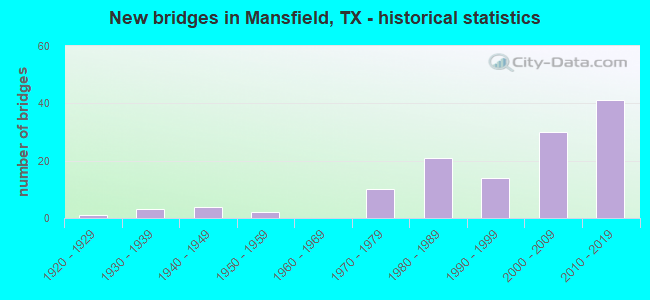
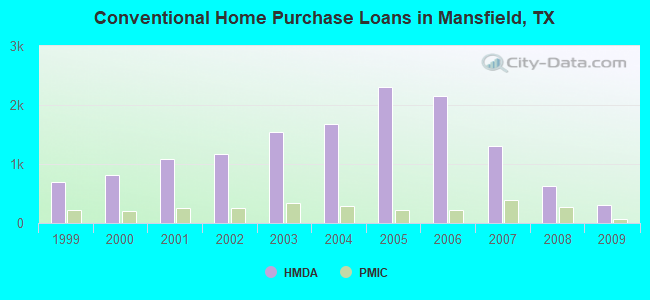
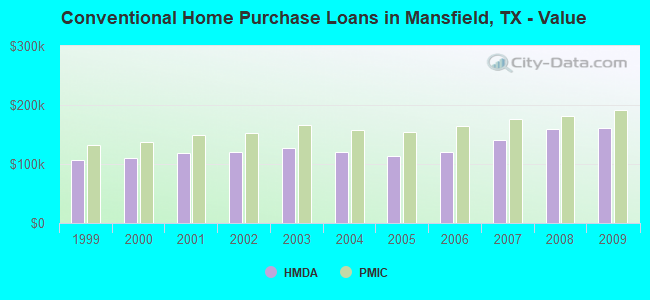
 Based on the data from the years 2002 - 2018 the average number of fire incidents per year is 171. The highest number of reported fire incidents - 294 took place in 2011, and the least - 121 in 2013. The data has an increasing trend.
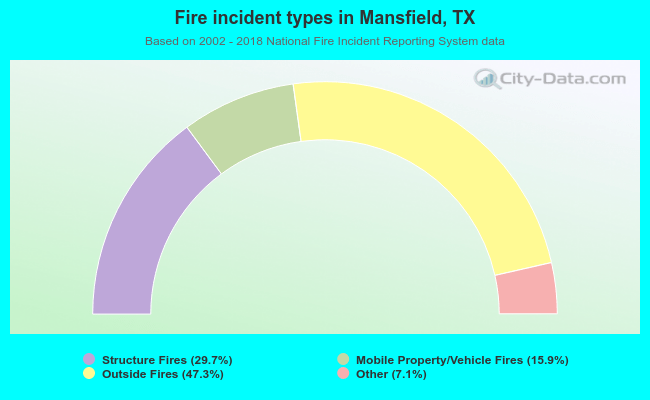 When looking into fire subcategories, the most reports belonged to: Outside Fires (47.3%), and Structure Fires (29.7%).