Races in Mequon, Wisconsin (WI) Detailed Stats
Data:
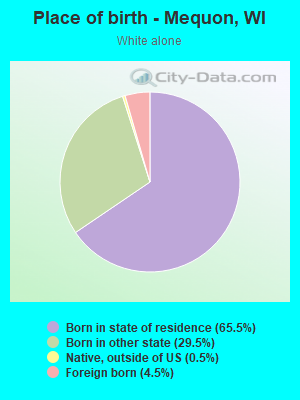
Races - White alone (%)
Races - White alone (% change since 2000)
Races - Black alone (%)
Races - Black alone (% change since 2000)
Races - American Indian alone (%)
Races - American Indian alone (% change since 2000)
Races - Asian alone (%)
Races - Asian alone (% change since 2000)
Races - Hispanic (%)
Races - Hispanic (% change since 2000)
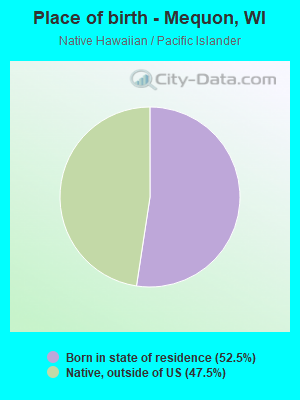
Races - Native Hawaiian and Other Pacific Islander alone (%)
Races - Native Hawaiian and Other Pacific Islander alone (% change since 2000)
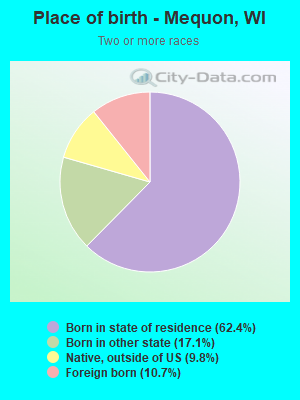
Races - Two or more races(%)
Races - Two or more races(% change since 2000)
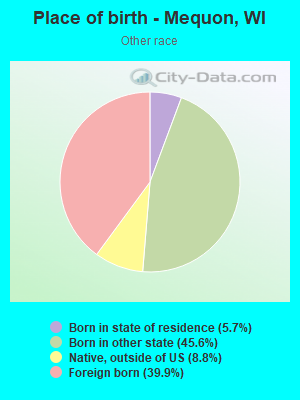
Races - Other race alone (%)
Races - Other race alone (% change since 2000)
Racial diversity
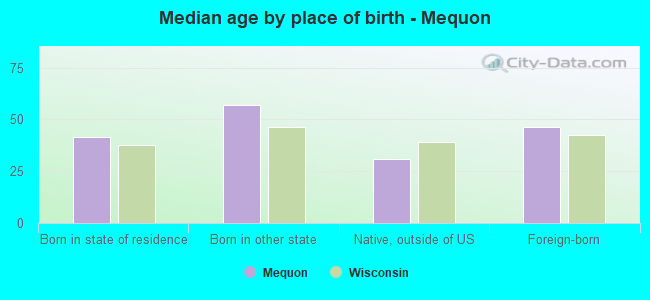
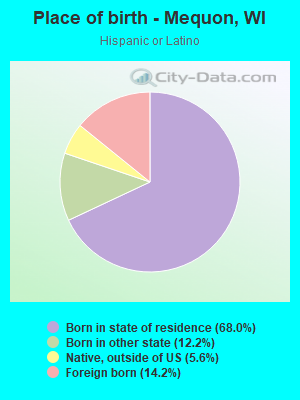
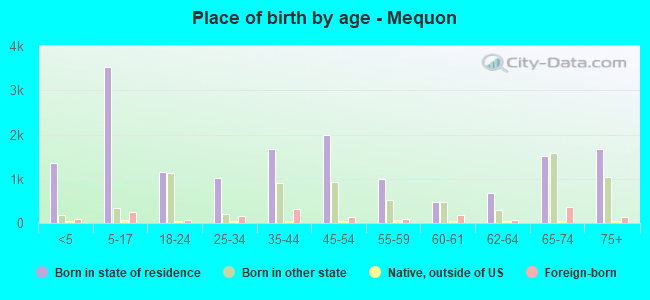
Place of birth - Born in state of residence (%)
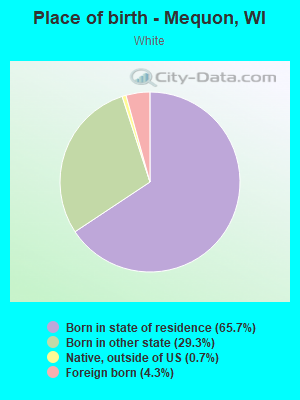
Place of birth - Born in state of residence (%) - White
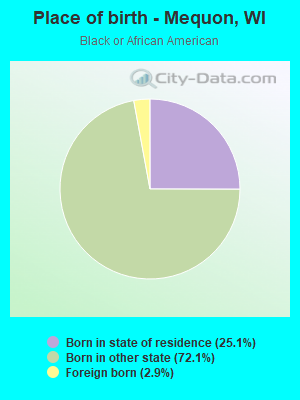
Place of birth - Born in state of residence (%) - Black or African American
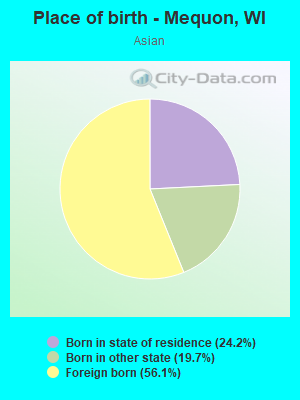
Place of birth - Born in state of residence (%) - Asian
Place of birth - Born in state of residence (%) - Hispanic or Latino
Place of birth - Born in state of residence (%) - American Indian and Alaska Native
Place of birth - Born in state of residence (%) - Multirace
Place of birth - Born in state of residence (%) - Other Race
Place of birth - Born in other state (%)
Place of birth - Born in other state (%) - White
Place of birth - Born in other state (%) - Black or African American
Place of birth - Born in other state (%) - Asian
Place of birth - Born in other state (%) - Hispanic or Latino
Place of birth - Born in other state (%) - American Indian and Alaska Native
Place of birth - Born in other state (%) - Multirace
Place of birth - Born in other state (%) - Other Race
Place of birth - Native, outside of US (%)
Place of birth - Native, outside of US (%) - White
Place of birth - Native, outside of US (%) - Black or African American
Place of birth - Native, outside of US (%) - Asian
Place of birth - Native, outside of US (%) - Hispanic or Latino
Place of birth - Native, outside of US (%) - American Indian and Alaska Native
Place of birth - Native, outside of US (%) - Multirace
Place of birth - Native, outside of US (%) - Other Race
Place of birth - Foreign born (%)
Place of birth - Foreign born (%) - White
Place of birth - Foreign born (%) - Black or African American
Place of birth - Foreign born (%) - Asian
Place of birth - Foreign born (%) - Hispanic or Latino
Place of birth - Foreign born (%) - American Indian and Alaska Native
Place of birth - Foreign born (%) - Multirace
Place of birth - Foreign born (%) - Other Race
Residents speaking English at home (%)
Residents speaking English at home - Born in the United States (%)
Residents speaking English at home - Native, born elsewhere (%)
Residents speaking English at home - Foreign born (%)
Residents speaking Spanish at home (%)
Residents speaking Spanish at home - Born in the United States (%)
Residents speaking Spanish at home - Native, born elsewhere (%)
Residents speaking Spanish at home - Foreign born (%)
Residents speaking other language at home (%)
Residents speaking other language at home - Born in the United States (%)
Residents speaking other language at home - Native, born elsewhere (%)
Residents speaking other language at home - Foreign born (%)
Marital status - Never married (%)
Marital status - Now married (%)
Marital status - Separated (%)
Marital status - Widowed (%)
Marital status - Divorced (%)
Ancestries Reported - Arab (%)
Ancestries Reported - Czech (%)
Ancestries Reported - Danish (%)
Ancestries Reported - Dutch (%)
Ancestries Reported - English (%)
Ancestries Reported - French (%)
Ancestries Reported - French Canadian (%)
Ancestries Reported - German (%)
Ancestries Reported - Greek (%)
Ancestries Reported - Hungarian (%)
Ancestries Reported - Irish (%)
Ancestries Reported - Italian (%)
Ancestries Reported - Lithuanian (%)
Ancestries Reported - Norwegian (%)
Ancestries Reported - Polish (%)
Ancestries Reported - Portuguese (%)
Ancestries Reported - Russian (%)
Ancestries Reported - Scotch-Irish (%)
Ancestries Reported - Scottish (%)
Ancestries Reported - Slovak (%)
Ancestries Reported - Subsaharan African (%)
Ancestries Reported - Swedish (%)
Ancestries Reported - Swiss (%)
Ancestries Reported - Ukrainian (%)
Ancestries Reported - United States (%)
Ancestries Reported - Welsh (%)
Ancestries Reported - West Indian (%)
Ancestries Reported - Other (%)
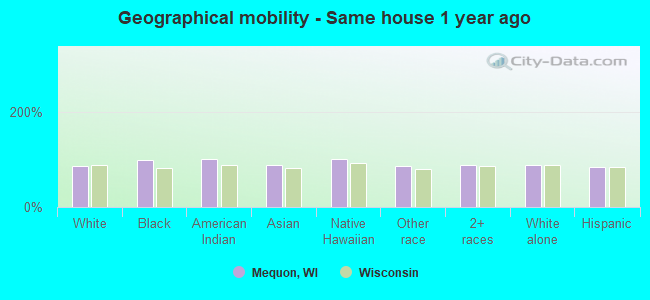
Geographical mobility - Same house 1 year ago (%)
Geographical mobility - Same house 1 year ago (%) - White
Geographical mobility - Same house 1 year ago (%) - Black or African American
Geographical mobility - Same house 1 year ago (%) - Asian
Geographical mobility - Same house 1 year ago (%) - Hispanic or Latino
Geographical mobility - Same house 1 year ago (%) - American Indian and Alaska Native
Geographical mobility - Same house 1 year ago (%) - Multirace
Geographical mobility - Same house 1 year ago (%) - Other Race
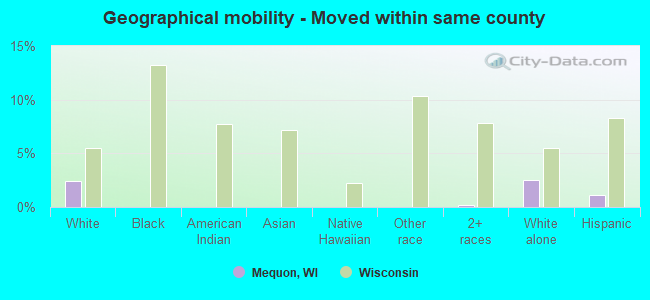
Geographical mobility - Moved within same county (%)
Geographical mobility - Moved within same county (%) - White
Geographical mobility - Moved within same county (%) - Black or African American
Geographical mobility - Moved within same county (%) - Asian
Geographical mobility - Moved within same county (%) - Hispanic or Latino
Geographical mobility - Moved within same county (%) - American Indian and Alaska Native
Geographical mobility - Moved within same county (%) - Multirace
Geographical mobility - Moved within same county (%) - Other Race
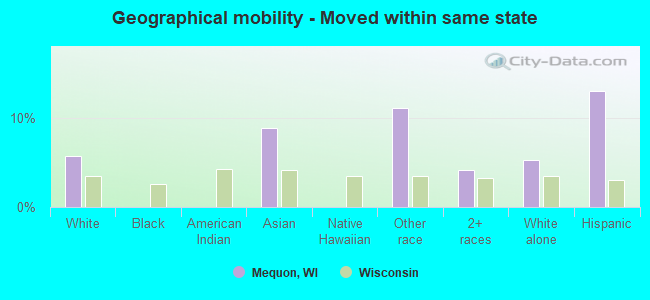
Geographical mobility - Moved from different county within same state (%)
Geographical mobility - Moved from different county within same state (%) - White
Geographical mobility - Moved from different county within same state (%) - Black or African American
Geographical mobility - Moved from different county within same state (%) - Asian
Geographical mobility - Moved from different county within same state (%) - Hispanic or Latino
Geographical mobility - Moved from different county within same state (%) - American Indian and Alaska Native
Geographical mobility - Moved from different county within same state (%) - Multirace
Geographical mobility - Moved from different county within same state (%) - Other Race
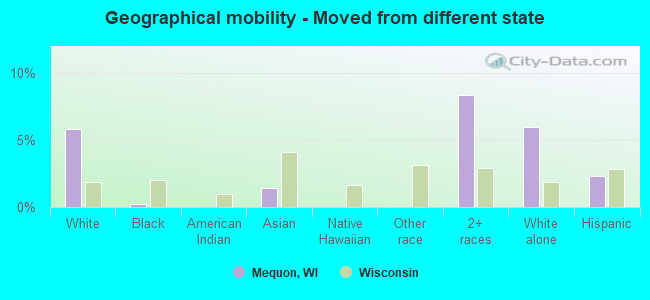
Geographical mobility - Moved from different state (%)
Geographical mobility - Moved from different state (%) - White
Geographical mobility - Moved from different state (%) - Black or African American
Geographical mobility - Moved from different state (%) - Asian
Geographical mobility - Moved from different state (%) - Hispanic or Latino
Geographical mobility - Moved from different state (%) - American Indian and Alaska Native
Geographical mobility - Moved from different state (%) - Multirace
Geographical mobility - Moved from different state (%) - Other Race
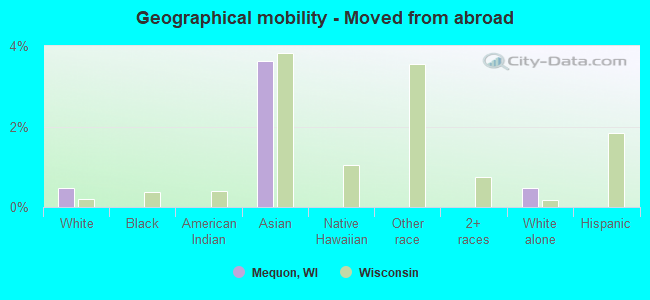
Geographical mobility - Moved from abroad (%)
Geographical mobility - Moved from abroad (%) - White
Geographical mobility - Moved from abroad (%) - Black or African American
Geographical mobility - Moved from abroad (%) - Asian
Geographical mobility - Moved from abroad (%) - Hispanic or Latino
Geographical mobility - Moved from abroad (%) - American Indian and Alaska Native
Geographical mobility - Moved from abroad (%) - Multirace
Geographical mobility - Moved from abroad (%) - Other Race
Place of birth for the foreign-born population - Ireland (%)
Place of birth for the foreign-born population - Denmark (%)
Place of birth for the foreign-born population - Norway (%)
Place of birth for the foreign-born population - Sweden (%)
Place of birth for the foreign-born population - United Kingdom (%)
Place of birth for the foreign-born population - England (%)
Place of birth for the foreign-born population - Scotland (%)
Place of birth for the foreign-born population - Other Northern Europe (%)
Place of birth for the foreign-born population - Austria (%)
Place of birth for the foreign-born population - Belgium (%)
Place of birth for the foreign-born population - France (%)
Place of birth for the foreign-born population - Germany (%)
Place of birth for the foreign-born population - Netherlands (%)
Place of birth for the foreign-born population - Switzerland (%)
Place of birth for the foreign-born population - Other Western Europe (%)
Place of birth for the foreign-born population - Greece (%)
Place of birth for the foreign-born population - Italy (%)
Place of birth for the foreign-born population - Portugal (%)
Place of birth for the foreign-born population - Spain (%)
Place of birth for the foreign-born population - Other Southern Europe (%)
Place of birth for the foreign-born population - Albania (%)
Place of birth for the foreign-born population - Belarus (%)
Place of birth for the foreign-born population - Bosnia and Herzegovina (%)
Place of birth for the foreign-born population - Bulgaria (%)
Place of birth for the foreign-born population - Croatia (%)
Place of birth for the foreign-born population - Czechoslovakia (%)
Place of birth for the foreign-born population - Hungary (%)
Place of birth for the foreign-born population - Latvia (%)
Place of birth for the foreign-born population - Lithuania (%)
Place of birth for the foreign-born population - North Macedonia (Macedonia) (%)
Place of birth for the foreign-born population - Moldova (%)
Place of birth for the foreign-born population - Poland (%)
Place of birth for the foreign-born population - Romania (%)
Place of birth for the foreign-born population - Russia (%)
Place of birth for the foreign-born population - Serbia (%)
Place of birth for the foreign-born population - Ukraine (%)
Place of birth for the foreign-born population - Other Eastern Europe (%)
Place of birth for the foreign-born population - China (%)
Place of birth for the foreign-born population - Hong Kong (%)
Place of birth for the foreign-born population - Taiwan (%)
Place of birth for the foreign-born population - Japan (%)
Place of birth for the foreign-born population - Korea (%)
Place of birth for the foreign-born population - Other Eastern Asia (%)
Place of birth for the foreign-born population - Afghanistan (%)
Place of birth for the foreign-born population - Bangladesh (%)
Place of birth for the foreign-born population - India (%)
Place of birth for the foreign-born population - Iran (%)
Place of birth for the foreign-born population - Kazakhstan (%)
Place of birth for the foreign-born population - Nepal (%)
Place of birth for the foreign-born population - Pakistan (%)
Place of birth for the foreign-born population - Sri Lanka (%)
Place of birth for the foreign-born population - Uzbekistan (%)
Place of birth for the foreign-born population - Other South Central Asia (%)
Place of birth for the foreign-born population - Burma (%)
Place of birth for the foreign-born population - Cambodia (%)
Place of birth for the foreign-born population - Indonesia (%)
Place of birth for the foreign-born population - Laos (%)
Place of birth for the foreign-born population - Malaysia (%)
Place of birth for the foreign-born population - Philippines (%)
Place of birth for the foreign-born population - Singapore (%)
Place of birth for the foreign-born population - Thailand (%)
Place of birth for the foreign-born population - Vietnam (%)
Place of birth for the foreign-born population - Other South Eastern Asia (%)
Place of birth for the foreign-born population - Armenia (%)
Place of birth for the foreign-born population - Iraq (%)
Place of birth for the foreign-born population - Israel (%)
Place of birth for the foreign-born population - Jordan (%)
Place of birth for the foreign-born population - Kuwait (%)
Place of birth for the foreign-born population - Lebanon (%)
Place of birth for the foreign-born population - Saudi Arabia (%)
Place of birth for the foreign-born population - Syria (%)
Place of birth for the foreign-born population - Turkey (%)
Place of birth for the foreign-born population - Yemen (%)
Place of birth for the foreign-born population - Other Western Asia (%)
Place of birth for the foreign-born population - Eritrea (%)
Place of birth for the foreign-born population - Ethiopia (%)
Place of birth for the foreign-born population - Kenya (%)
Place of birth for the foreign-born population - Somalia (%)
Place of birth for the foreign-born population - Uganda (%)
Place of birth for the foreign-born population - Zimbabwe (%)
Place of birth for the foreign-born population - Other Eastern Africa (%)
Place of birth for the foreign-born population - Cameroon (%)
Place of birth for the foreign-born population - Congo (%)
Place of birth for the foreign-born population - Democratic Republic of Congo (Zaire) (%)
Place of birth for the foreign-born population - Other Middle Africa (%)
Place of birth for the foreign-born population - Egypt (%)
Place of birth for the foreign-born population - Morocco (%)
Place of birth for the foreign-born population - Sudan (%)
Place of birth for the foreign-born population - Other Northern Africa (%)
Place of birth for the foreign-born population - South Africa (%)
Place of birth for the foreign-born population - Other Southern Africa (%)
Place of birth for the foreign-born population - Cabo Verde (%)
Place of birth for the foreign-born population - Ghana (%)
Place of birth for the foreign-born population - Liberia (%)
Place of birth for the foreign-born population - Nigeria (%)
Place of birth for the foreign-born population - Senegal (%)
Place of birth for the foreign-born population - Sierra Leone (%)
Place of birth for the foreign-born population - Other Western Africa (%)
Place of birth for the foreign-born population - Australia (%)
Place of birth for the foreign-born population - New Zealand (%)
Place of birth for the foreign-born population - Fiji (%)
Place of birth for the foreign-born population - Micronesia (%)
Place of birth for the foreign-born population - Bahamas (%)
Place of birth for the foreign-born population - Barbados (%)
Place of birth for the foreign-born population - Cuba (%)
Place of birth for the foreign-born population - Dominica (%)
Place of birth for the foreign-born population - Dominican Republic (%)
Place of birth for the foreign-born population - Grenada (%)
Place of birth for the foreign-born population - Haiti (%)
Place of birth for the foreign-born population - Jamaica (%)
Place of birth for the foreign-born population - St. Vincent and the Grenadines (%)
Place of birth for the foreign-born population - Trinidad and Tobago (%)
Place of birth for the foreign-born population - West Indies (%)
Place of birth for the foreign-born population - Other Caribbean (%)
Place of birth for the foreign-born population - Belize (%)
Place of birth for the foreign-born population - Costa Rica (%)
Place of birth for the foreign-born population - El Salvador (%)
Place of birth for the foreign-born population - Guatemala (%)
Place of birth for the foreign-born population - Honduras (%)
Place of birth for the foreign-born population - Mexico (%)
Place of birth for the foreign-born population - Nicaragua (%)
Place of birth for the foreign-born population - Panama (%)
Place of birth for the foreign-born population - Other Central America (%)
Place of birth for the foreign-born population - Argentina (%)
Place of birth for the foreign-born population - Bolivia (%)
Place of birth for the foreign-born population - Brazil (%)
Place of birth for the foreign-born population - Chile (%)
Place of birth for the foreign-born population - Colombia (%)
Place of birth for the foreign-born population - Ecuador (%)
Place of birth for the foreign-born population - Guyana (%)
Place of birth for the foreign-born population - Peru (%)
Place of birth for the foreign-born population - Uruguay (%)
Place of birth for the foreign-born population - Venezuela (%)
Place of birth for the foreign-born population - Other South America (%)
Place of birth for the foreign-born population - Canada (%)
Place of birth for the foreign-born population - Other Northern America (%)
Place of birth for the foreign-born population - Other (%)
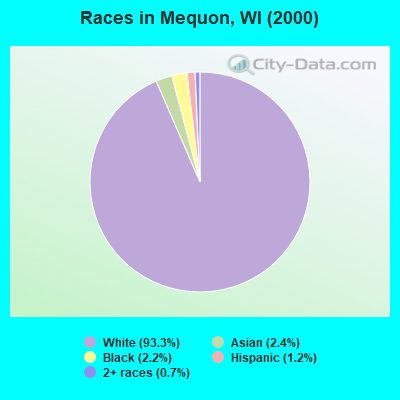
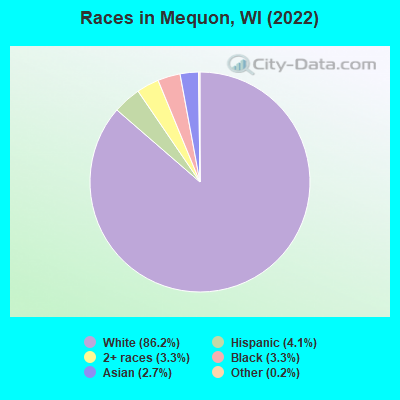
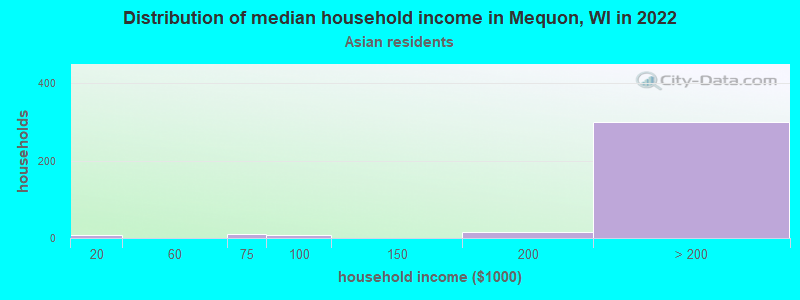
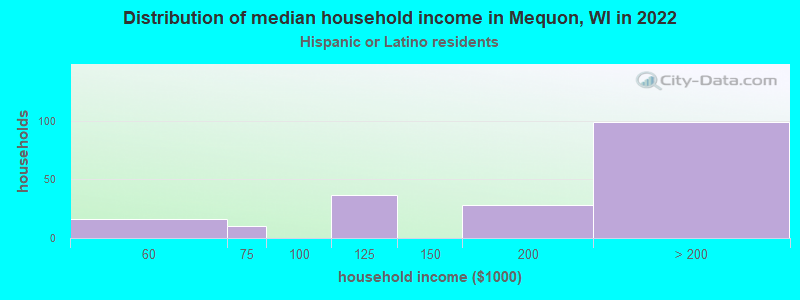
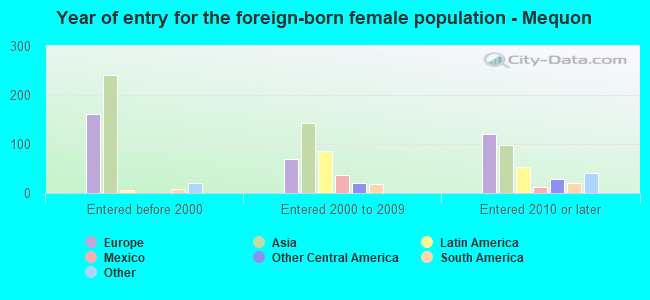
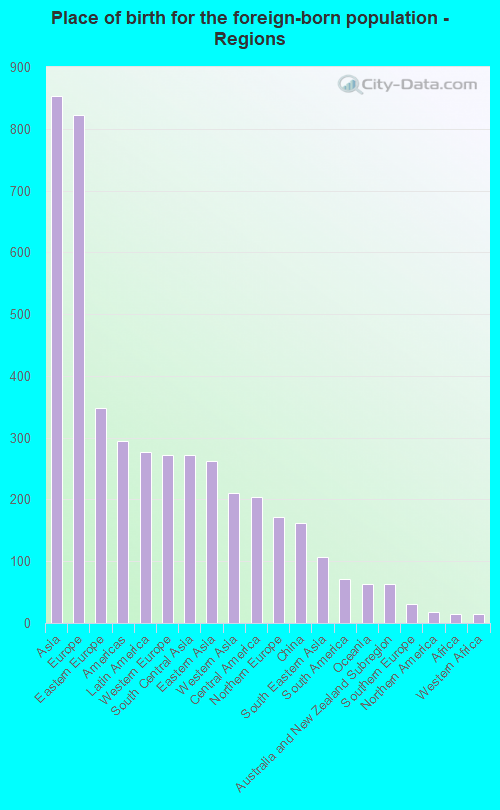
According to 2022 data, the most numerous races in Mequon, WI are White alone (21,929 residents), Hispanic (1,044 residents), and Black alone (828 residents). 91.7% of Mequon residents speak English at home. 8.1% of Mequon, WI residents are foreign-born (3.4% born in Asia, 3.3% born in Europe, 1.1% born in Latin America), which is 38.0% greater than the foreign-born rate of 5.0% across the entire state of Wisconsin.
Race distribution in Mequon
2000 2022
4,681,630 87.3% White alone 300,245 5.6% Black alone 192,921 3.6% Hispanic 87,995 1.6% Asian alone 51,921 1.0% Two or more races 43,980 0.8% American Indian alone 3,637 0.07% Other race alone 1,346 0.03% Native Hawaiian and Other
4,654,031 79.0% White alone 447,022 7.6% Hispanic 345,678 5.9% Black alone 217,532 3.7% Two or more races 172,242 2.9% Asian alone 33,762 0.6% American Indian alone 19,680 0.3% Other race alone 2,592 0.04% Native Hawaiian and Other
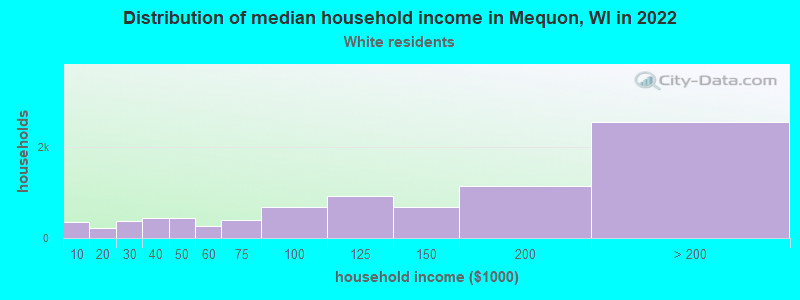
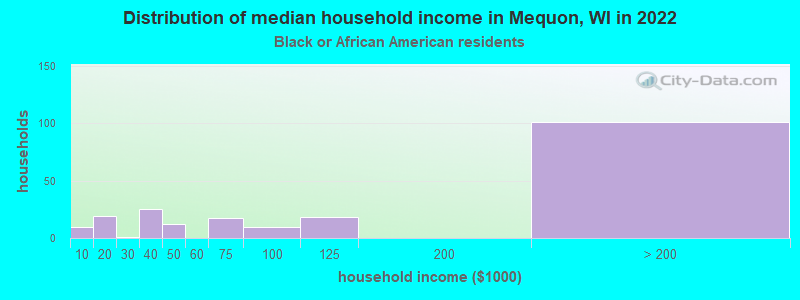
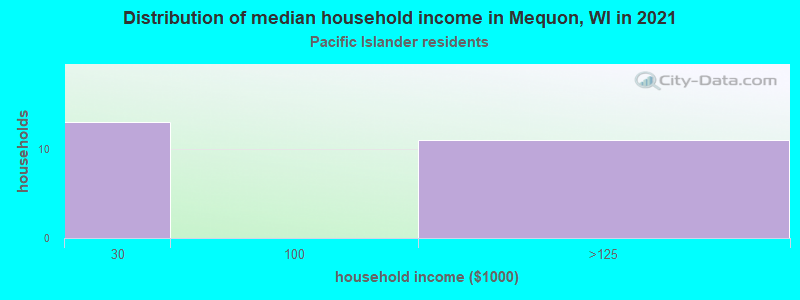
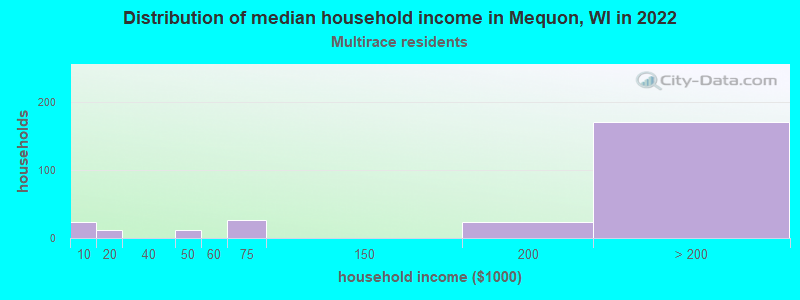
Income and house value in Mequon Median household income in 2022 $133,124 White non-Hispanic householdersover $200,000 Black householdersover $200,000 Asian householders$151,553 Two or more races householders$134,652 Hispanic or Latino race householdersMedian 2022 house value $508,117 White Non-Hispanic householders$465,925 Black or African American householders$171,593 American Indian or Alaska Native householders $824,252 Asian householders$492,169 Some other race householders$454,217 Two or more races householders$398,499 Hispanic or Latino householders
Median age by race in Mequon
47.9 Median age for White residents48.6 48.0 68.5 Median age for Black or African American residents77.2 68.0 49.6 Median age for American Indian / Alaska Native residents-704,819,276.4 -725,394,235.3 40.2 Median age for Asian residents38.6 41.3 -825,688,072.6 Median age for Native Hawaiian / Pacific Islander residents-862,745,097.2 -732,444,443.7 18.1 Median age for Other race residents19.1 14.6 25.0 Median age for Two or more races residents23.9 27.6 48.2 Median age for White alone residents48.7 48.1 24.2 Median age for Hispanic or Latino residents35.0 20.7
Owner/renter occupied households by race in Mequon
House owners and renters - White residents 6,809 81.3% Owner occupied1,568 18.7% Renter occupiedHouse owners and renters - Black or African American residents 211 87.8% Owner occupied29 12.2% Renter occupiedHouse owners and renters - American Indian / Alaska Native residents 6 100.0% Renter occupiedHouse owners and renters - Asian residents 272 85.6% Owner occupied46 14.4% Renter occupiedHouse owners and renters - Native Hawaiian / Pacific Islander residents 18 100.0% Owner occupiedHouse owners and renters - Other race residents 13 100.0% Renter occupiedHouse owners and renters - Two or more races residents 229 70.5% Owner occupied96 29.5% Renter occupiedHouse owners and renters - White alone residents 6,772 81.3% Owner occupied1,558 18.7% Renter occupiedHouse owners and renters - Hispanic or Latino residents 130 54.6% Owner occupied108 45.4% Renter occupied
Language usage in Mequon
English speakers - Total 91.7% of residents of Mequon speak English at home.
1.9% of residents speak Spanish at home 428 94.9% Speak English very well23 5.1% Speak English less than very well6.4% of residents speak other language at home 1,195 79.4% Speak English very well310 20.6% Speak English less than very well
English speakers - Born in the United States 96.3% of residents of Mequon speak English at home.
0.7% of residents speak Spanish at home 50 100.0% Speak English very well3.0% of residents speak other language at home 212 100.0% Speak English very well
English speakers - Native, born elsewhere 70.4% of residents of Mequon speak English at home.
19.2% of residents speak Spanish at home 42 76.4% Speak English very well13 23.6% Speak English less than very well8.0% of residents speak other language at home 8 34.8% Speak English very well15 65.2% Speak English less than very well
English speakers - Foreign-born 30.4% of residents of Mequon speak English at home.
9.8% of residents speak Spanish at home 185 96.4% Speak English very well7 3.6% Speak English less than very well56.5% of residents speak other language at home 840 75.7% Speak English very well270 24.3% Speak English less than very well
White (Caucasian) - Speak only English Native:
97.9% (19,433)Foreign-born:
36.5% (334)
White (Caucasian) - Speak another language Native:
1.5% (308)Foreign-born:
63.2% (579)
Black or African American - Speak only English Native:
100.0% (466)Foreign-born:
71.8% (14)
Asian - Speak only English Native:
80.1% (223)Foreign-born:
23.2% (94)
Asian - Speak another language Native:
10.3% (29)Foreign-born:
78.0% (317)
Other race - Speak only English Native:
99.7% (74)Foreign-born:
88.1% (75)
Other race - Speak another language Native:
17.9% (13)Foreign-born:
21.6% (18)
Two or more races - Speak only English Native:
89.9% (1,074)Foreign-born:
5.4% (9)
Two or more races - Speak another language Native:
3.8% (45)Foreign-born:
95.9% (163)
White alone - Speak only English Native:
98.3% (19,271)Foreign-born:
35.7% (334)
White alone - Speak another language Native:
1.3% (262)Foreign-born:
64.3% (602)
Hispanic or Latino - Speak only English Native:
75.1% (430)Foreign-born:
23.7% (73)
Hispanic or Latino - Speak another language Native:
26.2% (150)Foreign-born:
73.8% (228)
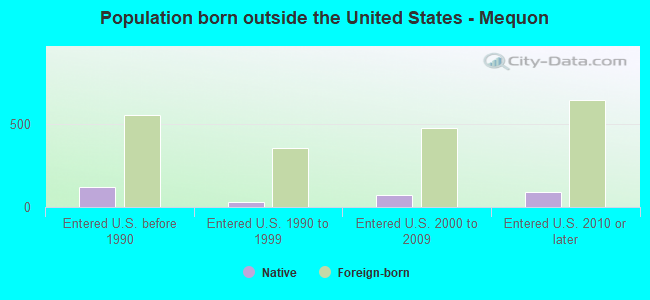
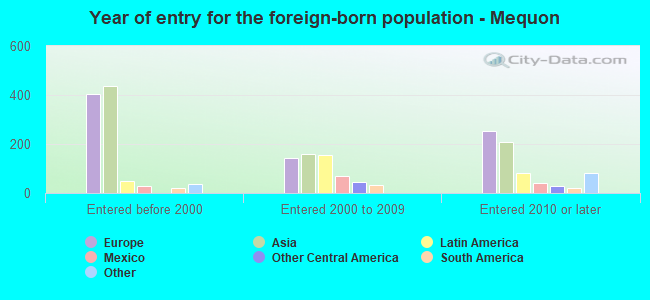
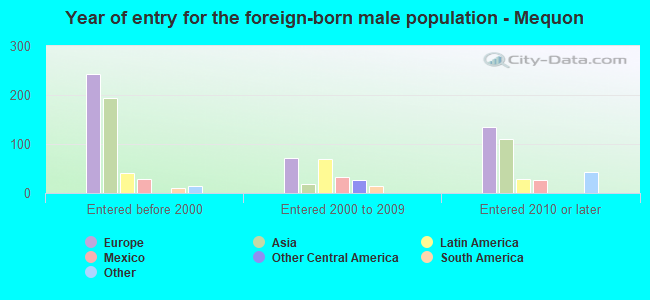
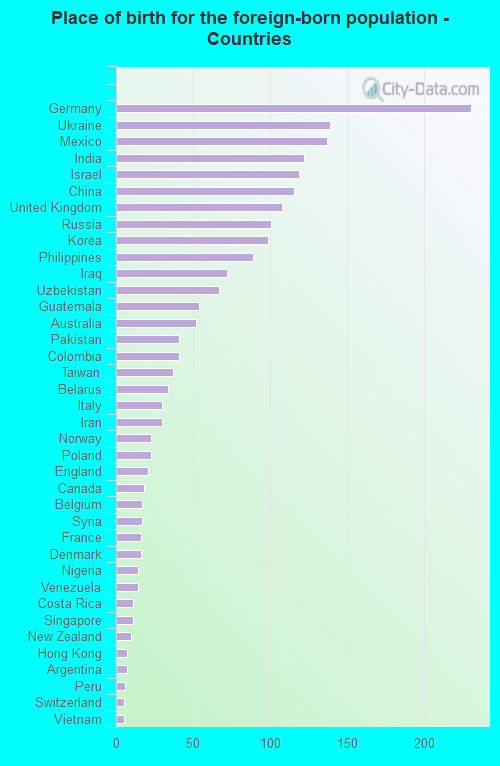
Foreign-born residents in Mequon 2,051 residents are foreign born (3.4% Asia , 3.3% Europe , 1.1% Latin America ).
This city:
8.1%Wisconsin:
5.0%
Marital status for residents in Mequon Marital status - White (Caucasian) population 15 years and over
Males 25.9% Never married66.5% Now married0.5% Separated1.4% Widowed5.6% DivorcedFemales 24.0% Never married58.3% Now married1.3% Separated8.9% Widowed7.5% DivorcedWomen who gave birth in the past 12 months Now married:
95.1% (358)Unmarried:
4.9% (19)
Women who did not give birth in the past 12 months Now married:
45.0% (1,842)Unmarried:
55.0% (2,253)
Marital status - Black or African American population 15 years and over
Males 19.4% Never married61.8% Now married0.0% Separated12.6% Widowed6.3% DivorcedFemales 21.0% Never married43.7% Now married2.7% Separated20.3% Widowed12.2% DivorcedWomen who did not give birth in the past 12 months Now married:
12.7% (9)Unmarried:
87.3% (60)
Marital status - American Indian / Alaska Native population 15 years and over
Males 0.0% Never married100.0% Now married0.0% Separated0.0% Widowed0.0% DivorcedFemales 31.2% Never married68.8% Now married0.0% Separated0.0% Widowed0.0% DivorcedWomen who did not give birth in the past 12 months Now married:
68.8% (10)Unmarried:
31.2% (5)
Marital status - Asian population 15 years and over
Males 20.1% Never married76.9% Now married0.0% Separated0.0% Widowed3.0% DivorcedFemales 25.6% Never married60.4% Now married0.0% Separated11.9% Widowed2.1% DivorcedWomen who did not give birth in the past 12 months Now married:
60.0% (124)Unmarried:
40.0% (83)
Marital status - Other race population 15 years and over
Males 81.6% Never married18.4% Now married0.0% Separated0.0% Widowed0.0% DivorcedFemales 44.2% Never married55.8% Now married0.0% Separated0.0% Widowed0.0% DivorcedWomen who gave birth in the past 12 months Now married:
100.0% (14)Unmarried:
0.0% (0)
Women who did not give birth in the past 12 months Now married:
25.8% (7)Unmarried:
74.2% (21)
Marital status - Two or more races population 15 years and over
Males 32.1% Never married57.5% Now married0.0% Separated0.0% Widowed10.4% DivorcedFemales 41.5% Never married51.2% Now married0.0% Separated4.0% Widowed3.3% DivorcedWomen who did not give birth in the past 12 months Now married:
41.0% (139)Unmarried:
59.0% (200)
Marital status - White alone, not Hispanic / Latino population 15 years and over
Males 25.8% Never married66.5% Now married0.5% Separated1.5% Widowed5.7% DivorcedFemales 23.9% Never married58.1% Now married1.3% Separated9.0% Widowed7.6% DivorcedWomen who gave birth in the past 12 months Now married:
95.1% (361)Unmarried:
4.9% (19)
Women who did not give birth in the past 12 months Now married:
44.3% (1,767)Unmarried:
55.7% (2,226)
Marital status - Hispanic or Latino population 15 years and over
Males 31.2% Never married68.8% Now married0.0% Separated0.0% Widowed0.0% DivorcedFemales 30.1% Never married67.4% Now married0.0% Separated2.5% Widowed0.0% DivorcedWomen who gave birth in the past 12 months Now married:
100.0% (16)Unmarried:
0.0% (0)
Women who did not give birth in the past 12 months Now married:
64.6% (159)Unmarried:
35.4% (87)
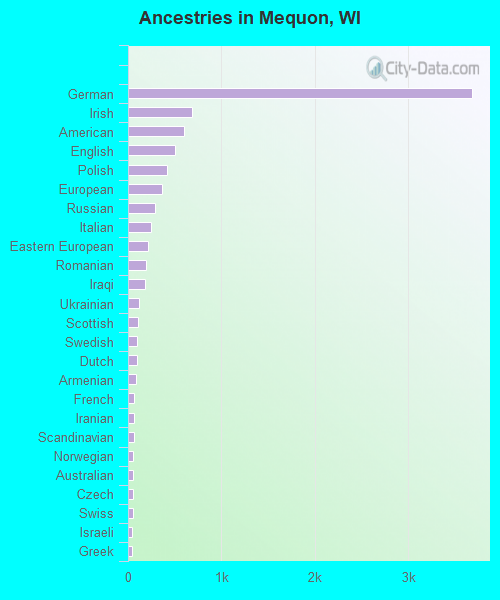
Ancestries in Mequon
3,680 32.5% German690 6.1% Irish603 5.3% American499 4.4% English422 3.7% Polish368 3.3% European285 2.5% Russian244 2.2% Italian213 1.9% Eastern European197 1.7% Romanian180 1.6% Iraqi118 1.0% Ukrainian104 0.9% Scottish100 0.9% Swedish98 0.9% Dutch84 0.7% Armenian67 0.6% French65 0.6% Iranian62 0.5% Scandinavian55 0.5% Norwegian55 0.5% Australian55 0.5% Czech54 0.5% Swiss46 0.4% Israeli43 0.4% Greek42 0.4% Belgian38 0.3% British37 0.3% Croatian35 0.3% French Canadian35 0.3% Slovene29 0.3% Latvian27 0.2% Scotch-Irish25 0.2% Austrian18 0.2% Finnish17 0.2% Syrian16 0.1% Luxembourger14 0.1% Lithuanian12 0.1% Soviet Union11 0.10% Canadian11 0.10% Welsh10 0.09% Nigerian9 0.08% Northern European
Geographical mobility in Mequon Same house 1 year ago 19,002 86.3% White (Caucasian)504 99.0% Black or African American24 100.0% American Indian / Alaska Native793 87.6% Asian14 100.0% Native Hawaiian / Pacific Islander163 86.1% Other race1,344 88.5% Two or more races18,738 86.5% White alone, not Hispanic / Latino816 83.3% Hispanic or LatinoMoved within same county 541 2.5% White / Caucasian3 0.2% Two or more races537 2.5% White alone, not Hispanic / Latino11 1.1% Hispanic or LatinoMoved within same state 1,248 5.7% White / Caucasian80 8.8% Asian21 11.1% Other race63 4.1% Two or more races1,147 5.3% White alone, not Hispanic / Latino126 12.9% Hispanic or LatinoMoved from different state 1,278 5.8% White / Caucasian1 0.2% Black or African American13 1.4% Asian126 8.3% Two or more races1,291 6.0% White alone, not Hispanic / Latino23 2.3% Hispanic or LatinoMoved from abroad 104 0.5% White33 3.6% Asian104 0.5% White alone, not Hispanic / Latino
Children Nativity (place of birth) in Mequon
Children under 6 years - Living with two parents Both parents native 1,180 100.0% NativeBoth parents foreign-born 119 79.9% Native30 20.1% Foreign-bornOne native, one foreign-born parent 145 100.0% NativeChildren under 6 years - Living with one parent Native parent 101 100.0% NativeForeign-born parent 31 100.0% NativeChildren 6 to 17 years - Living with two parents Both parents native 2,232 95.5% Native105 4.5% Foreign-bornBoth parents foreign-born 255 62.3% Native154 37.7% Foreign-bornOne native, one foreign-born parent 129 90.3% Native14 9.7% Foreign-bornChildren 6 to 17 years - Living with one parent Native parent 493 100.0% NativeForeign-born parent 88 49.8% Native88 50.2% Foreign-born
Grandparents responsible for own grandchildren in Mequon
Grandparents (30 to 59 years) White / Caucasian 19 100.0% Not responsible for grandchildrenTwo or more races 13 100.0% Not responsible for grandchildrenWhite alone, not Hispanic / Latino 20 100.0% Not responsible for grandchildrenHispanic or Latino 7 100.0% Not responsible for grandchildrenGrandparents (60 years and over) White / Caucasian 59 54.5% Responsible for grandchildren49 45.5% Not responsible for grandchildrenTwo or more races 9 100.0% Responsible for grandchildrenWhite alone, not Hispanic / Latino 60 53.8% Responsible for grandchildren51 46.2% Not responsible for grandchildrenHispanic or Latino 6 100.0% Responsible for grandchildren