Races in Miami Shores, Florida (FL) Detailed Stats
Data:
Races - White alone (%)
Races - White alone (% change since 2000)
Races - Black alone (%)
Races - Black alone (% change since 2000)
Races - American Indian alone (%)
Races - American Indian alone (% change since 2000)
Races - Asian alone (%)
Races - Asian alone (% change since 2000)
Races - Hispanic (%)
Races - Hispanic (% change since 2000)
Races - Native Hawaiian and Other Pacific Islander alone (%)
Races - Native Hawaiian and Other Pacific Islander alone (% change since 2000)
Races - Two or more races(%)
Races - Two or more races(% change since 2000)
Races - Other race alone (%)
Races - Other race alone (% change since 2000)
Racial diversity
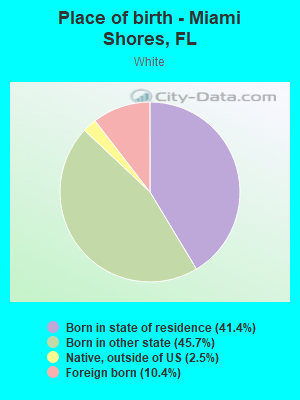
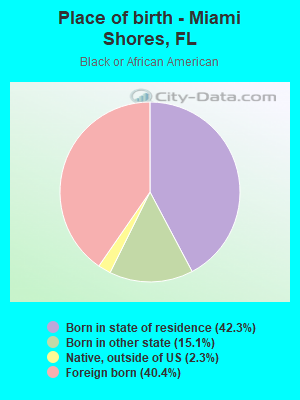
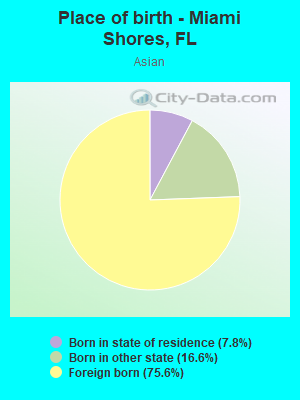
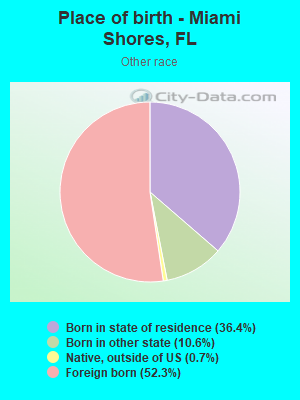
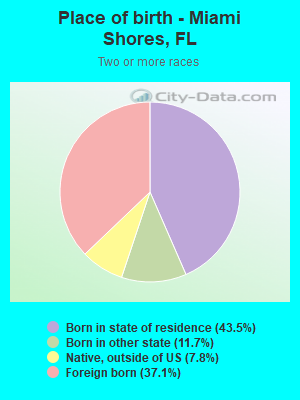
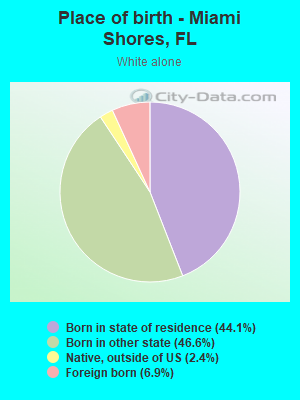
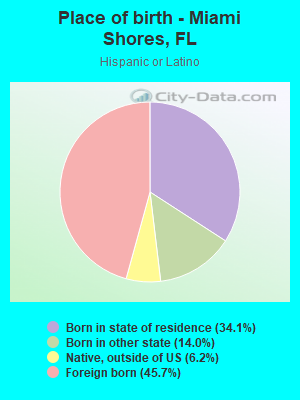
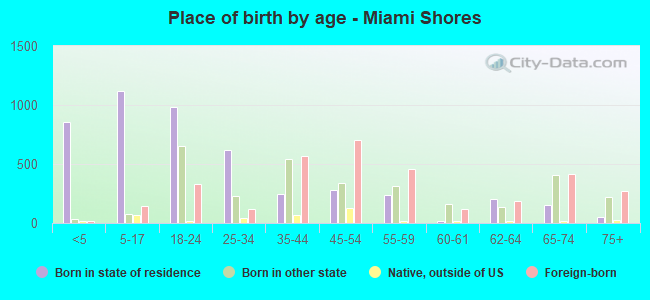
Place of birth - Born in state of residence (%)
Place of birth - Born in state of residence (%) - White
Place of birth - Born in state of residence (%) - Black or African American
Place of birth - Born in state of residence (%) - Asian
Place of birth - Born in state of residence (%) - Hispanic or Latino
Place of birth - Born in state of residence (%) - American Indian and Alaska Native
Place of birth - Born in state of residence (%) - Multirace
Place of birth - Born in state of residence (%) - Other Race
Place of birth - Born in other state (%)
Place of birth - Born in other state (%) - White
Place of birth - Born in other state (%) - Black or African American
Place of birth - Born in other state (%) - Asian
Place of birth - Born in other state (%) - Hispanic or Latino
Place of birth - Born in other state (%) - American Indian and Alaska Native
Place of birth - Born in other state (%) - Multirace
Place of birth - Born in other state (%) - Other Race
Place of birth - Native, outside of US (%)
Place of birth - Native, outside of US (%) - White
Place of birth - Native, outside of US (%) - Black or African American
Place of birth - Native, outside of US (%) - Asian
Place of birth - Native, outside of US (%) - Hispanic or Latino
Place of birth - Native, outside of US (%) - American Indian and Alaska Native
Place of birth - Native, outside of US (%) - Multirace
Place of birth - Native, outside of US (%) - Other Race
Place of birth - Foreign born (%)
Place of birth - Foreign born (%) - White
Place of birth - Foreign born (%) - Black or African American
Place of birth - Foreign born (%) - Asian
Place of birth - Foreign born (%) - Hispanic or Latino
Place of birth - Foreign born (%) - American Indian and Alaska Native
Place of birth - Foreign born (%) - Multirace
Place of birth - Foreign born (%) - Other Race
Residents speaking English at home (%)
Residents speaking English at home - Born in the United States (%)
Residents speaking English at home - Native, born elsewhere (%)
Residents speaking English at home - Foreign born (%)
Residents speaking Spanish at home (%)
Residents speaking Spanish at home - Born in the United States (%)
Residents speaking Spanish at home - Native, born elsewhere (%)
Residents speaking Spanish at home - Foreign born (%)
Residents speaking other language at home (%)
Residents speaking other language at home - Born in the United States (%)
Residents speaking other language at home - Native, born elsewhere (%)
Residents speaking other language at home - Foreign born (%)
Marital status - Never married (%)
Marital status - Now married (%)
Marital status - Separated (%)
Marital status - Widowed (%)
Marital status - Divorced (%)
Ancestries Reported - Arab (%)
Ancestries Reported - Czech (%)
Ancestries Reported - Danish (%)
Ancestries Reported - Dutch (%)
Ancestries Reported - English (%)
Ancestries Reported - French (%)
Ancestries Reported - French Canadian (%)
Ancestries Reported - German (%)
Ancestries Reported - Greek (%)
Ancestries Reported - Hungarian (%)
Ancestries Reported - Irish (%)
Ancestries Reported - Italian (%)
Ancestries Reported - Lithuanian (%)
Ancestries Reported - Norwegian (%)
Ancestries Reported - Polish (%)
Ancestries Reported - Portuguese (%)
Ancestries Reported - Russian (%)
Ancestries Reported - Scotch-Irish (%)
Ancestries Reported - Scottish (%)
Ancestries Reported - Slovak (%)
Ancestries Reported - Subsaharan African (%)
Ancestries Reported - Swedish (%)
Ancestries Reported - Swiss (%)
Ancestries Reported - Ukrainian (%)
Ancestries Reported - United States (%)
Ancestries Reported - Welsh (%)
Ancestries Reported - West Indian (%)
Ancestries Reported - Other (%)
Geographical mobility - Same house 1 year ago (%)
Geographical mobility - Same house 1 year ago (%) - White
Geographical mobility - Same house 1 year ago (%) - Black or African American
Geographical mobility - Same house 1 year ago (%) - Asian
Geographical mobility - Same house 1 year ago (%) - Hispanic or Latino
Geographical mobility - Same house 1 year ago (%) - American Indian and Alaska Native
Geographical mobility - Same house 1 year ago (%) - Multirace
Geographical mobility - Same house 1 year ago (%) - Other Race
Geographical mobility - Moved within same county (%)
Geographical mobility - Moved within same county (%) - White
Geographical mobility - Moved within same county (%) - Black or African American
Geographical mobility - Moved within same county (%) - Asian
Geographical mobility - Moved within same county (%) - Hispanic or Latino
Geographical mobility - Moved within same county (%) - American Indian and Alaska Native
Geographical mobility - Moved within same county (%) - Multirace
Geographical mobility - Moved within same county (%) - Other Race
Geographical mobility - Moved from different county within same state (%)
Geographical mobility - Moved from different county within same state (%) - White
Geographical mobility - Moved from different county within same state (%) - Black or African American
Geographical mobility - Moved from different county within same state (%) - Asian
Geographical mobility - Moved from different county within same state (%) - Hispanic or Latino
Geographical mobility - Moved from different county within same state (%) - American Indian and Alaska Native
Geographical mobility - Moved from different county within same state (%) - Multirace
Geographical mobility - Moved from different county within same state (%) - Other Race
Geographical mobility - Moved from different state (%)
Geographical mobility - Moved from different state (%) - White
Geographical mobility - Moved from different state (%) - Black or African American
Geographical mobility - Moved from different state (%) - Asian
Geographical mobility - Moved from different state (%) - Hispanic or Latino
Geographical mobility - Moved from different state (%) - American Indian and Alaska Native
Geographical mobility - Moved from different state (%) - Multirace
Geographical mobility - Moved from different state (%) - Other Race
Geographical mobility - Moved from abroad (%)
Geographical mobility - Moved from abroad (%) - White
Geographical mobility - Moved from abroad (%) - Black or African American
Geographical mobility - Moved from abroad (%) - Asian
Geographical mobility - Moved from abroad (%) - Hispanic or Latino
Geographical mobility - Moved from abroad (%) - American Indian and Alaska Native
Geographical mobility - Moved from abroad (%) - Multirace
Geographical mobility - Moved from abroad (%) - Other Race
Place of birth for the foreign-born population - Ireland (%)
Place of birth for the foreign-born population - Denmark (%)
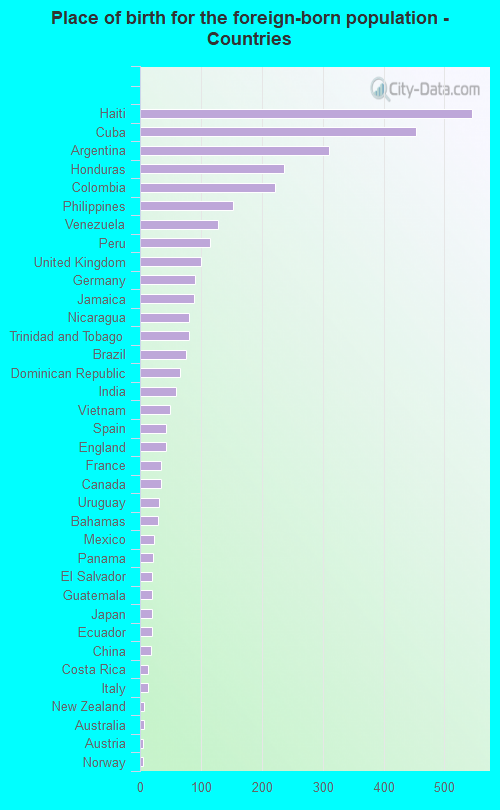
Place of birth for the foreign-born population - Norway (%)
Place of birth for the foreign-born population - Sweden (%)
Place of birth for the foreign-born population - United Kingdom (%)
Place of birth for the foreign-born population - England (%)
Place of birth for the foreign-born population - Scotland (%)
Place of birth for the foreign-born population - Other Northern Europe (%)
Place of birth for the foreign-born population - Austria (%)
Place of birth for the foreign-born population - Belgium (%)
Place of birth for the foreign-born population - France (%)
Place of birth for the foreign-born population - Germany (%)
Place of birth for the foreign-born population - Netherlands (%)
Place of birth for the foreign-born population - Switzerland (%)
Place of birth for the foreign-born population - Other Western Europe (%)
Place of birth for the foreign-born population - Greece (%)
Place of birth for the foreign-born population - Italy (%)
Place of birth for the foreign-born population - Portugal (%)
Place of birth for the foreign-born population - Spain (%)
Place of birth for the foreign-born population - Other Southern Europe (%)
Place of birth for the foreign-born population - Albania (%)
Place of birth for the foreign-born population - Belarus (%)
Place of birth for the foreign-born population - Bosnia and Herzegovina (%)
Place of birth for the foreign-born population - Bulgaria (%)
Place of birth for the foreign-born population - Croatia (%)
Place of birth for the foreign-born population - Czechoslovakia (%)
Place of birth for the foreign-born population - Hungary (%)
Place of birth for the foreign-born population - Latvia (%)
Place of birth for the foreign-born population - Lithuania (%)
Place of birth for the foreign-born population - North Macedonia (Macedonia) (%)
Place of birth for the foreign-born population - Moldova (%)
Place of birth for the foreign-born population - Poland (%)
Place of birth for the foreign-born population - Romania (%)
Place of birth for the foreign-born population - Russia (%)
Place of birth for the foreign-born population - Serbia (%)
Place of birth for the foreign-born population - Ukraine (%)
Place of birth for the foreign-born population - Other Eastern Europe (%)
Place of birth for the foreign-born population - China (%)
Place of birth for the foreign-born population - Hong Kong (%)
Place of birth for the foreign-born population - Taiwan (%)
Place of birth for the foreign-born population - Japan (%)
Place of birth for the foreign-born population - Korea (%)
Place of birth for the foreign-born population - Other Eastern Asia (%)
Place of birth for the foreign-born population - Afghanistan (%)
Place of birth for the foreign-born population - Bangladesh (%)
Place of birth for the foreign-born population - India (%)
Place of birth for the foreign-born population - Iran (%)
Place of birth for the foreign-born population - Kazakhstan (%)
Place of birth for the foreign-born population - Nepal (%)
Place of birth for the foreign-born population - Pakistan (%)
Place of birth for the foreign-born population - Sri Lanka (%)
Place of birth for the foreign-born population - Uzbekistan (%)
Place of birth for the foreign-born population - Other South Central Asia (%)
Place of birth for the foreign-born population - Burma (%)
Place of birth for the foreign-born population - Cambodia (%)
Place of birth for the foreign-born population - Indonesia (%)
Place of birth for the foreign-born population - Laos (%)
Place of birth for the foreign-born population - Malaysia (%)
Place of birth for the foreign-born population - Philippines (%)
Place of birth for the foreign-born population - Singapore (%)
Place of birth for the foreign-born population - Thailand (%)
Place of birth for the foreign-born population - Vietnam (%)
Place of birth for the foreign-born population - Other South Eastern Asia (%)
Place of birth for the foreign-born population - Armenia (%)
Place of birth for the foreign-born population - Iraq (%)
Place of birth for the foreign-born population - Israel (%)
Place of birth for the foreign-born population - Jordan (%)
Place of birth for the foreign-born population - Kuwait (%)
Place of birth for the foreign-born population - Lebanon (%)
Place of birth for the foreign-born population - Saudi Arabia (%)
Place of birth for the foreign-born population - Syria (%)
Place of birth for the foreign-born population - Turkey (%)
Place of birth for the foreign-born population - Yemen (%)
Place of birth for the foreign-born population - Other Western Asia (%)
Place of birth for the foreign-born population - Eritrea (%)
Place of birth for the foreign-born population - Ethiopia (%)
Place of birth for the foreign-born population - Kenya (%)
Place of birth for the foreign-born population - Somalia (%)
Place of birth for the foreign-born population - Uganda (%)
Place of birth for the foreign-born population - Zimbabwe (%)
Place of birth for the foreign-born population - Other Eastern Africa (%)
Place of birth for the foreign-born population - Cameroon (%)
Place of birth for the foreign-born population - Congo (%)
Place of birth for the foreign-born population - Democratic Republic of Congo (Zaire) (%)
Place of birth for the foreign-born population - Other Middle Africa (%)
Place of birth for the foreign-born population - Egypt (%)
Place of birth for the foreign-born population - Morocco (%)
Place of birth for the foreign-born population - Sudan (%)
Place of birth for the foreign-born population - Other Northern Africa (%)
Place of birth for the foreign-born population - South Africa (%)
Place of birth for the foreign-born population - Other Southern Africa (%)
Place of birth for the foreign-born population - Cabo Verde (%)
Place of birth for the foreign-born population - Ghana (%)
Place of birth for the foreign-born population - Liberia (%)
Place of birth for the foreign-born population - Nigeria (%)
Place of birth for the foreign-born population - Senegal (%)
Place of birth for the foreign-born population - Sierra Leone (%)
Place of birth for the foreign-born population - Other Western Africa (%)
Place of birth for the foreign-born population - Australia (%)
Place of birth for the foreign-born population - New Zealand (%)
Place of birth for the foreign-born population - Fiji (%)
Place of birth for the foreign-born population - Micronesia (%)
Place of birth for the foreign-born population - Bahamas (%)
Place of birth for the foreign-born population - Barbados (%)
Place of birth for the foreign-born population - Cuba (%)
Place of birth for the foreign-born population - Dominica (%)
Place of birth for the foreign-born population - Dominican Republic (%)
Place of birth for the foreign-born population - Grenada (%)
Place of birth for the foreign-born population - Haiti (%)
Place of birth for the foreign-born population - Jamaica (%)
Place of birth for the foreign-born population - St. Vincent and the Grenadines (%)
Place of birth for the foreign-born population - Trinidad and Tobago (%)
Place of birth for the foreign-born population - West Indies (%)
Place of birth for the foreign-born population - Other Caribbean (%)
Place of birth for the foreign-born population - Belize (%)
Place of birth for the foreign-born population - Costa Rica (%)
Place of birth for the foreign-born population - El Salvador (%)
Place of birth for the foreign-born population - Guatemala (%)
Place of birth for the foreign-born population - Honduras (%)
Place of birth for the foreign-born population - Mexico (%)
Place of birth for the foreign-born population - Nicaragua (%)
Place of birth for the foreign-born population - Panama (%)
Place of birth for the foreign-born population - Other Central America (%)
Place of birth for the foreign-born population - Argentina (%)
Place of birth for the foreign-born population - Bolivia (%)
Place of birth for the foreign-born population - Brazil (%)
Place of birth for the foreign-born population - Chile (%)
Place of birth for the foreign-born population - Colombia (%)
Place of birth for the foreign-born population - Ecuador (%)
Place of birth for the foreign-born population - Guyana (%)
Place of birth for the foreign-born population - Peru (%)
Place of birth for the foreign-born population - Uruguay (%)
Place of birth for the foreign-born population - Venezuela (%)
Place of birth for the foreign-born population - Other South America (%)
Place of birth for the foreign-born population - Canada (%)
Place of birth for the foreign-born population - Other Northern America (%)
Place of birth for the foreign-born population - Other (%)
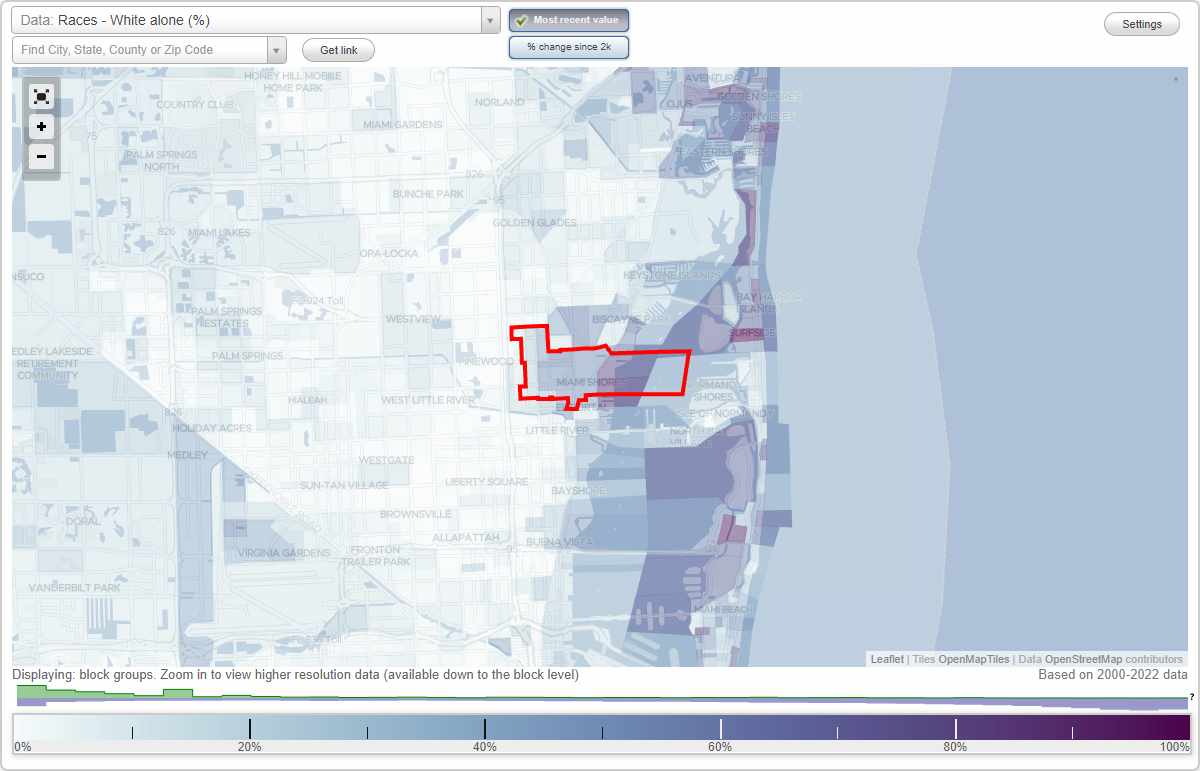
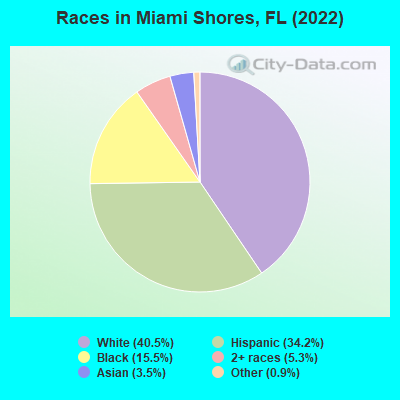
According to 2022 data, the most numerous races in Miami Shores, FL are White alone (4,684 residents), Hispanic (3,963 residents), and Black alone (1,791 residents). 55.4% of Miami Shores residents speak English at home. 28.8% of Miami Shores, FL residents are foreign-born (22.4% born in Latin America, 3.0% born in Europe), which is 27.0% greater than the foreign-born rate of 21.0% across the entire state of Florida.
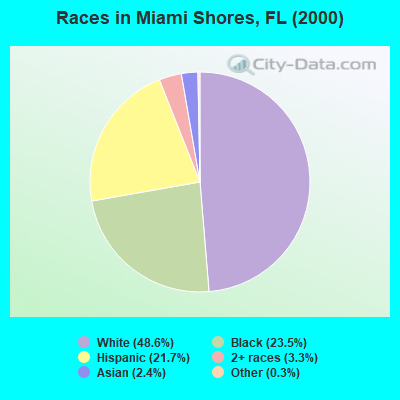
Race distribution in Miami Shores
2000 2022
10,458,509 65.4% White alone 2,682,715 16.8% Hispanic 2,264,268 14.2% Black alone 261,693 1.6% Asian alone 236,954 1.5% Two or more races 42,358 0.3% American Indian alone 28,994 0.2% Other race alone 6,887 0.04% Native Hawaiian and Other
11,309,403 50.8% White alone 6,025,039 27.1% Hispanic 3,241,015 14.6% Black alone 861,630 3.9% Two or more races 623,692 2.8% Asian alone 152,054 0.7% Other race alone 22,504 0.1% American Indian alone 9,486 0.04% Native Hawaiian and Other
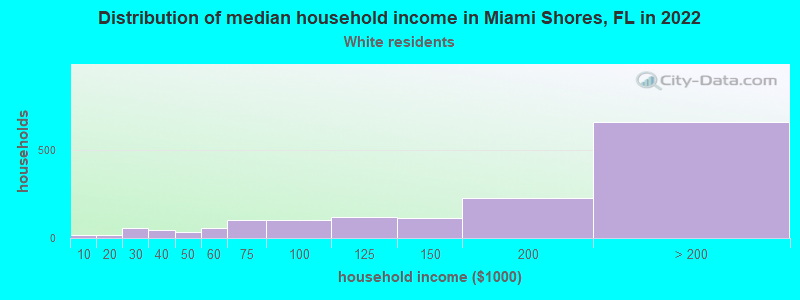
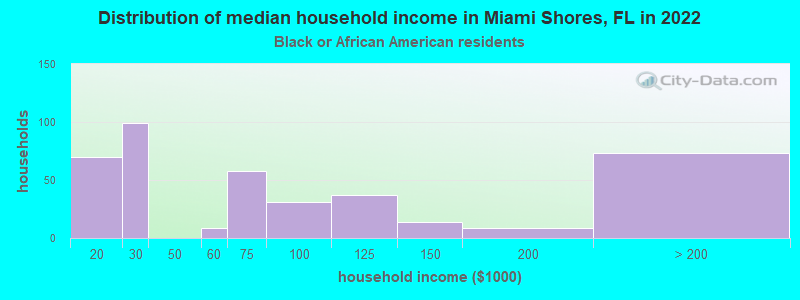
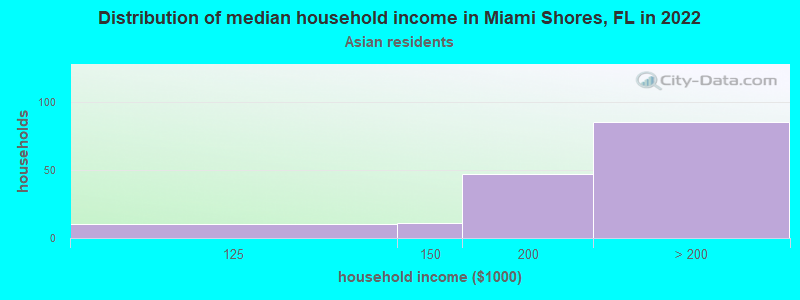
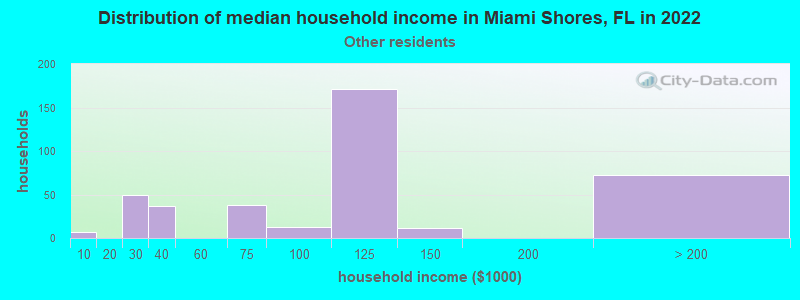
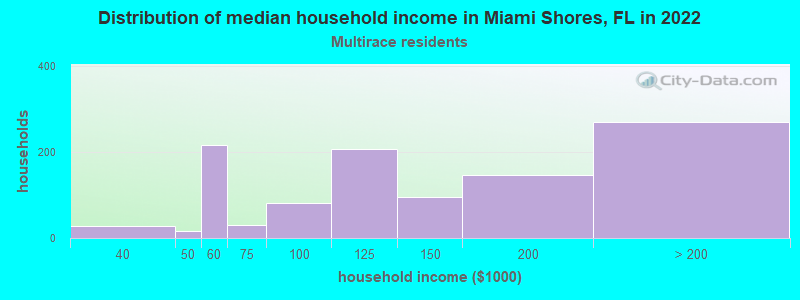
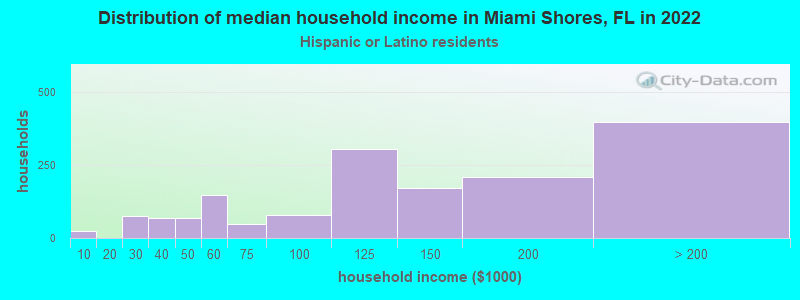
Income and house value in Miami Shores Median household income in 2022 $155,953 White non-Hispanic householders$73,864 Black householdersover $200,000 Asian householders$106,494 Some other race householders$110,688 Two or more races householders$117,894 Hispanic or Latino race householdersMedian 2022 house value $929,990 White Non-Hispanic householders$619,483 Black or African American householders over $1,000,000 Asian householders$640,388 Some other race householders$753,068 Two or more races householders$740,321 Hispanic or Latino householders
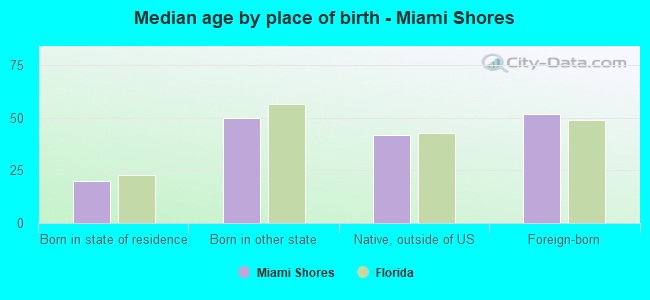
Median age by race in Miami Shores
35.9 Median age for White residents38.0 34.9 31.8 Median age for Black or African American residents45.5 26.1 -653,446,647.1 Median age for American Indian / Alaska Native residents-543,352,600.6 -762,696,213.5 51.2 Median age for Asian residents61.3 47.7 -679,849,340.2 Median age for Native Hawaiian / Pacific Islander residents-858,307,848.3 -443,298,968.6 30.0 Median age for Other race residents41.9 26.3 34.7 Median age for Two or more races residents46.7 26.2 38.4 Median age for White alone residents39.5 37.8 40.2 Median age for Hispanic or Latino residents43.7 37.7
Owner/renter occupied households by race in Miami Shores
House owners and renters - White residents 1,239 88.8% Owner occupied156 11.2% Renter occupiedHouse owners and renters - Black or African American residents 275 73.2% Owner occupied101 26.8% Renter occupiedHouse owners and renters - Asian residents 141 100.0% Owner occupiedHouse owners and renters - Other race residents 254 62.9% Owner occupied150 37.1% Renter occupiedHouse owners and renters - Two or more races residents 918 83.8% Owner occupied177 16.2% Renter occupiedHouse owners and renters - White alone residents 1,451 88.8% Owner occupied182 11.2% Renter occupiedHouse owners and renters - Hispanic or Latino residents 1,295 82.5% Owner occupied275 17.5% Renter occupied
Language usage in Miami Shores
English speakers - Total 55.4% of residents of Miami Shores speak English at home.
32.7% of residents speak Spanish at home 2,890 83.0% Speak English very well594 17.0% Speak English less than very well11.9% of residents speak other language at home 1,055 82.9% Speak English very well217 17.1% Speak English less than very well
English speakers - Born in the United States 81.0% of residents of Miami Shores speak English at home.
14.7% of residents speak Spanish at home 442 97.6% Speak English very well11 2.4% Speak English less than very well4.3% of residents speak other language at home 127 94.8% Speak English very well7 5.2% Speak English less than very well
English speakers - Native, born elsewhere 51.0% of residents of Miami Shores speak English at home.
53.1% of residents speak Spanish at home 179 86.1% Speak English very well29 13.9% Speak English less than very well
English speakers - Foreign-born 17.6% of residents of Miami Shores speak English at home.
53.9% of residents speak Spanish at home 1,277 71.2% Speak English very well517 28.8% Speak English less than very well28.3% of residents speak other language at home 736 78.1% Speak English very well206 21.9% Speak English less than very well
White (Caucasian) - Speak only English Native:
99.8% (3,590)Foreign-born:
27.2% (134)
White (Caucasian) - Speak another language Native:
15.9% (571)Foreign-born:
79.1% (389)
Black or African American - Speak only English Native:
77.7% (827)Foreign-born:
26.0% (185)
Black or African American - Speak another language Native:
22.3% (237)Foreign-born:
73.7% (524)
Asian - Speak only English Native:
35.7% (35)Foreign-born:
16.7% (53)
Asian - Speak another language Native:
63.3% (62)Foreign-born:
83.7% (265)
Other race - Speak only English Native:
37.3% (154)Foreign-born:
16.4% (91)
Other race - Speak another language Native:
62.9% (259)Foreign-born:
83.4% (463)
Two or more races - Speak only English Native:
40.6% (627)Foreign-born:
6.6% (73)
Two or more races - Speak another language Native:
58.8% (909)Foreign-born:
93.7% (1,028)
White alone - Speak only English Native:
90.6% (3,498)Foreign-born:
51.7% (167)
White alone - Speak another language Native:
10.3% (398)Foreign-born:
54.5% (176)
Hispanic or Latino - Speak only English Native:
34.7% (644)Foreign-born:
6.1% (112)
Hispanic or Latino - Speak another language Native:
66.1% (1,227)Foreign-born:
94.0% (1,707)
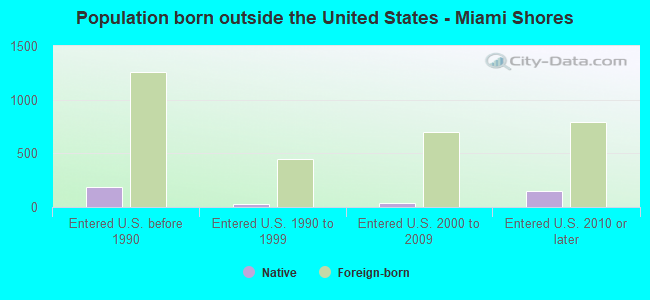
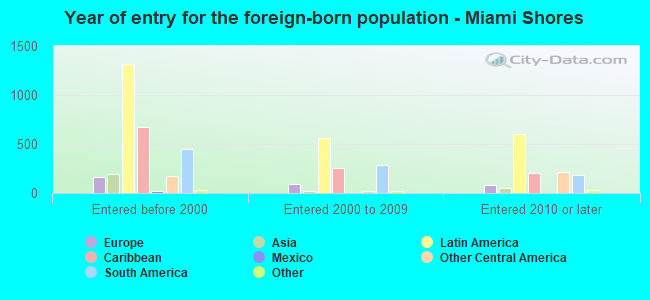
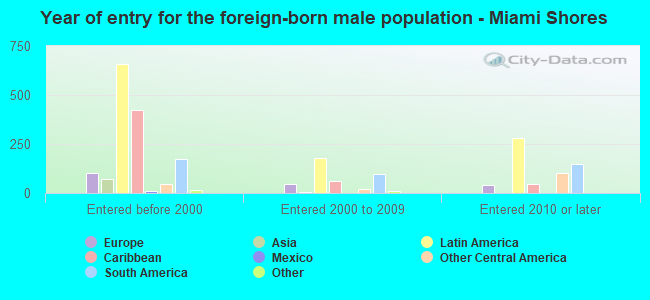
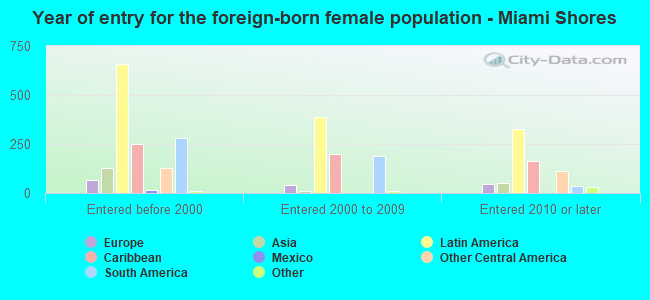
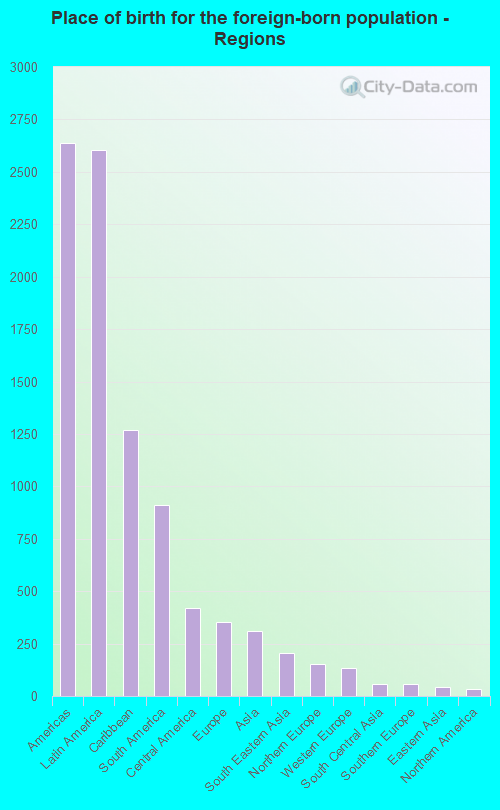
Foreign-born residents in Miami Shores 3,332 residents are foreign born (22.4% Latin America , 3.0% Europe ).
This city:
28.8%Florida:
21.1%
Marital status for residents in Miami Shores Marital status - White (Caucasian) population 15 years and over
Males 35.0% Never married56.8% Now married0.0% Separated0.4% Widowed7.8% DivorcedFemales 41.9% Never married44.6% Now married0.3% Separated3.2% Widowed9.9% DivorcedWomen who gave birth in the past 12 months Now married:
92.5% (40)Unmarried:
7.5% (3)
Women who did not give birth in the past 12 months Now married:
28.7% (241)Unmarried:
71.3% (600)
Marital status - Black or African American population 15 years and over
Males 35.2% Never married57.6% Now married0.0% Separated0.0% Widowed7.1% DivorcedFemales 74.8% Never married21.1% Now married0.0% Separated0.7% Widowed3.4% DivorcedWomen who gave birth in the past 12 months Now married:
100.0% (20)Unmarried:
0.0% (0)
Women who did not give birth in the past 12 months Now married:
13.3% (97)Unmarried:
86.7% (638)
Marital status - Asian population 15 years and over
Males 26.0% Never married70.7% Now married0.0% Separated3.3% Widowed0.0% DivorcedFemales 36.4% Never married63.6% Now married0.0% Separated0.0% Widowed0.0% DivorcedWomen who did not give birth in the past 12 months Now married:
42.1% (70)Unmarried:
57.9% (96)
Marital status - Other race population 15 years and over
Males 62.9% Never married37.1% Now married0.0% Separated0.0% Widowed0.0% DivorcedFemales 63.5% Never married21.9% Now married9.6% Separated0.0% Widowed5.1% DivorcedWomen who gave birth in the past 12 months Now married:
100.0% (38)Unmarried:
0.0% (0)
Women who did not give birth in the past 12 months Now married:
27.5% (116)Unmarried:
72.5% (305)
Marital status - Two or more races population 15 years and over
Males 41.4% Never married52.5% Now married2.5% Separated2.8% Widowed0.9% DivorcedFemales 34.2% Never married41.7% Now married7.3% Separated10.0% Widowed6.7% DivorcedWomen who gave birth in the past 12 months Now married:
100.0% (35)Unmarried:
0.0% (0)
Women who did not give birth in the past 12 months Now married:
50.5% (350)Unmarried:
49.5% (344)
Marital status - White alone, not Hispanic / Latino population 15 years and over
Males 32.4% Never married60.5% Now married0.0% Separated0.5% Widowed6.6% DivorcedFemales 40.3% Never married47.7% Now married0.5% Separated3.5% Widowed8.1% DivorcedWomen who gave birth in the past 12 months Now married:
100.0% (52)Unmarried:
0.0% (0)
Women who did not give birth in the past 12 months Now married:
25.3% (255)Unmarried:
74.7% (755)
Marital status - Hispanic or Latino population 15 years and over
Males 45.3% Never married46.9% Now married1.0% Separated1.1% Widowed5.6% DivorcedFemales 43.0% Never married38.9% Now married2.2% Separated5.4% Widowed10.5% DivorcedWomen who gave birth in the past 12 months Now married:
92.0% (67)Unmarried:
8.0% (6)
Women who did not give birth in the past 12 months Now married:
39.4% (404)Unmarried:
60.6% (620)
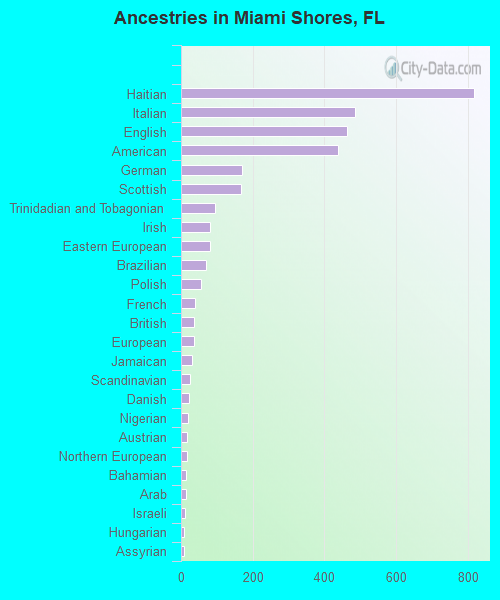
Ancestries in Miami Shores
818 13.5% Haitian484 8.0% Italian464 7.7% English439 7.2% American171 2.8% German166 2.7% Scottish96 1.6% Trinidadian and Tobagonian82 1.4% Irish80 1.3% Eastern European69 1.1% Brazilian56 0.9% Polish38 0.6% French35 0.6% British35 0.6% European31 0.5% Jamaican24 0.4% Scandinavian22 0.4% Danish19 0.3% Nigerian16 0.3% Austrian16 0.3% Northern European15 0.2% Bahamian13 0.2% Arab12 0.2% Israeli9 0.1% Hungarian8 0.1% Assyrian7 0.1% Norwegian6 0.10% Dutch6 0.10% Russian6 0.10% West Indian5 0.08% Lithuanian5 0.08% Slovak5 0.08% Ukrainian4 0.07% Scotch-Irish3 0.05% Canadian
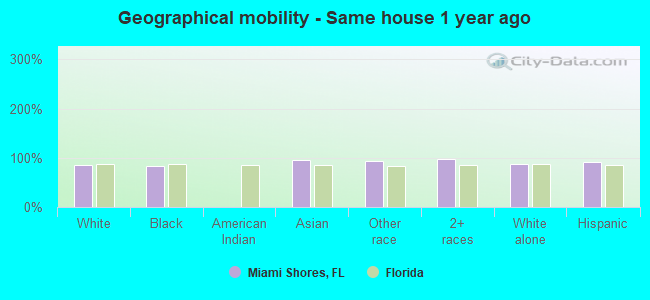
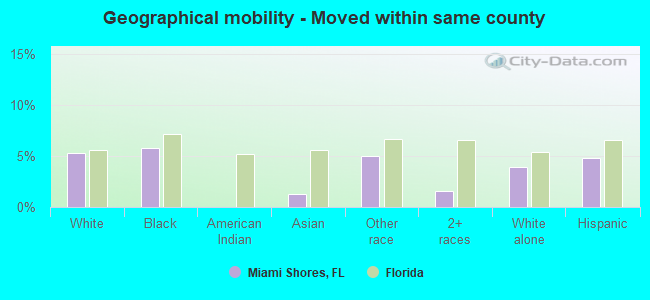
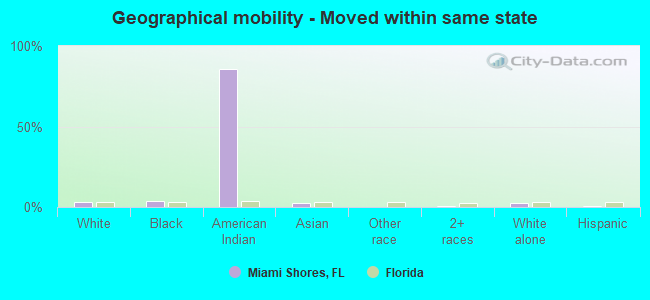
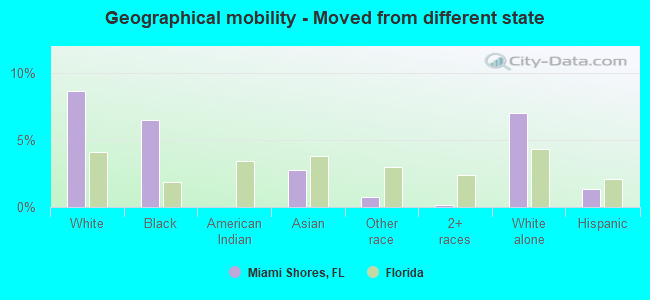
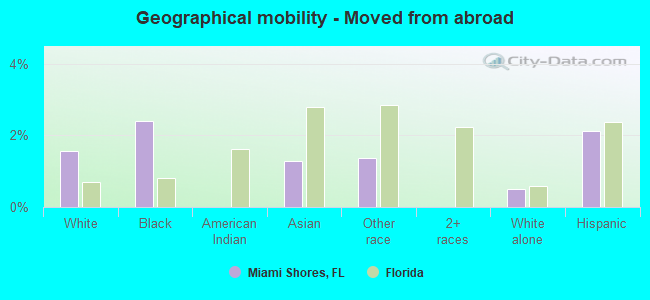
Geographical mobility in Miami Shores Same house 1 year ago 3,156 84.9% White (Caucasian)1,474 82.9% Black or African American401 96.1% Asian955 93.0% Other race2,899 97.8% Two or more races3,951 86.6% White alone, not Hispanic / Latino3,542 90.9% Hispanic or LatinoMoved within same county 198 5.3% White / Caucasian103 5.8% Black or African American5 1.3% Asian51 5.0% Other race47 1.6% Two or more races180 3.9% White alone, not Hispanic / Latino188 4.8% Hispanic or LatinoMoved within same state 109 2.9% White / Caucasian66 3.7% Black or African American17 86.0% American Indian / Alaska Native11 2.6% Asian10 0.3% Two or more races105 2.3% White alone, not Hispanic / Latino36 0.9% Hispanic or LatinoMoved from different state 322 8.7% White / Caucasian115 6.5% Black or African American12 2.8% Asian8 0.7% Other race4 0.1% Two or more races321 7.0% White alone, not Hispanic / Latino53 1.4% Hispanic or LatinoMoved from abroad 58 1.6% White43 2.4% Black or African American5 1.3% Asian14 1.4% Other race23 0.5% White alone, not Hispanic / Latino83 2.1% Hispanic or Latino
Children Nativity (place of birth) in Miami Shores
Children under 6 years - Living with two parents Both parents native 574 100.0% NativeBoth parents foreign-born 170 100.0% NativeOne native, one foreign-born parent 236 100.0% NativeChildren under 6 years - Living with one parent Native parent 10 100.0% NativeChildren 6 to 17 years - Living with two parents Both parents native 175 98.8% Native2 1.2% Foreign-bornBoth parents foreign-born 178 67.4% Native86 32.6% Foreign-bornOne native, one foreign-born parent 505 100.0% NativeChildren 6 to 17 years - Living with one parent Foreign-born parent 317 54.2% Native268 45.8% Foreign-born
Grandparents responsible for own grandchildren in Miami Shores
Grandparents (30 to 59 years) White / Caucasian 8 100.0% Not responsible for grandchildrenHispanic or Latino 12 100.0% Not responsible for grandchildren
Grandparents (60 years and over) White / Caucasian 3 100.0% Not responsible for grandchildren