Estimated zip code population in 2022: 29,416 Zip code population in 2010: 27,571 Zip code population in 2000: 29,522
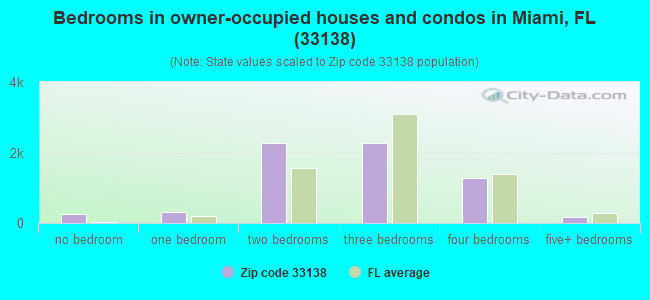
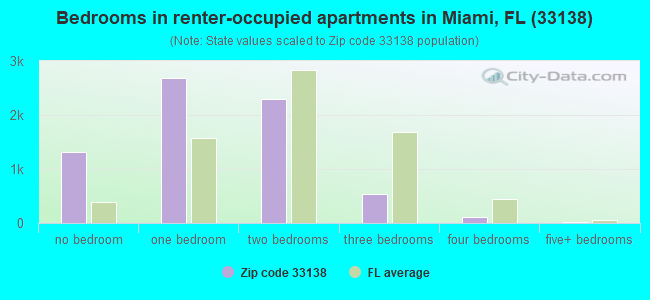
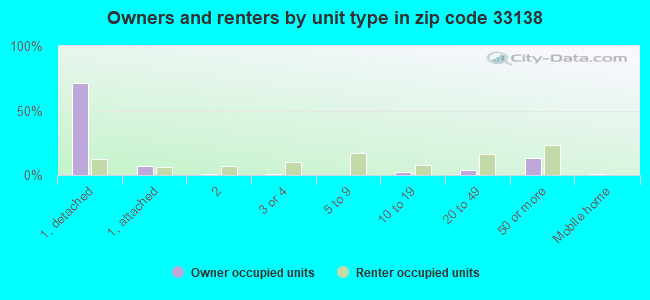
Houses and condos: 14,712 Renter-occupied apartments: 6,811
% of renters here:
51%
State:
33%
March 2022 cost of living index in zip code 33138: 110.7 (more than average, U.S. average is 100)
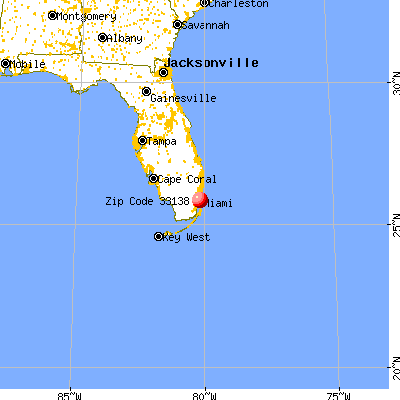
Land area: 4.2 sq. mi. Water area: 2.2 sq. mi.
Population density: 6,976 people per square mile
(high).
OSM Map
General Map
Google Map
MSN Map
OSM Map
General Map
Google Map
MSN Map
OSM Map
General Map
Google Map
MSN Map
OSM Map
General Map
Google Map
MSN Map
Please wait while loading the map...
Real estate property taxes paid for housing units in 2022:
This zip code:
0.7% ($5,388)
Florida:
0.7% ($2,529)
Median real estate property taxes paid for housing units with mortgages in 2022: $6,137 (0.8%) Median real estate property taxes paid for housing units with no mortgage in 2022: $4,259 (0.6%)
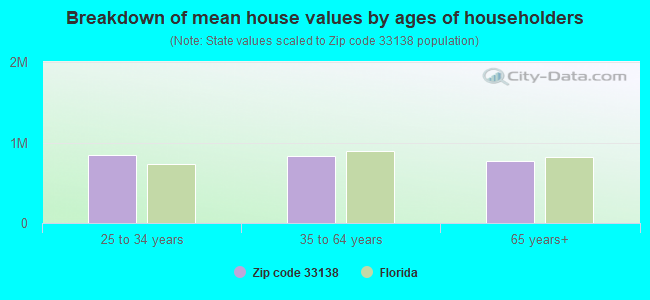
Estimated median house/condo value in 2022: $732,316
33138:
$732,316
Florida:
$354,100
According to our research of Florida and other state lists, there were 56 registered sex offenders living in 33138 zip code as of April 27, 2024. The ratio of all residents to sex offenders in zip code 33138 is 547 to 1. The ratio of registered sex offenders to all residents in this zip code is near the state average.
Median resident age:
This zip code:
41.6 years
Florida median age:
42.7 years
Average household size:
This zip code:
2.2 people
Florida:
2.5 people
Averages for the 2020 tax year for zip code 33138, filed in 2021:
Average Adjusted Gross Income (AGI) in 2020: $92,102 (Individual Income Tax Returns)
Here:
$92,102
State:
$82,200
Salary/wage: $72,671 (reported on 77.7% of returns)
Here:
$72,671
State:
$58,347
(% of AGI for various income ranges: 1218.9% for AGIs below $25k, 3675.9% for AGIs $25k-50k, 7274.7% for AGIs $50k-75k, 10571.1% for AGIs $75k-100k, 19701.4% for AGIs $100k-200k, 96365.1% for AGIs over 200k)
Taxable interest for individuals: $5,068 (reported on 24.0% of returns)
This zip code:
$5,068
Florida:
$4,272
(% of AGI for various income ranges: 14.2% for AGIs below $25k, 45.1% for AGIs $25k-50k, 70.6% for AGIs $50k-75k, 255.1% for AGIs $75k-100k, 263.8% for AGIs $100k-200k, 2888.5% for AGIs over 200k)
Ordinary dividends: $15,272 (reported on 19.9% of returns)
Here:
$15,272
State:
$15,863
(% of AGI for various income ranges: 23.7% for AGIs below $25k, 48.5% for AGIs $25k-50k, 182.0% for AGIs $50k-75k, 303.4% for AGIs $75k-100k, 860.9% for AGIs $100k-200k, 7788.5% for AGIs over 200k)
Net capital gain/loss in AGI: +$48,012 (reported on 21.0% of returns)
Here:
+$48,012
State:
+$62,983
(% of AGI for various income ranges: 10.6% for AGIs below $25k, 47.7% for AGIs $25k-50k, 163.2% for AGIs $50k-75k, 382.1% for AGIs $75k-100k, 1214.9% for AGIs $100k-200k, 32466.9% for AGIs over 200k)
Profit/loss from business: +$8,578 (reported on 33.9% of returns)
Here:
+$8,578
State:
+$9,719
(% of AGI for various income ranges: 227.1% for AGIs below $25k, 80.9% for AGIs $25k-50k, 386.1% for AGIs $50k-75k, 427.7% for AGIs $75k-100k, 962.1% for AGIs $100k-200k, 4154.9% for AGIs over 200k)
Taxable individual retirement arrangement distribution: $23,435 (reported on 5.1% of returns)
33138:
$23,435
Florida:
$24,823
(% of AGI for various income ranges: 17.3% for AGIs below $25k, 48.2% for AGIs $25k-50k, 169.3% for AGIs $50k-75k, 353.6% for AGIs $75k-100k, 629.2% for AGIs $100k-200k, 1661.8% for AGIs over 200k)
Self-employed (Keogh) retirement plans: $31,512 (reported on 0.6% of returns)
33138:
$31,512
Florida:
$29,694
(% of AGI for various income ranges: 50.7% for AGIs $50k-75k, 532.1% for AGIs over 200k)
Total itemized deductions: $37,777 (reported on 13.0% of returns)
Here:
$37,777
State:
$45,393
(% of AGI for various income ranges: 62.9% for AGIs below $25k, 209.3% for AGIs $25k-50k, 568.2% for AGIs $50k-75k, 1227.7% for AGIs $75k-100k, 1739.6% for AGIs $100k-200k, 9131.8% for AGIs over 200k)
Charity contributions: $8,785 (reported on 10.0% of returns)
Here:
$8,785
State:
$20,178
(% of AGI for various income ranges: 2.4% for AGIs below $25k, 26.6% for AGIs $25k-50k, 69.5% for AGIs $50k-75k, 167.5% for AGIs $75k-100k, 239.2% for AGIs $100k-200k, 2099.0% for AGIs over 200k)
Taxes paid: $8,190 (reported on 12.3% of returns)
33138:
$8,190
State:
$6,967
(% of AGI for various income ranges: 10.4% for AGIs below $25k, 48.7% for AGIs $25k-50k, 119.0% for AGIs $50k-75k, 242.6% for AGIs $75k-100k, 446.3% for AGIs $100k-200k, 1707.2% for AGIs over 200k)
Earned income credit: $2,121 (reported on 24.7% of returns)
Here:
$2,121
State:
$2,306
(% of AGI for various income ranges: 136.4% for AGIs below $25k, 70.6% for AGIs $25k-50k)
Percentage of individuals using paid preparers for their 2020 taxes: 90.4%
Here:
90%
State:
92%
(% for various income ranges: 89.4% for AGIs below $25k, 92.7% for AGIs $25k-50k, 89.8% for AGIs $50k-75k, 90.8% for AGIs $75k-100k, 89.0% for AGIs $100k-200k, 91.5% for AGIs over 200k)
Averages for the 2012 tax year for zip code 33138, filed in 2013:
Average Adjusted Gross Income (AGI) in 2012: $60,304 (Individual Income Tax Returns)
Here:
$60,304
State:
$60,316
Salary/wage: $42,567 (reported on 82.9% of returns)
Here:
$42,567
State:
$45,277
(% of AGI for various income ranges: 81.1% for AGIs below $25k, 85.9% for AGIs $25k-50k, 77.7% for AGIs $50k-75k, 75.2% for AGIs $75k-100k, 73.8% for AGIs $100k-200k, 35.1% for AGIs over 200k)
Taxable interest for individuals: $3,942 (reported on 19.9% of returns)
This zip code:
$3,942
Florida:
$3,587
(% of AGI for various income ranges: 0.7% for AGIs below $25k, 1.1% for AGIs $25k-50k, 1.3% for AGIs $50k-75k, 1.0% for AGIs $75k-100k, 1.5% for AGIs $100k-200k, 1.4% for AGIs over 200k)
Ordinary dividends: $15,492 (reported on 14.7% of returns)
Here:
$15,492
State:
$12,831
(% of AGI for various income ranges: 4.4% for AGIs below $25k, 2.9% for AGIs $25k-50k, 2.9% for AGIs $50k-75k, 2.0% for AGIs $75k-100k, 2.4% for AGIs $100k-200k, 4.7% for AGIs over 200k)
Net capital gain/loss in AGI: +$31,711 (reported on 12.0% of returns)
Here:
+$31,711
State:
+$33,493
(% of AGI for various income ranges: 0.6% for AGIs $50k-75k, 1.1% for AGIs $75k-100k, 2.2% for AGIs $100k-200k, 12.6% for AGIs over 200k)
Profit/loss from business: +$13,218 (reported on 21.1% of returns)
Here:
+$13,218
State:
+$10,012
(% of AGI for various income ranges: 9.5% for AGIs below $25k, 2.8% for AGIs $25k-50k, 3.7% for AGIs $50k-75k, 3.6% for AGIs $75k-100k, 4.2% for AGIs $100k-200k, 4.3% for AGIs over 200k)
Taxable individual retirement arrangement distribution: $24,437 (reported on 4.3% of returns)
33138:
$24,437
Florida:
$21,544
(% of AGI for various income ranges: 0.8% for AGIs below $25k, 1.1% for AGIs $25k-50k, 1.9% for AGIs $50k-75k, 2.3% for AGIs $75k-100k, 2.4% for AGIs $100k-200k, 1.8% for AGIs over 200k)
Self-employment retirement plans: $22,400 (reported on 0.5% of returns)
33138:
$22,400
Florida:
$20,611
(% of AGI for various income ranges: 0.1% for AGIs below $25k, 0.2% for AGIs $100k-200k, 0.3% for AGIs over 200k)
Total itemized deductions: $25,783 (16% of AGI, reported on 25.1% of returns)
Here:
$25,783
State:
$25,533
Here:
16.1% of AGI
State:
18.0% of AGI
(% of AGI for various income ranges: 7.4% for AGIs below $25k, 14.2% for AGIs $25k-50k, 15.4% for AGIs $50k-75k, 14.6% for AGIs $75k-100k, 13.8% for AGIs $100k-200k, 8.3% for AGIs over 200k)
Charity contributions: $3,880 (reported on 20.2% of returns)
Here:
$3,880
State:
$5,698
(% of AGI for various income ranges: 0.6% for AGIs below $25k, 1.6% for AGIs $25k-50k, 1.8% for AGIs $50k-75k, 1.8% for AGIs $75k-100k, 1.6% for AGIs $100k-200k, 1.1% for AGIs over 200k)
Taxes paid: $6,016 (reported on 24.1% of returns)
33138:
$6,016
State:
$6,203
(% of AGI for various income ranges: 1.1% for AGIs below $25k, 2.4% for AGIs $25k-50k, 3.1% for AGIs $50k-75k, 3.7% for AGIs $75k-100k, 3.7% for AGIs $100k-200k, 2.0% for AGIs over 200k)
Earned income credit: $2,279 (reported on 27.8% of returns)
Here:
$2,279
State:
$2,372
(% of AGI for various income ranges: 8.3% for AGIs below $25k, 0.8% for AGIs $25k-50k)
Percentage of individuals using paid preparers for their 2012 taxes: 62.8%
Here:
63%
State:
54%
(% for various income ranges: 59.0% for AGIs below $25k, 63.9% for AGIs $25k-50k, 66.4% for AGIs $50k-75k, 64.6% for AGIs $75k-100k, 72.1% for AGIs $100k-200k, 83.8% for AGIs over 200k)
Averages for the 2004 tax year for zip code 33138, filed in 2005:
Average Adjusted Gross Income (AGI) in 2004: $46,571 (Individual Income Tax Returns)
Here:
$46,571
State:
$50,523
Salary/wage: $39,967 (reported on 81.8% of returns)
Here:
$39,967
State:
$39,563
(% of AGI for various income ranges: 165.1% for AGIs below $10k, 84.2% for AGIs $10k-25k, 84.7% for AGIs $25k-50k, 77.5% for AGIs $50k-75k, 78.7% for AGIs $75k-100k, 57.0% for AGIs over 100k)
Taxable interest for individuals: $3,532 (reported on 32.2% of returns)
This zip code:
$3,532
Florida:
$3,211
(% of AGI for various income ranges: 11.7% for AGIs below $10k, 1.7% for AGIs $10k-25k, 2.0% for AGIs $25k-50k, 2.0% for AGIs $50k-75k, 2.2% for AGIs $75k-100k, 2.7% for AGIs over 100k)
Taxable dividends: $6,797 (reported on 19.1% of returns)
Here:
$6,797
State:
$6,129
(% of AGI for various income ranges: 9.5% for AGIs below $10k, 1.4% for AGIs $10k-25k, 1.5% for AGIs $25k-50k, 2.6% for AGIs $50k-75k, 2.2% for AGIs $75k-100k, 3.5% for AGIs over 100k)
Net capital gain/loss: +$17,112 (reported on 17.5% of returns)
Here:
+$17,112
State:
+$27,205
(% of AGI for various income ranges: 1.2% for AGIs below $10k, 0.5% for AGIs $10k-25k, 0.7% for AGIs $25k-50k, 1.7% for AGIs $50k-75k, 2.8% for AGIs $75k-100k, 11.5% for AGIs over 100k)
Profit/loss from business: +$10,562 (reported on 21.0% of returns)
Here:
+$10,562
State:
+$10,634
(% of AGI for various income ranges: 54.1% for AGIs below $10k, 9.0% for AGIs $10k-25k, 3.6% for AGIs $25k-50k, 5.0% for AGIs $50k-75k, 3.3% for AGIs $75k-100k, 3.2% for AGIs over 100k)
IRA payment deduction: $3,361 (reported on 2.2% of returns)
33138:
$3,361
Florida:
$3,082
(% of AGI for various income ranges: 0.5% for AGIs below $10k, 0.2% for AGIs $10k-25k, 0.2% for AGIs $25k-50k, 0.2% for AGIs $50k-75k, 0.2% for AGIs $75k-100k, 0.1% for AGIs over 100k)
Self-employed pension: $13,931 (reported on 0.6% of returns)
Here:
$13,931
Florida:
$15,857
Total itemized deductions: $19,901 (23% of AGI, reported on 36.8% of returns)
Here:
$19,901
State:
$20,370
Here:
22.9% of AGI
State:
20.7% of AGI
(% of AGI for various income ranges: 28.2% for AGIs below $10k, 17.5% for AGIs $10k-25k, 20.7% for AGIs $25k-50k, 21.8% for AGIs $50k-75k, 19.3% for AGIs $75k-100k, 11.3% for AGIs over 100k)
Charity contributions deductions: $3,013 (3% of AGI, reported on 32.0% of returns)
Here:
$3,013
State:
$4,064
Here:
3.3% of AGI
State:
3.8% of AGI
(% of AGI for various income ranges: 1.3% for AGIs below $10k, 1.9% for AGIs $10k-25k, 2.5% for AGIs $25k-50k, 2.5% for AGIs $50k-75k, 2.0% for AGIs $75k-100k, 1.9% for AGIs over 100k)
Total tax: $10,050 (reported on 67.0% of returns)
33138:
$10,050
State:
$9,431
(% of AGI for various income ranges: 11.3% for AGIs below $10k, 3.2% for AGIs $10k-25k, 6.6% for AGIs $25k-50k, 10.5% for AGIs $50k-75k, 12.6% for AGIs $75k-100k, 20.8% for AGIs over 100k)
Earned income credit: $1,959 (reported on 29.5% of returns)
Here:
$1,959
State:
$1,808
Percentage of individuals using paid preparers for their 2004 taxes: 64.4%
Here:
64%
State:
60%
(% for various income ranges: 63.2% for AGIs below $10k, 62.3% for AGIs $10k-25k, 61.0% for AGIs $25k-50k, 67.8% for AGIs $50k-75k, 68.5% for AGIs $75k-100k, 75.6% for AGIs over 100k)
Likely homosexual households (counted as self-reported same-sex unmarried-partner households)
Lesbian couples: 0.3% of all households
Gay men: 0.9% of all households
Household received Food Stamps/SNAP in the past 12 months: 1,906 Household did not receive Food Stamps/SNAP in the past 12 months: 11,496
Women who had a birth in the past 12 months: 424 (313 now married, 116 unmarried) Women who did not have a birth in the past 12 months: 6,160 (2,281 now married, 3,878 unmarried)
Housing units in zip code 33138 with a mortgage: 4,193 (512 second mortgage, 432 both second mortgage and home equity loan) Houses without a mortgage: 73
Median monthly owner costs for units with a mortgage: $2,980 Median monthly owner costs for units without a mortgage: $1,097
Residents with income below the poverty level in 2022:
This zip code:
12.9%
Whole state:
12.7%
Residents with income below 50% of the poverty level in 2022:
This zip code:
7.5%
Whole state:
6.6%
Median number of rooms in houses and condos:
Here:
5.4
State:
5.9
Median number of rooms in apartments:
Here:
2.9
State:
4.2
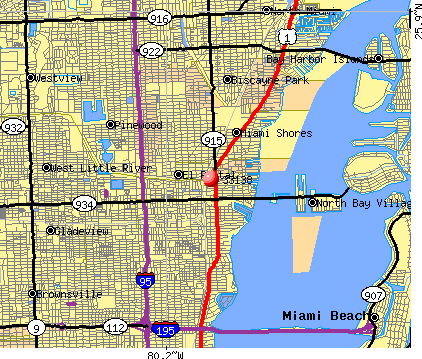
Notable locations in this zip code not listed on our city pages
Notable locations in zip code 33138: Mainlands Golf Course (A), Miami Shores Country Club (B), Brockway Memorial Library (C), Tender Loving Christian Day Care Center (D), Stafford Day Care Center (E), Notre Dame Day Care Center (F), Palm Bay Club (G), Miami Shores City Hall (H), Miami Shores Community Church Day Care Center (I), Miami Shores Fire Station (J), Miami Shores Police Station (K), Miami Shores Presbyterian Church Day Care Center (L), Miami Upper Eastside Police Station (M), My Kids Christian Day Care Center (N), Little River Library (O), Kids Klub International (P), Kids on the Move and More Day Care Center (Q), Kiddie Academy (R), Happy Children's Day Care Center (S), El Portal City Hall (T). Display/hide their locations on the map
Churches in zip code 33138 include: Saint Martha Church (A), Evangel Temple (B), Bethany Church of Miami (C), Saint James Catholic Church (D), Mother of Christ Catholic Church (E), Northeast Baptist Church (F), Miami Shores Baptist Church (G), Church of the Ascension (H). Display/hide their locations on the map
Parks in zip code 33138 include: North Bayshore Park (1), Biscayne Heights Park (2), Belle Meade Park (3), Oakland Grove Mini Park (4), Little River Community Park (5), Pelican Harbor Park (6), Legion Picnic Islands (7). Display/hide their locations on the map
Tourist attraction (not listed on the city page) : Pere En-Devil Botanica Inc (Botanical Gardens; 8009 Northeast 2nd Avenue).
3,184 married couples with children.
2,187 single-parent households (370 men, 1,817 women).
36.2% of residents of 33138 zip code speak English at home.
40.4% of residents speak Spanish at home (66% very well, 14% well, 12% not well, 8% not at all).
23.0% of residents speak other Indo-European language at home (55% very well, 26% well, 13% not well, 5% not at all).
0.7% of residents speak Asian or Pacific Island language at home (95% very well, 5% well).
0.2% of residents speak other language at home (100% very well).
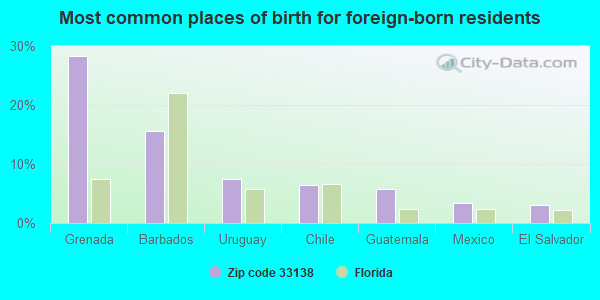
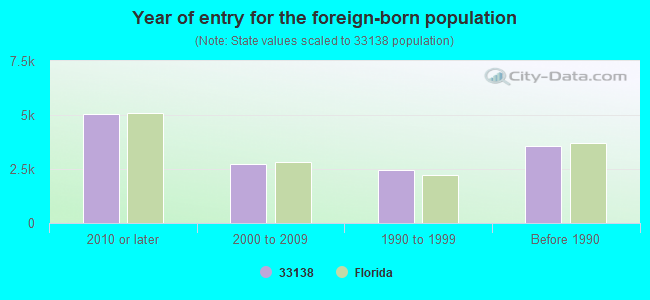
Foreign born population: 12,779 (43.4%) (59.0% of them are naturalized citizens)
This zip code:
43.4%
Whole state:
21.7%
28%Grenada
16%Barbados
8%Uruguay
7%Chile
6%Guatemala
3%Mexico
3%El Salvador
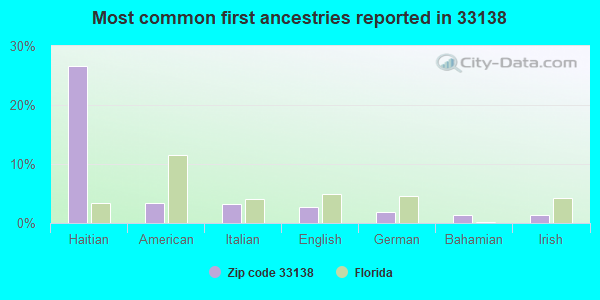
27%Haitian
3%American
3%Italian
3%English
2%German
1%Bahamian
1%Irish
Year of entry for the foreign-born population
5,0562010 or later
2,7382000 to 2009
2,4761990 to 1999
3,576Before 1990
Major facilities with environmental interests located in this zip code:
MORNINGSIDE ELEMENTARY SCHOOL (6620 N.E. 5TH AVENUE in MIAMI, FL)
(National Center for Education Statistics) - STATE ID-3501 Small Quantity Generators, between 100 kg and 1000 kg of hazardous waste/month (Resource Conservation and Recovery Act (tracking hazardous waste)) - notification Organizations: JOHN SCHOECK, PRINCIPAL (CONTACT/OWNER)
, DADE COUNTY SCHOOL DISTRICT (SCHOOL DISTRICT)
Alternative names: DADE CO MORNINGSIDE ELEMENTARY
PHYLLIS R. MILLER ELEMENTARY SCHOOL (840 N.E. 87TH STREET in MIAMI, FL)
(National Center for Education Statistics) - STATE ID-3431 Small Quantity Generators, between 100 kg and 1000 kg of hazardous waste/month (Resource Conservation and Recovery Act (tracking hazardous waste)) - notification Organizations: LORA MANNING, PRINCIPAL (CONTACT/OWNER)
, DADE COUNTY SCHOOL DISTRICT (SCHOOL DISTRICT)
Alternative names: DADE CO MILLER PHYLLIS R
MIAMI SHORES ELEMENTARY SCHOOL (10351 N.E. 5TH AVENUE in MIAMI, FL)
(Geographic Names Information System) (National Center for Education Statistics) - STATE ID-3341 Organizations: DADE COUNTY SCHOOL DISTRICT (SCHOOL DISTRICT)
CLASSY DRY CLEANERS INC (8200 BISCAYNE BLVD in MIAMI, FL)
AIR MINOR (AIRS/AFS) Small Quantity Generators, between 100 kg and 1000 kg of hazardous waste/month (Resource Conservation and Recovery Act (tracking hazardous waste)) - notification Business SIC classification: DRYCLEANING PLANTS, EXCEPT RUG CLEANING Organizations: CLASSY DRY CLEANING INC (CONTACT/OWNER)
MCARTHUR DAIRY LLC (6851 NE 2ND AVE in MIAMI, FL)
(Resource Conservation and Recovery Act (tracking hazardous waste)) TRI REPORTER (Tracking of toxic chemicals releasing facilities) Business SIC classification: FLUID MILK Organizations: DUANE RUTTE, PLANT MANAGER (CONTACT/OWNER)
Alternative names: MC ARTHUR DAIRY INCORPORATED, MCARTHUR DAIRY INC
JIFFY LUBE #381 (8787 BISCAYNE BLVD in MIAMI, FL)
AIR MINOR (AIRS/AFS) Small Quantity Generators, between 100 kg and 1000 kg of hazardous waste/month (Resource Conservation and Recovery Act (tracking hazardous waste)) - notification Business SIC classification: NONCLASSIFIABLE ESTABLISHMENTS Organizations: JOSE GONZALEZ, REGIONAL MGR (CONTACT/OWNER)
Alternative names: JIFFY LUBE STORE #391
AIR MINOR (AIRS/AFS) Small Quantity Generators, between 100 kg and 1000 kg of hazardous waste/month (Resource Conservation and Recovery Act (tracking hazardous waste)) - notification Business SIC classification: DRYCLEANING PLANTS, EXCEPT RUG CLEANING Organizations: EDMUND KERY, PRESIDENT (CONTACT/OWNER)
MARINEMAX MIAMI (700 NORTHEAST 70TH STREET in MIAMI, FL)
National Pollutant Discharge Elimination System NON-MAJOR (Tracking pollutant discharge elimination systems) - permit Organizations: SUSAN KINGSTON (CONTACT/OWNER)
GT DRYCLEANERS LLC (9023 BISCAYNE BLVD in MIAMI SHORES, FL)
AIR MINOR (AIRS/AFS) Small Quantity Generators, between 100 kg and 1000 kg of hazardous waste/month (Resource Conservation and Recovery Act (tracking hazardous waste)) - notification Business SIC classification: DRYCLEANING PLANTS, EXCEPT RUG CLEANING Organizations: EDWIN ANDERSDON (CONTACT/OWNER)
Alternative names: SHORE SQUARE CLEANERS INCORPORATED, SHORES SQUARE CLEANERS INC
Housing units lacking complete plumbing facilities: 2.0% Housing units lacking complete kitchen facilities: 2.2%
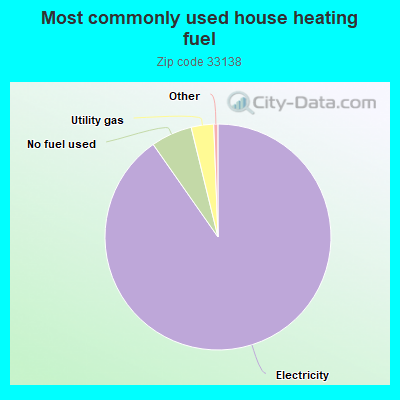
90.2%Electricity
5.9%No fuel used
3.2%Utility gas
Population in 1990: 30,108.
Place of birth for U.S.-born residents:
This state: 9,853
Northeast: 2,668
Midwest: 1,148
South: 1,246
West: 772
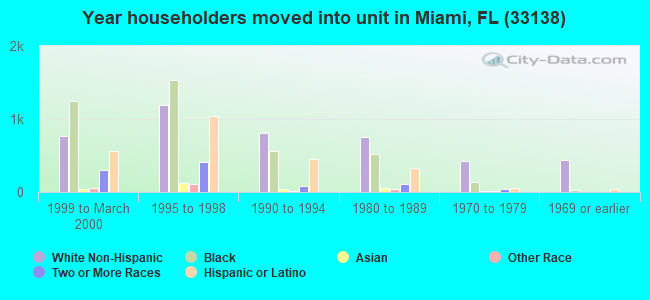
55% of the 33138 zip code residents lived in the same house 5 years ago. Out of people who lived in different houses, 79% lived in this county. Out of people who lived in different counties, 50% lived in Florida.
88% of the 33138 zip code residents lived in the same house 1 year ago. Out of people who lived in different houses, 61% moved from this county. Out of people who lived in different houses, 12% moved from different county within same state. Out of people who lived in different houses, 15% moved from different state. Out of people who lived in different houses, 7% moved from abroad.
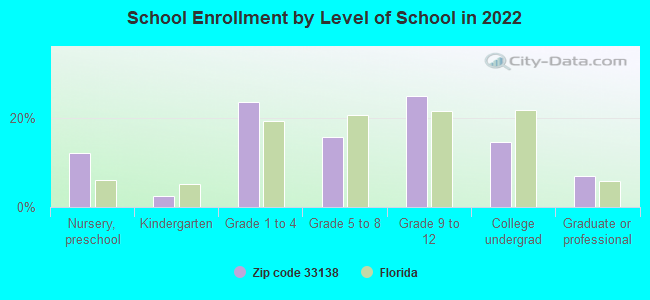
Private vs. public school enrollment:
Students in private schools in grades 1 to 8 (elementary and middle school): 662
Here:
28.7%
Florida:
15.8%
Students in private schools in grades 9 to 12 (high school): 248
Here:
17.0%
Florida:
12.9%
Students in private undergraduate colleges: 348
Here:
40.4%
Florida:
23.6%
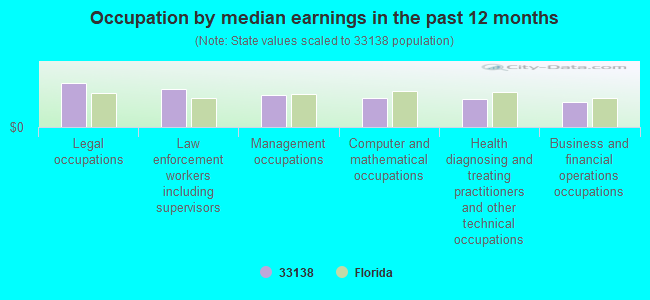
Occupation by median earnings in the past 12 months ($)
131,784Legal occupations
114,798Law enforcement workers including supervisors
95,713Management occupations
85,843Computer and mathematical occupations
85,092Health diagnosing and treating practitioners and other technical occupations
74,784Business and financial operations occupations
Companies with federal contracts located in this zip code (MIAMI, FL):
OVERLOOK VENTURES, INC (4000 TWRSIDE TER STE 1602; small business) 3 employees, $530000 revenue. : $207,292 in 5 contractsfrom 2000 to 2004
Contracts for Lease or Rental of Facilities -- Laboratories and Clinics, Lease or Rental of Facilities -- Miscellaneous Buildings by Department of Veterans Affairs Signed by year:2000: $60,696; 2001: $57,000; 2002: $28,900; 2003: $0; 2004: $60,696; 2005: $0; 2006: $0.
Biggest contracts:
$60,696 with Department of Veterans Affairs for Lease or Rental of Facilities -- Laboratories and Clinics. Taking place in NY. Signed on 2004-10-01. Completion date: 2005-09-30.
$60,696, same as above.Signed on 2000-05-17. Completion date: 2005-09-30.
$57,000 with Department of Veterans Affairs for Lease or Rental of Facilities -- Laboratories and Clinics. Signed on 2001-12-15. Completion date: 2002-09-15.
$28,900 with Department of Veterans Affairs for Lease or Rental of Facilities -- Miscellaneous Buildings. Signed on 2002-10-15. Completion date: 2003-09-15.
COVERT OPS LTD (750 NE 64TH ST B408; small business) : $125,428 in 3 contractsfrom 2000 to 2001
$101,428 with Army for Miscellaneous Communication Equipment. Taking place in MS. Signed on 2001-08-23. Completion date: 2001-09-28.
$21,000 with Public Buildings Service for Installation of Equipment -- Photographic Equipment. Taking place in NY. Signed on 2000-06-15. Completion date: 2000-09-15.
$3,000, same as above.Signed on 2000-08-15. Completion date: 2000-09-15.
G&A MAINTENANCE, INC (7541 NE 3RD PLACE; small business) : $84,501 in 5 contractsfrom 2002 to 2004
Contracts for Gas Services, Custodial Janitorial Services, Architect - Engineer Services (including landscaping, interior layout, and designing) by Navy Signed by year:2000: $0; 2001: $0; 2002: $24,267; 2003: $35,967; 2004: $24,267; 2005: $0; 2006: $0.
Biggest contracts:
$24,267 with Navy for Gas Services. Signed on 2004-05-04. Completion date: 2005-05-06.
$24,267 with Navy for Custodial Janitorial Services. Signed on 2003-05-07. Completion date: 2004-05-06.
$24,267, same as above.Signed on 2002-05-01. Completion date: 2003-05-06.
$11,700 with Navy for Architect - Engineer Services (including landscaping, interior layout, and designing). Taking place in TX. Signed on 2003-04-10. Completion date: 2004-04-09.
B P R (770 NE 69TH ST, SUITE 7C; small business)
$6,500 with Army for Other Professional Services. Taking place in DC. Signed on 2002-02-04. Completion date: 2002-02-15.
Top industries in this zip code by the number of employees in 2005:
Administrative and Support and Waste Management and Remediation Services: Office Administrative Services (250-499 employees: 1 establishment, 1-4 employees: 2 establishments)
Other Services (except Public Administration): Religious Organizations (100-249: 1, 50-99: 1, 20-49: 1, 10-19: 3, 5-9: 3, 1-4: 2)
2005 - 2018 National Fire Incident Reporting System (NFIRS) incidents
Based on the data from the years 2005 - 2018 the average number of fire incidents per year is 192. The highest number of fire incidents - 290 took place in 2006, and the least - 147 in 2008. The data has a dropping trend.
When looking into fire subcategories, the most incidents belonged to: Structure Fires (53.8%), and Mobile Property/Vehicle Fires (23.3%).
Fire incident types reported to NFIRS in Zip Code 33138


 Nearest zip codes: 33150, 33137, 33141, 33161, 33127, 33168.


 Based on the data from the years 2005 - 2018 the average number of fire incidents per year is 192. The highest number of fire incidents - 290 took place in 2006, and the least - 147 in 2008. The data has a dropping trend.
 When looking into fire subcategories, the most incidents belonged to: Structure Fires (53.8%), and Mobile Property/Vehicle Fires (23.3%).