Estimated zip code population in 2022: 54,314 Zip code population in 2010: 53,710 Zip code population in 2000: 53,248
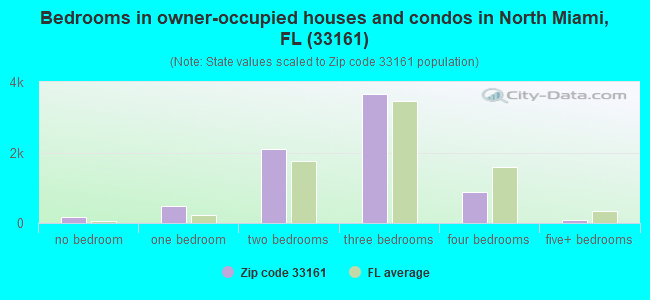
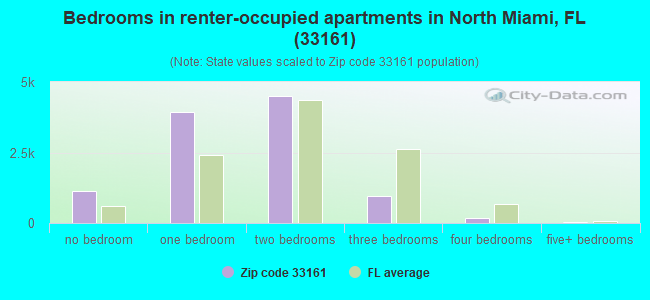
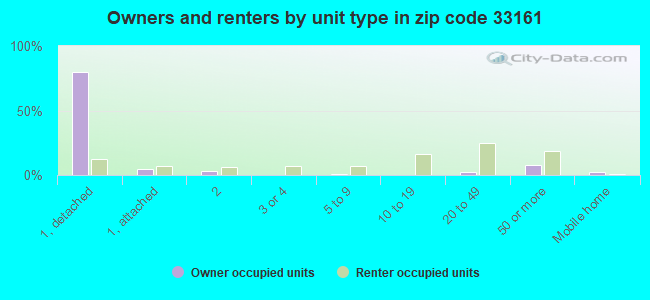
Houses and condos: 19,319 Renter-occupied apartments: 10,641
% of renters here:
59%
State:
33%
March 2022 cost of living index in zip code 33161: 106.5 (more than average, U.S. average is 100)
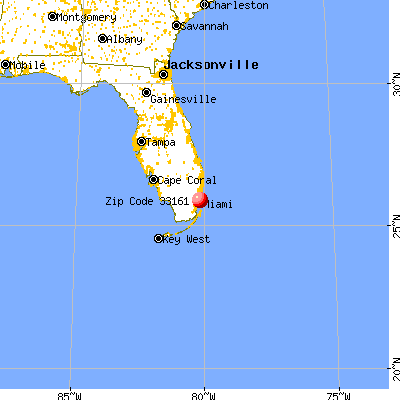
Land area: 5.5 sq. mi. Water area: 0.1 sq. mi.
Population density: 9,933 people per square mile
(high).
OSM Map
General Map
Google Map
MSN Map
OSM Map
General Map
Google Map
MSN Map
OSM Map
General Map
Google Map
MSN Map
OSM Map
General Map
Google Map
MSN Map
Please wait while loading the map...
Real estate property taxes paid for housing units in 2022:
This zip code:
0.6% ($2,750)
Florida:
0.7% ($2,529)
Median real estate property taxes paid for housing units with mortgages in 2022: $3,184 (0.7%) Median real estate property taxes paid for housing units with no mortgage in 2022: $1,879 (0.6%)
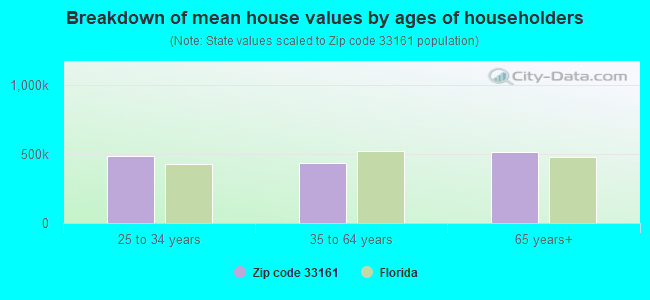
Estimated median house/condo value in 2022: $430,567
33161:
$430,567
Florida:
$354,100
According to our research of Florida and other state lists, there were 32 registered sex offenders living in 33161 zip code as of April 27, 2024. The ratio of all residents to sex offenders in zip code 33161 is 1,787 to 1. The ratio of registered sex offenders to all residents in this zip code is much lower than the state average.
Median resident age:
This zip code:
37.5 years
Florida median age:
42.7 years
Average household size:
This zip code:
2.8 people
Florida:
2.5 people
Averages for the 2020 tax year for zip code 33161, filed in 2021:
Average Adjusted Gross Income (AGI) in 2020: $37,137 (Individual Income Tax Returns)
Here:
$37,137
State:
$82,200
Salary/wage: $35,634 (reported on 83.7% of returns)
Here:
$35,634
State:
$58,347
(% of AGI for various income ranges: 1341.9% for AGIs below $25k, 3594.1% for AGIs $25k-50k, 6799.6% for AGIs $50k-75k, 10207.4% for AGIs $75k-100k, 18314.4% for AGIs $100k-200k, 59350.0% for AGIs over 200k)
Taxable interest for individuals: $1,084 (reported on 10.2% of returns)
This zip code:
$1,084
Florida:
$4,272
(% of AGI for various income ranges: 3.1% for AGIs below $25k, 4.4% for AGIs $25k-50k, 17.6% for AGIs $50k-75k, 30.6% for AGIs $75k-100k, 75.9% for AGIs $100k-200k, 985.0% for AGIs over 200k)
Ordinary dividends: $3,212 (reported on 5.8% of returns)
Here:
$3,212
State:
$15,863
(% of AGI for various income ranges: 4.0% for AGIs below $25k, 4.2% for AGIs $25k-50k, 24.3% for AGIs $50k-75k, 87.8% for AGIs $75k-100k, 141.4% for AGIs $100k-200k, 1733.3% for AGIs over 200k)
Net capital gain/loss in AGI: +$10,538 (reported on 7.1% of returns)
Here:
+$10,538
State:
+$62,983
(% of AGI for various income ranges: 0.1% for AGIs below $25k, 1.9% for AGIs $25k-50k, 46.1% for AGIs $50k-75k, 157.2% for AGIs $75k-100k, 635.0% for AGIs $100k-200k, 10865.0% for AGIs over 200k)
Profit/loss from business: +$1,709 (reported on 35.7% of returns)
Here:
+$1,709
State:
+$9,719
(% of AGI for various income ranges: 121.2% for AGIs below $25k, 61.5% for AGIs $50k-75k, 90.6% for AGIs $75k-100k, 331.8% for AGIs $100k-200k, 1047.5% for AGIs over 200k)
Taxable individual retirement arrangement distribution: $13,219 (reported on 1.8% of returns)
33161:
$13,219
Florida:
$24,823
(% of AGI for various income ranges: 8.3% for AGIs below $25k, 19.8% for AGIs $25k-50k, 49.3% for AGIs $50k-75k, 131.5% for AGIs $75k-100k, 324.2% for AGIs $100k-200k)
Total itemized deductions: $30,247 (reported on 5.7% of returns)
Here:
$30,247
State:
$45,393
(% of AGI for various income ranges: 29.3% for AGIs below $25k, 159.2% for AGIs $25k-50k, 443.5% for AGIs $50k-75k, 803.6% for AGIs $75k-100k, 1359.8% for AGIs $100k-200k, 6904.2% for AGIs over 200k)
Charity contributions: $7,264 (reported on 4.1% of returns)
Here:
$7,264
State:
$20,178
(% of AGI for various income ranges: 2.3% for AGIs below $25k, 18.5% for AGIs $25k-50k, 80.4% for AGIs $50k-75k, 159.3% for AGIs $75k-100k, 326.8% for AGIs $100k-200k, 1220.0% for AGIs over 200k)
Taxes paid: $7,083 (reported on 5.4% of returns)
33161:
$7,083
State:
$6,967
(% of AGI for various income ranges: 5.9% for AGIs below $25k, 36.5% for AGIs $25k-50k, 108.0% for AGIs $50k-75k, 195.3% for AGIs $75k-100k, 330.0% for AGIs $100k-200k, 976.7% for AGIs over 200k)
Earned income credit: $2,480 (reported on 37.4% of returns)
Here:
$2,480
State:
$2,306
(% of AGI for various income ranges: 161.1% for AGIs below $25k, 101.6% for AGIs $25k-50k, 1.4% for AGIs $50k-75k)
Percentage of individuals using paid preparers for their 2020 taxes: 91.5%
Here:
91%
State:
92%
(% for various income ranges: 90.4% for AGIs below $25k, 93.5% for AGIs $25k-50k, 91.6% for AGIs $50k-75k, 91.2% for AGIs $75k-100k, 90.3% for AGIs $100k-200k, 93.9% for AGIs over 200k)
Averages for the 2012 tax year for zip code 33161, filed in 2013:
Average Adjusted Gross Income (AGI) in 2012: $25,971 (Individual Income Tax Returns)
Here:
$25,971
State:
$60,316
Salary/wage: $25,620 (reported on 84.8% of returns)
Here:
$25,620
State:
$45,277
(% of AGI for various income ranges: 82.9% for AGIs below $25k, 90.9% for AGIs $25k-50k, 86.1% for AGIs $50k-75k, 85.7% for AGIs $75k-100k, 81.5% for AGIs $100k-200k, 51.8% for AGIs over 200k)
Taxable interest for individuals: $1,816 (reported on 9.7% of returns)
This zip code:
$1,816
Florida:
$3,587
(% of AGI for various income ranges: 0.6% for AGIs below $25k, 0.6% for AGIs $25k-50k, 0.5% for AGIs $50k-75k, 0.3% for AGIs $75k-100k, 1.2% for AGIs $100k-200k, 1.4% for AGIs over 200k)
Ordinary dividends: $9,921 (reported on 6.6% of returns)
Here:
$9,921
State:
$12,831
(% of AGI for various income ranges: 3.3% for AGIs below $25k, 2.6% for AGIs $25k-50k, 2.4% for AGIs $50k-75k, 0.9% for AGIs $75k-100k, 1.4% for AGIs $100k-200k, 1.9% for AGIs over 200k)
Net capital gain/loss in AGI: +$5,194 (reported on 3.3% of returns)
Here:
+$5,194
State:
+$33,493
(% of AGI for various income ranges: 0.3% for AGIs $75k-100k, 1.2% for AGIs $100k-200k, 7.7% for AGIs over 200k)
Profit/loss from business: +$4,556 (reported on 21.0% of returns)
Here:
+$4,556
State:
+$10,012
(% of AGI for various income ranges: 8.6% for AGIs below $25k, 0.5% for AGIs $25k-50k, 1.0% for AGIs $50k-75k, 2.2% for AGIs $75k-100k, 2.1% for AGIs $100k-200k, 1.4% for AGIs over 200k)
Taxable individual retirement arrangement distribution: $11,490 (reported on 1.7% of returns)
33161:
$11,490
Florida:
$21,544
(% of AGI for various income ranges: 0.3% for AGIs below $25k, 0.4% for AGIs $25k-50k, 0.9% for AGIs $50k-75k, 1.5% for AGIs $75k-100k, 2.7% for AGIs $100k-200k)
Self-employment retirement plans: $7,467 (reported on 0.1% of returns)
33161:
$7,467
Florida:
$20,611
Total itemized deductions: $17,861 (31% of AGI, reported on 15.7% of returns)
Here:
$17,861
State:
$25,533
Here:
30.9% of AGI
State:
18.0% of AGI
(% of AGI for various income ranges: 5.2% for AGIs below $25k, 14.3% for AGIs $25k-50k, 15.6% for AGIs $50k-75k, 13.9% for AGIs $75k-100k, 12.8% for AGIs $100k-200k, 8.3% for AGIs over 200k)
Charity contributions: $3,070 (reported on 12.1% of returns)
Here:
$3,070
State:
$5,698
(% of AGI for various income ranges: 0.5% for AGIs below $25k, 1.7% for AGIs $25k-50k, 2.4% for AGIs $50k-75k, 2.5% for AGIs $75k-100k, 2.0% for AGIs $100k-200k, 0.9% for AGIs over 200k)
Taxes paid: $2,902 (reported on 14.5% of returns)
33161:
$2,902
State:
$6,203
(% of AGI for various income ranges: 0.6% for AGIs below $25k, 1.9% for AGIs $25k-50k, 2.5% for AGIs $50k-75k, 2.2% for AGIs $75k-100k, 2.6% for AGIs $100k-200k, 1.9% for AGIs over 200k)
Earned income credit: $2,580 (reported on 41.4% of returns)
Here:
$2,580
State:
$2,372
(% of AGI for various income ranges: 10.9% for AGIs below $25k, 1.5% for AGIs $25k-50k)
Percentage of individuals using paid preparers for their 2012 taxes: 68.4%
Here:
68%
State:
54%
(% for various income ranges: 67.4% for AGIs below $25k, 71.0% for AGIs $25k-50k, 69.5% for AGIs $50k-75k, 66.2% for AGIs $75k-100k, 72.1% for AGIs $100k-200k, 81.8% for AGIs over 200k)
Averages for the 2004 tax year for zip code 33161, filed in 2005:
Average Adjusted Gross Income (AGI) in 2004: $25,243 (Individual Income Tax Returns)
Here:
$25,243
State:
$50,523
Salary/wage: $24,945 (reported on 87.8% of returns)
Here:
$24,945
State:
$39,563
(% of AGI for various income ranges: 80.2% for AGIs below $10k, 88.7% for AGIs $10k-25k, 94.4% for AGIs $25k-50k, 91.4% for AGIs $50k-75k, 85.5% for AGIs $75k-100k, 62.3% for AGIs over 100k)
Taxable interest for individuals: $1,263 (reported on 16.2% of returns)
This zip code:
$1,263
Florida:
$3,211
(% of AGI for various income ranges: 1.8% for AGIs below $10k, 0.5% for AGIs $10k-25k, 0.5% for AGIs $25k-50k, 0.7% for AGIs $50k-75k, 0.8% for AGIs $75k-100k, 2.0% for AGIs over 100k)
Taxable dividends: $3,222 (reported on 5.3% of returns)
Here:
$3,222
State:
$6,129
(% of AGI for various income ranges: 0.9% for AGIs below $10k, 0.2% for AGIs $10k-25k, 0.3% for AGIs $25k-50k, 0.5% for AGIs $50k-75k, 0.8% for AGIs $75k-100k, 2.7% for AGIs over 100k)
Net capital gain/loss: +$14,578 (reported on 4.9% of returns)
Here:
+$14,578
State:
+$27,205
(% of AGI for various income ranges: -0.4% for AGIs below $10k, 0.2% for AGIs $10k-25k, 0.2% for AGIs $25k-50k, 0.9% for AGIs $50k-75k, 2.4% for AGIs $75k-100k, 18.2% for AGIs over 100k)
Profit/loss from business: +$6,502 (reported on 19.2% of returns)
Here:
+$6,502
State:
+$10,634
(% of AGI for various income ranges: 31.4% for AGIs below $10k, 8.7% for AGIs $10k-25k, 1.6% for AGIs $25k-50k, 1.3% for AGIs $50k-75k, 1.7% for AGIs $75k-100k, 1.2% for AGIs over 100k)
IRA payment deduction: $2,495 (reported on 1.2% of returns)
33161:
$2,495
Florida:
$3,082
(% of AGI for various income ranges: 0.1% for AGIs below $10k, 0.1% for AGIs $10k-25k, 0.2% for AGIs $25k-50k, 0.1% for AGIs $50k-75k, 0.2% for AGIs $75k-100k, 0.1% for AGIs over 100k)
Total itemized deductions: $15,714 (35% of AGI, reported on 25.7% of returns)
Here:
$15,714
State:
$20,370
Here:
35.0% of AGI
State:
20.7% of AGI
(% of AGI for various income ranges: 5.2% for AGIs below $10k, 11.9% for AGIs $10k-25k, 21.4% for AGIs $25k-50k, 19.8% for AGIs $50k-75k, 16.9% for AGIs $75k-100k, 11.2% for AGIs over 100k)
Charity contributions deductions: $2,676 (6% of AGI, reported on 21.6% of returns)
Here:
$2,676
State:
$4,064
Here:
5.7% of AGI
State:
3.8% of AGI
(% of AGI for various income ranges: 0.3% for AGIs below $10k, 1.3% for AGIs $10k-25k, 3.0% for AGIs $25k-50k, 3.0% for AGIs $50k-75k, 3.0% for AGIs $75k-100k, 2.2% for AGIs over 100k)
Total tax: $3,112 (reported on 56.2% of returns)
33161:
$3,112
State:
$9,431
(% of AGI for various income ranges: 5.3% for AGIs below $10k, 2.7% for AGIs $10k-25k, 4.6% for AGIs $25k-50k, 8.4% for AGIs $50k-75k, 10.9% for AGIs $75k-100k, 18.2% for AGIs over 100k)
Earned income credit: $2,083 (reported on 42.5% of returns)
Here:
$2,083
State:
$1,808
Percentage of individuals using paid preparers for their 2004 taxes: 65.6%
Here:
66%
State:
60%
(% for various income ranges: 63.5% for AGIs below $10k, 66.7% for AGIs $10k-25k, 64.9% for AGIs $25k-50k, 65.7% for AGIs $50k-75k, 68.7% for AGIs $75k-100k, 72.5% for AGIs over 100k)
Likely homosexual households (counted as self-reported same-sex unmarried-partner households)
Lesbian couples: 0.1% of all households
Gay men: 0.2% of all households
Household received Food Stamps/SNAP in the past 12 months: 4,954 Household did not receive Food Stamps/SNAP in the past 12 months: 12,994
Women who had a birth in the past 12 months: 771 (447 now married, 316 unmarried) Women who did not have a birth in the past 12 months: 13,446 (3,969 now married, 9,471 unmarried)
Housing units in zip code 33161 with a mortgage: 4,727 (174 second mortgage, 28 home equity loan, 100 both second mortgage and home equity loan) Median monthly owner costs for units with a mortgage: $2,025 Median monthly owner costs for units without a mortgage: $545
Residents with income below the poverty level in 2022:
This zip code:
19.5%
Whole state:
12.7%
Residents with income below 50% of the poverty level in 2022:
This zip code:
11.8%
Whole state:
6.6%
Median number of rooms in houses and condos:
Here:
5.3
State:
5.9
Median number of rooms in apartments:
Here:
3.6
State:
4.2
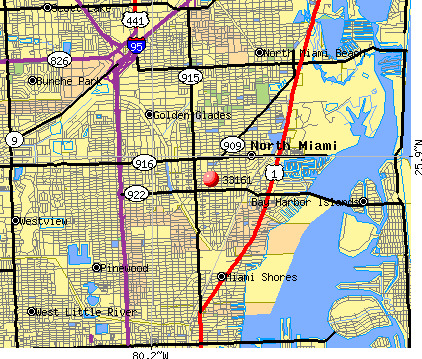
Notable locations in this zip code not listed on our city pages
Notable locations in zip code 33161: North Miami Downtown Commercial Center (A), North Miami Community Center (B), 27th Avenue Farmers Market (C), Central Shopping Plaza (D), North Miami Public Library E May Avil Branch (E), City of North Miami Museum of Contemporary Art (F), YMCA of Greater Miami (G), Villa Maria Nursing Center (H), Tysba Day Care and Learning Center (I), Toddler's Inn (J), Totland Child Care Center (K), Star Bright Child Development Center (L), Small Wonders Child Care Center (M), Saint Pauls United Methodist Church Day Care Center (N), Pinecrest Convalescent Home (O), Pines Nursing Home (P), North Miami Baptist Academy (Q), North Miami Beach City Hall (R), North Miami Early Childhood and Day Care Center (S), North Miami East Fire Station (T). Display/hide their locations on the map
Shopping Centers: Dixie Shopping Center (1), University Shopping Center (2), Sunshine Shopping Center (3), Norwood Shopping Center West (4). Display/hide their locations on the map
Churches in zip code 33161 include: Stanton Memorial North Shore Church (A), Holy Family Church (B), Holy Cross Church (C), Temple Hatikvah Messianic Assembly (D), Miami Shores Church of Christ (E), Unity Center of Practical Christianity (F), I Am Sanctuary (G). Display/hide their locations on the map
Parks in zip code 33161 include: Burk Recreation Center (1), Griffing Park (2), Cagni Park (3), Breezeswept Park (4), Cagni Park (5). Display/hide their locations on the map
Tourist attraction (not listed on the city page) : African-American Travel Magazine (276 Northeast 110 Street).
5,679 married couples with children.
5,224 single-parent households (1,409 men, 3,815 women).
25.2% of residents of 33161 zip code speak English at home.
27.5% of residents speak Spanish at home (55% very well, 21% well, 16% not well, 8% not at all).
47.2% of residents speak other Indo-European language at home (60% very well, 23% well, 14% not well, 4% not at all).
1.4% of residents speak Asian or Pacific Island language at home (66% very well, 32% well, 2% not well).
0.1% of residents speak other language at home (95% very well, 5% not well).
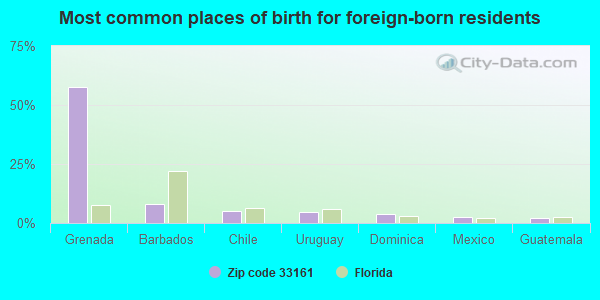
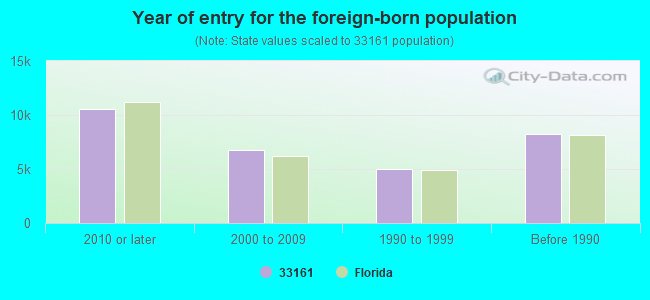
Foreign born population: 29,194 (53.8%) (58.7% of them are naturalized citizens)
This zip code:
53.8%
Whole state:
21.7%
58%Grenada
8%Barbados
5%Chile
5%Uruguay
4%Dominica
2%Mexico
2%Guatemala
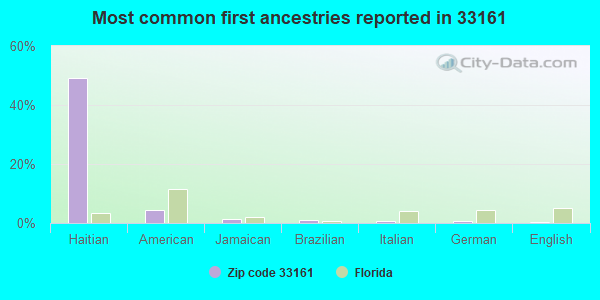
49%Haitian
4%American
1%Jamaican
1%Brazilian
1%Italian
1%German
0%English
Year of entry for the foreign-born population
10,5402010 or later
6,7282000 to 2009
4,9621990 to 1999
8,255Before 1990
Major facilities with environmental interests located in this zip code:
COSTCO WHOLESALE #182 (14585 BISCAYNE BLVD in NORTH MIAMI, FL)
STATE MASTER (FDM) - CHAZ-FL0000924704, HAZARDOUS WASTE REGULATION PROGRAM Small Quantity Generators, between 100 kg and 1000 kg of hazardous waste/month (Resource Conservation and Recovery Act (tracking hazardous waste)) Business SIC classification: PHOTOFINISHING LABORATORIES Organizations: COSTCO WHOLESALE CORPORATION (CONTACT/OWNER)
, COSTCO WHOLESALE CORP (CONTACT/OWNER)
Alternative names: COSTCO WHOLESALE CLUB
N & K ENTERPRISES INC.(PESTICIDE DIV.) (1495 NE 129TH ST in NORTH MIAMI, FL)
(Integrated Compliance Information System) - ICIS-04-1999-0295, FORMAL ENFORCEMENT ACTION, ICIS-04-2000-0845, COMPLIANCE ACTIVITY (Tracking inspections of insecticide, fungicide, and rodenticide, and toxic substances) Business SIC classification: SERVICE ESTABLISHMENT EQUIPMENT AND SUPPLIES; BUILDING CLEANING AND MAINTENANCE SERVICES
NORTH MIAMI ELEMENTARY SCHOOL (655 N.E. 145TH STREET in NORTH MIAMI, FL)
(National Center for Education Statistics) - STATE ID-3941 Small Quantity Generators, between 100 kg and 1000 kg of hazardous waste/month (Resource Conservation and Recovery Act (tracking hazardous waste)) - notification Organizations: GEORGE BROWN, PRINCIPAL (CONTACT/OWNER)
, DADE COUNTY SCHOOL DISTRICT (SCHOOL DISTRICT)
Alternative names: DADE CO N MIAMI ELEM
NORTH MIAMI SENIOR HIGH SCHOOL (800 N.E. 137TH STREET in NORTH MIAMI, FL)
(Geographic Names Information System) (National Center for Education Statistics) - STATE ID-7591 Organizations: DADE COUNTY SCHOOL DISTRICT (SCHOOL DISTRICT)
NORTH MIAMI SENIOR ADULT EDUCATION CENTER (800 N.E. 137TH STREET in NORTH MIAMI, FL)
(National Center for Education Statistics) - STATE ID-7592 Organizations: DADE COUNTY SCHOOL DISTRICT (SCHOOL DISTRICT)
ASPIRA YOUTH LEADERSHIP CHARTER SCHOOL (13300 MEMORIAL HIGHWAY in NORTH MIAMI, FL)
(National Center for Education Statistics) - STATE ID-6020 Organizations: DADE COUNTY SCHOOL DISTRICT (SCHOOL DISTRICT)
LINDA LENTIN ELEMENTARY SCHOOL (14312 N.E. 2ND COURT in NORTH MIAMI, FL)
(National Center for Education Statistics) - STATE ID-2911 Organizations: DADE COUNTY SCHOOL DISTRICT (SCHOOL DISTRICT)
NORTH MIAMI MIDDLE SCHOOL (13105 N.E. 7TH AVENUE in NORTH MIAMI, FL)
(National Center for Education Statistics) - STATE ID-6631 Organizations: DADE COUNTY SCHOOL DISTRICT (SCHOOL DISTRICT)
ROYAL CLEANERS (2100 NE 123RD STREET in NORTH MIAMI, FL)
AIR MINOR (AIRS/AFS) Small Quantity Generators, between 100 kg and 1000 kg of hazardous waste/month (Resource Conservation and Recovery Act (tracking hazardous waste)) - notification Business SIC classification: DRYCLEANING PLANTS, EXCEPT RUG CLEANING Organizations: PETER TAYLOR, PRES (CONTACT/OWNER)
DALY CLEANER INC (826 NE 125TH STREET # 28 in NORTH MIAMI, FL)
AIR MINOR (AIRS/AFS) Small Quantity Generators, between 100 kg and 1000 kg of hazardous waste/month (Resource Conservation and Recovery Act (tracking hazardous waste)) - notification Small Quantity Generators, between 100 kg and 1000 kg of hazardous waste/month (Resource Conservation and Recovery Act (tracking hazardous waste)) - notification Business SIC classification: DRYCLEANING PLANTS, EXCEPT RUG CLEANING Organizations: VIODAL CLEANERS INC (CONTACT/OWNER)
, DALY ARNALDO, PRES (CONTACT/OWNER)
MUNISPORT LANDFILL SITE (NORTHEAST 151ST STREET in NORTH MIAMI, FL)
(Integrated Compliance Information System) - ICIS-04-1990-0125, FORMAL ENFORCEMENT ACTION
COUNTRY CLUB INV'T OF NORTH MIAMI (436 NE 125 ST in NORTH MIAMI, FL)
AIR MINOR (AIRS/AFS) (Resource Conservation and Recovery Act (tracking hazardous waste)) Business SIC classification: DRYCLEANING PLANTS, EXCEPT RUG CLEANING Organizations: IRA HURST, PRESIDENT (CONTACT/OWNER)
Alternative names: COUNTRY CLUB DRY CLEANERS
POTAMKIN NORTH MIAMI INC (1850 NE 123RD ST in NORTH MIAMI, FL)
(Resource Conservation and Recovery Act (tracking hazardous waste)) Small Quantity Generators, between 100 kg and 1000 kg of hazardous waste/month (Resource Conservation and Recovery Act (tracking hazardous waste)) - notification Organizations: MEREADO LEMUEL, MGR (CONTACT/OWNER)
, R THOMPSON, SVC MGR (CONTACT/OWNER)
Alternative names: CHRYSLER PLYMOUTH OF N MIAMI
Housing units lacking complete plumbing facilities: 1.4% Housing units lacking complete kitchen facilities: 1.7%
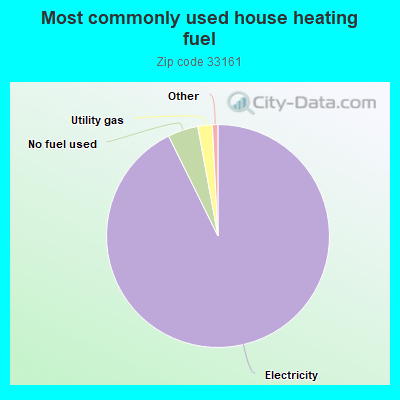
92.8%Electricity
4.4%No fuel used
2.1%Utility gas
Population in 1990: 44,800. Population change in the 1990s: +8,448 (+18.9%).
Place of birth for U.S.-born residents:
This state: 18,803
Northeast: 2,660
Midwest: 580
South: 1,401
West: 470
54% of the 33161 zip code residents lived in the same house 5 years ago. Out of people who lived in different houses, 82% lived in this county. Out of people who lived in different counties, 50% lived in Florida.
88% of the 33161 zip code residents lived in the same house 1 year ago. Out of people who lived in different houses, 62% moved from this county. Out of people who lived in different houses, 11% moved from different county within same state. Out of people who lived in different houses, 10% moved from different state. Out of people who lived in different houses, 12% moved from abroad.
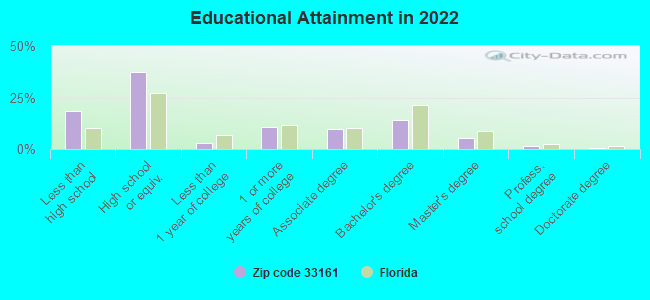
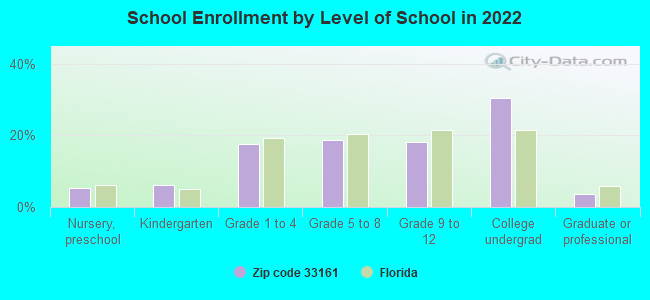
Private vs. public school enrollment:
Students in private schools in grades 1 to 8 (elementary and middle school): 458
Here:
9.1%
Florida:
15.8%
Students in private schools in grades 9 to 12 (high school): 88
Here:
3.5%
Florida:
12.9%
Students in private undergraduate colleges: 1,872
Here:
43.4%
Florida:
23.6%
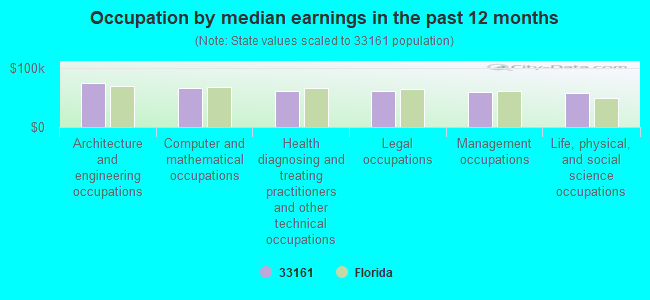
Occupation by median earnings in the past 12 months ($)
74,940Architecture and engineering occupations
67,089Computer and mathematical occupations
62,047Health diagnosing and treating practitioners and other technical occupations
60,757Legal occupations
59,161Management occupations
57,097Life, physical, and social science occupations
Companies with federal contracts located in this zip code:
A2D SOLUTIONS (12280 NE 14TH AVENUE in NORTH MIAMI, FL; small business) : $149,371 in 9 contractsfrom 2001 to 2005
Contracts for Miscellaneous Communication Equipment, Video Recording and Reproducing Equipment, Defense Missile and Space Systems -- Advanced Development (R&D), Office Furniture, and moreby Navy, Uniformed Services University of the Health Sciences, Army, NASA, and others Signed by year:2000: $0; 2001: $111,687; 2002: $5,655; 2003: $0; 2004: $10,484; 2005: $21,545; 2006: $0.
Biggest contracts:
$111,687 with Navy for Miscellaneous Communication Equipment. Signed on 2001-07-31. Completion date: 2001-09-30.
$10,818 with Uniformed Services University of the Health Sciences for Video Recording and Reproducing Equipment. Signed on 2005-08-26. Completion date: 2005-07-13.
$5,655 with Army for Defense Missile and Space Systems -- Advanced Development (R&D). Signed on 2002-08-23. Completion date: 2002-09-23.
$4,761 with Navy for Office Furniture. Signed on 2005-09-24. Completion date: 2005-10-07.
PERFECTION IN BLINDS, INC (13886 W DIXIE HWY in MIAMI, FL; small business) : $24,600 in 2 contractsin 2002
$14,900 with Navy for Maintenance, Repair or Alteration of Real Property -- Family Housing Facilities. Taking place in GA. Signed on 2002-09-26. Completion date: 2002-11-15.
$9,700, same as above.Signed on 2002-09-23. Completion date: 2002-11-15.
NEMAL ELECTRONICS INTERNATIONA (12240 NE 14TH AVE in MIAMI, FL; small business) : $17,806 in 4 contractsfrom 2003 to 2006
$7,589 with U.S. Special Operations Command for Connectors, Electrical. Signed on 2006-03-15. Completion date: 2006-03-27.
$5,880 with Army for Miscellaneous Communication Equipment. Signed on 2003-09-26. Completion date: 2003-12-05.
$4,153 with U.S. Special Operations Command for Fiber Optic Accessories And Supplies. Signed on 2006-01-30. Completion date: 2006-02-03.
$184 with Navy for Miscellaneous Electrical and Electronic Components. Signed on 2004-04-06. Completion date: 2004-06-04.
PRO SOUND INC (1375 NE 123RD ST in MIAMI, FL; small business)
$8,500 with Air Force for Video Recording and Reproducing Equipment. Signed on 2005-09-22. Completion date: 2005-10-27.
BARRY UNIVERSITY INC (11300 NE 2 AVE in MIAMI, FL) : $5,200 in 3 contractsin 2005
$3,250 with Army for Educational Services. Signed on 2005-02-22. Completion date: 2005-09-30.
$1,950, same as above.Signed on 2005-06-07. Completion date: 2005-09-30.
$0, same as above.Signed on 2005-06-07. Completion date: 2005-09-30.
Top industries in this zip code by the number of employees in 2005:
Health Care and Social Assistance: Nursing Care Facilities (250-499 employees: 2 establishments, 100-249 employees: 6 establishments, 50-99 employees: 1 establishment)
Educational Services: Colleges, Universities, and Professional Schools (over 1000: 1, 5-9: 1)
Administrative and Support and Waste Management and Remediation Services: Security Guards and Patrol Services (500-999: 1, 5-9: 1, 1-4: 2)
2008 - 2018 National Fire Incident Reporting System (NFIRS) incidents
Based on the data from the years 2008 - 2018 the average number of fires per year is 113. The highest number of fire incidents - 149 took place in 2009, and the least - 77 in 2015. The data has an increasing trend.
When looking into fire subcategories, the most incidents belonged to: Structure Fires (42.0%), and Outside Fires (32.2%).
Fire incident types reported to NFIRS in Zip Code 33161


 Nearest zip codes: 33168, 33181, 33162, 33138, 33150, 33154.


 Based on the data from the years 2008 - 2018 the average number of fires per year is 113. The highest number of fire incidents - 149 took place in 2009, and the least - 77 in 2015. The data has an increasing trend.
 When looking into fire subcategories, the most incidents belonged to: Structure Fires (42.0%), and Outside Fires (32.2%).