Estimated zip code population in 2022: 49,689 Zip code population in 2010: 43,539 Zip code population in 2000: 45,224
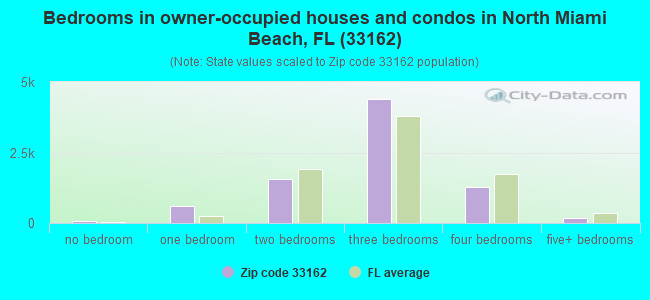
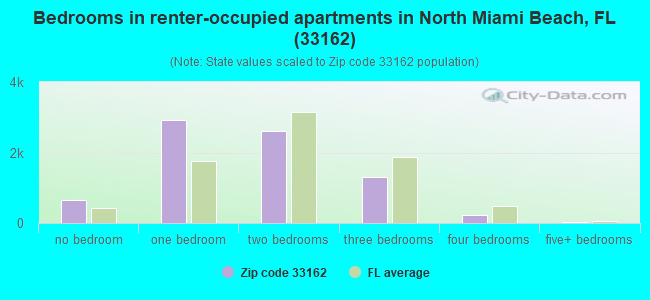
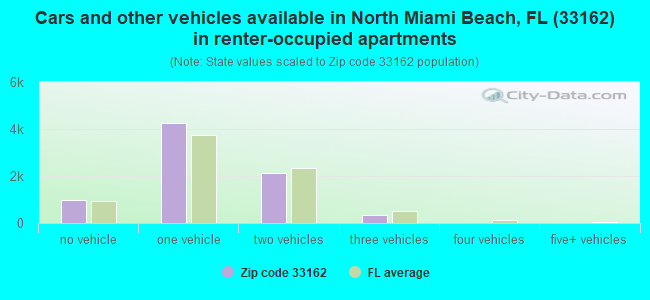
Houses and condos: 16,903 Renter-occupied apartments: 7,680
% of renters here:
49%
State:
33%
March 2022 cost of living index in zip code 33162: 104.5 (near average, U.S. average is 100)
Land area: 5.2 sq. mi. Water area: 0.1 sq. mi.
Population density: 9,565 people per square mile
(high).
OSM Map
General Map
Google Map
MSN Map
OSM Map
General Map
Google Map
MSN Map
OSM Map
General Map
Google Map
MSN Map
OSM Map
General Map
Google Map
MSN Map
Please wait while loading the map...
Real estate property taxes paid for housing units in 2022:
This zip code:
0.5% ($1,899)
Florida:
0.7% ($2,529)
Median real estate property taxes paid for housing units with mortgages in 2022: $2,029 (0.5%) Median real estate property taxes paid for housing units with no mortgage in 2022: $1,674 (0.5%)
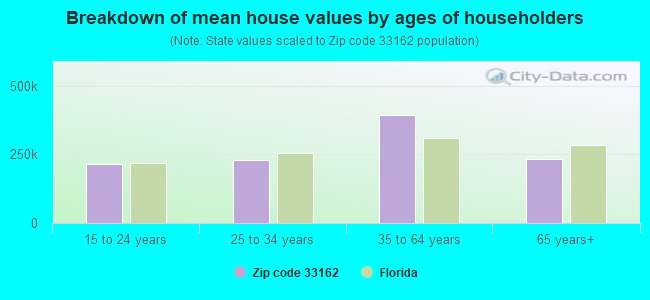
Estimated median house/condo value in 2022: $376,519
33162:
$376,519
Florida:
$354,100
According to our research of Florida and other state lists, there were 27 registered sex offenders living in 33162 zip code as of April 27, 2024. The ratio of all residents to sex offenders in zip code 33162 is 1,780 to 1. The ratio of registered sex offenders to all residents in this zip code is much lower than the state average.
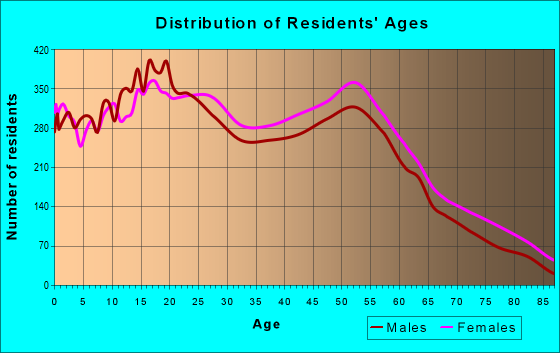
Median resident age:
This zip code:
36.4 years
Florida median age:
42.7 years
Average household size:
This zip code:
3.1 people
Florida:
2.5 people
Averages for the 2020 tax year for zip code 33162, filed in 2021:
Average Adjusted Gross Income (AGI) in 2020: $36,253 (Individual Income Tax Returns)
Here:
$36,253
State:
$82,200
Salary/wage: $33,620 (reported on 81.3% of returns)
Here:
$33,620
State:
$58,347
(% of AGI for various income ranges: 1291.1% for AGIs below $25k, 3634.2% for AGIs $25k-50k, 6805.9% for AGIs $50k-75k, 10091.0% for AGIs $75k-100k, 17459.2% for AGIs $100k-200k, 100297.5% for AGIs over 200k)
Taxable interest for individuals: $2,054 (reported on 10.3% of returns)
This zip code:
$2,054
Florida:
$4,272
(% of AGI for various income ranges: 5.0% for AGIs below $25k, 5.7% for AGIs $25k-50k, 13.8% for AGIs $50k-75k, 55.5% for AGIs $75k-100k, 167.5% for AGIs $100k-200k, 6792.5% for AGIs over 200k)
Ordinary dividends: $5,527 (reported on 5.9% of returns)
Here:
$5,527
State:
$15,863
(% of AGI for various income ranges: 5.2% for AGIs below $25k, 8.4% for AGIs $25k-50k, 40.6% for AGIs $50k-75k, 86.1% for AGIs $75k-100k, 281.5% for AGIs $100k-200k, 9977.5% for AGIs over 200k)
Net capital gain/loss in AGI: +$21,190 (reported on 6.8% of returns)
Here:
+$21,190
State:
+$62,983
(% of AGI for various income ranges: 4.0% for AGIs $25k-50k, 69.0% for AGIs $50k-75k, 185.2% for AGIs $75k-100k, 467.1% for AGIs $100k-200k, 72142.5% for AGIs over 200k)
Profit/loss from business: +$3,352 (reported on 35.9% of returns)
Here:
+$3,352
State:
+$9,719
(% of AGI for various income ranges: 158.4% for AGIs below $25k, 14.2% for AGIs $25k-50k, 193.8% for AGIs $50k-75k, 321.5% for AGIs $75k-100k, 383.8% for AGIs $100k-200k, 11680.0% for AGIs over 200k)
Taxable individual retirement arrangement distribution: $14,951 (reported on 1.9% of returns)
33162:
$14,951
Florida:
$24,823
(% of AGI for various income ranges: 8.6% for AGIs below $25k, 16.7% for AGIs $25k-50k, 55.9% for AGIs $50k-75k, 122.7% for AGIs $75k-100k, 384.8% for AGIs $100k-200k, 3410.0% for AGIs over 200k)
Total itemized deductions: $32,327 (reported on 4.9% of returns)
Here:
$32,327
State:
$45,393
(% of AGI for various income ranges: 28.1% for AGIs below $25k, 151.0% for AGIs $25k-50k, 413.3% for AGIs $50k-75k, 713.4% for AGIs $75k-100k, 1239.8% for AGIs $100k-200k, 19867.5% for AGIs over 200k)
Charity contributions: $11,982 (reported on 3.8% of returns)
Here:
$11,982
State:
$20,178
(% of AGI for various income ranges: 2.6% for AGIs below $25k, 27.6% for AGIs $25k-50k, 79.0% for AGIs $50k-75k, 171.0% for AGIs $75k-100k, 411.5% for AGIs $100k-200k, 10767.5% for AGIs over 200k)
Taxes paid: $5,996 (reported on 4.6% of returns)
33162:
$5,996
State:
$6,967
(% of AGI for various income ranges: 5.9% for AGIs below $25k, 31.8% for AGIs $25k-50k, 81.5% for AGIs $50k-75k, 136.3% for AGIs $75k-100k, 219.0% for AGIs $100k-200k, 1787.5% for AGIs over 200k)
Earned income credit: $2,406 (reported on 36.2% of returns)
Here:
$2,406
State:
$2,306
(% of AGI for various income ranges: 153.2% for AGIs below $25k, 97.3% for AGIs $25k-50k, 1.5% for AGIs $50k-75k)
Percentage of individuals using paid preparers for their 2020 taxes: 91.1%
Here:
91%
State:
92%
(% for various income ranges: 89.8% for AGIs below $25k, 93.3% for AGIs $25k-50k, 92.2% for AGIs $50k-75k, 90.3% for AGIs $75k-100k, 89.7% for AGIs $100k-200k, 91.3% for AGIs over 200k)
Averages for the 2012 tax year for zip code 33162, filed in 2013:
Average Adjusted Gross Income (AGI) in 2012: $27,259 (Individual Income Tax Returns)
Here:
$27,259
State:
$60,316
Salary/wage: $25,983 (reported on 83.1% of returns)
Here:
$25,983
State:
$45,277
(% of AGI for various income ranges: 81.1% for AGIs below $25k, 88.9% for AGIs $25k-50k, 86.3% for AGIs $50k-75k, 84.3% for AGIs $75k-100k, 75.6% for AGIs $100k-200k, 33.9% for AGIs over 200k)
Taxable interest for individuals: $1,959 (reported on 10.9% of returns)
This zip code:
$1,959
Florida:
$3,587
(% of AGI for various income ranges: 0.7% for AGIs below $25k, 0.7% for AGIs $25k-50k, 0.6% for AGIs $50k-75k, 0.5% for AGIs $75k-100k, 0.7% for AGIs $100k-200k, 1.8% for AGIs over 200k)
Ordinary dividends: $9,271 (reported on 6.8% of returns)
Here:
$9,271
State:
$12,831
(% of AGI for various income ranges: 2.1% for AGIs below $25k, 2.7% for AGIs $25k-50k, 2.0% for AGIs $50k-75k, 1.2% for AGIs $75k-100k, 1.3% for AGIs $100k-200k, 3.7% for AGIs over 200k)
Net capital gain/loss in AGI: +$14,295 (reported on 4.0% of returns)
Here:
+$14,295
State:
+$33,493
(% of AGI for various income ranges: 0.3% for AGIs $25k-50k, 0.5% for AGIs $50k-75k, 0.4% for AGIs $75k-100k, 1.1% for AGIs $100k-200k, 18.2% for AGIs over 200k)
Profit/loss from business: +$5,649 (reported on 23.0% of returns)
Here:
+$5,649
State:
+$10,012
(% of AGI for various income ranges: 11.5% for AGIs below $25k, 1.7% for AGIs $25k-50k, 1.0% for AGIs $50k-75k, 1.7% for AGIs $75k-100k, 2.6% for AGIs $100k-200k, 2.6% for AGIs over 200k)
Taxable individual retirement arrangement distribution: $9,992 (reported on 2.0% of returns)
33162:
$9,992
Florida:
$21,544
(% of AGI for various income ranges: 0.4% for AGIs below $25k, 0.4% for AGIs $25k-50k, 0.8% for AGIs $50k-75k, 1.3% for AGIs $75k-100k, 3.3% for AGIs $100k-200k)
Self-employment retirement plans: $10,700 (reported on 0.1% of returns)
33162:
$10,700
Florida:
$20,611
Total itemized deductions: $19,069 (31% of AGI, reported on 16.8% of returns)
Here:
$19,069
State:
$25,533
Here:
31.3% of AGI
State:
18.0% of AGI
(% of AGI for various income ranges: 6.2% for AGIs below $25k, 15.0% for AGIs $25k-50k, 16.1% for AGIs $50k-75k, 13.8% for AGIs $75k-100k, 13.2% for AGIs $100k-200k, 9.9% for AGIs over 200k)
Charity contributions: $3,796 (reported on 12.7% of returns)
Here:
$3,796
State:
$5,698
(% of AGI for various income ranges: 0.5% for AGIs below $25k, 1.8% for AGIs $25k-50k, 2.6% for AGIs $50k-75k, 2.7% for AGIs $75k-100k, 3.4% for AGIs $100k-200k, 2.5% for AGIs over 200k)
Taxes paid: $2,774 (reported on 15.2% of returns)
33162:
$2,774
State:
$6,203
(% of AGI for various income ranges: 0.6% for AGIs below $25k, 1.7% for AGIs $25k-50k, 2.3% for AGIs $50k-75k, 2.1% for AGIs $75k-100k, 2.4% for AGIs $100k-200k, 2.0% for AGIs over 200k)
Earned income credit: $2,550 (reported on 40.6% of returns)
Here:
$2,550
State:
$2,372
(% of AGI for various income ranges: 10.8% for AGIs below $25k, 1.7% for AGIs $25k-50k)
Percentage of individuals using paid preparers for their 2012 taxes: 69.5%
Here:
70%
State:
54%
(% for various income ranges: 69.0% for AGIs below $25k, 69.7% for AGIs $25k-50k, 70.1% for AGIs $50k-75k, 70.4% for AGIs $75k-100k, 76.2% for AGIs $100k-200k, 90.9% for AGIs over 200k)
Averages for the 2004 tax year for zip code 33162, filed in 2005:
Average Adjusted Gross Income (AGI) in 2004: $25,506 (Individual Income Tax Returns)
Here:
$25,506
State:
$50,523
Salary/wage: $25,141 (reported on 85.6% of returns)
Here:
$25,141
State:
$39,563
(% of AGI for various income ranges: 76.1% for AGIs below $10k, 86.3% for AGIs $10k-25k, 92.7% for AGIs $25k-50k, 88.4% for AGIs $50k-75k, 87.0% for AGIs $75k-100k, 57.6% for AGIs over 100k)
Taxable interest for individuals: $1,867 (reported on 18.6% of returns)
This zip code:
$1,867
Florida:
$3,211
(% of AGI for various income ranges: 1.9% for AGIs below $10k, 0.8% for AGIs $10k-25k, 0.7% for AGIs $25k-50k, 1.0% for AGIs $50k-75k, 1.0% for AGIs $75k-100k, 4.4% for AGIs over 100k)
Taxable dividends: $2,887 (reported on 6.8% of returns)
Here:
$2,887
State:
$6,129
(% of AGI for various income ranges: 1.4% for AGIs below $10k, 0.3% for AGIs $10k-25k, 0.3% for AGIs $25k-50k, 0.8% for AGIs $50k-75k, 0.5% for AGIs $75k-100k, 2.6% for AGIs over 100k)
Net capital gain/loss: +$8,053 (reported on 5.7% of returns)
Here:
+$8,053
State:
+$27,205
(% of AGI for various income ranges: -1.2% for AGIs below $10k, 0.1% for AGIs $10k-25k, 0.3% for AGIs $25k-50k, 1.8% for AGIs $50k-75k, 1.4% for AGIs $75k-100k, 10.0% for AGIs over 100k)
Profit/loss from business: +$7,379 (reported on 20.7% of returns)
Here:
+$7,379
State:
+$10,634
(% of AGI for various income ranges: 32.2% for AGIs below $10k, 10.0% for AGIs $10k-25k, 2.3% for AGIs $25k-50k, 1.6% for AGIs $50k-75k, 2.6% for AGIs $75k-100k, 4.5% for AGIs over 100k)
IRA payment deduction: $2,631 (reported on 1.4% of returns)
33162:
$2,631
Florida:
$3,082
(% of AGI for various income ranges: 0.2% for AGIs below $10k, 0.1% for AGIs $10k-25k, 0.2% for AGIs $25k-50k, 0.2% for AGIs $50k-75k, 0.2% for AGIs $75k-100k, 0.1% for AGIs over 100k)
Self-employed pension: $8,600 (reported on 0.1% of returns)
Here:
$8,600
Florida:
$15,857
Total itemized deductions: $16,209 (36% of AGI, reported on 26.7% of returns)
Here:
$16,209
State:
$20,370
Here:
36.1% of AGI
State:
20.7% of AGI
(% of AGI for various income ranges: 6.6% for AGIs below $10k, 12.3% for AGIs $10k-25k, 22.5% for AGIs $25k-50k, 20.3% for AGIs $50k-75k, 17.4% for AGIs $75k-100k, 12.8% for AGIs over 100k)
Charity contributions deductions: $3,084 (6% of AGI, reported on 22.4% of returns)
Here:
$3,084
State:
$4,064
Here:
6.5% of AGI
State:
3.8% of AGI
(% of AGI for various income ranges: 0.4% for AGIs below $10k, 1.3% for AGIs $10k-25k, 3.0% for AGIs $25k-50k, 3.5% for AGIs $50k-75k, 3.4% for AGIs $75k-100k, 4.4% for AGIs over 100k)
Total tax: $3,009 (reported on 58.2% of returns)
33162:
$3,009
State:
$9,431
(% of AGI for various income ranges: 5.4% for AGIs below $10k, 3.1% for AGIs $10k-25k, 4.4% for AGIs $25k-50k, 7.6% for AGIs $50k-75k, 9.8% for AGIs $75k-100k, 18.6% for AGIs over 100k)
Earned income credit: $2,041 (reported on 40.5% of returns)
Here:
$2,041
State:
$1,808
Percentage of individuals using paid preparers for their 2004 taxes: 68.4%
Here:
68%
State:
60%
(% for various income ranges: 66.9% for AGIs below $10k, 69.1% for AGIs $10k-25k, 68.7% for AGIs $25k-50k, 67.3% for AGIs $50k-75k, 68.2% for AGIs $75k-100k, 77.1% for AGIs over 100k)
Likely homosexual households (counted as self-reported same-sex unmarried-partner households)
Lesbian couples: 0.0% of all households
Gay men: 0.0% of all households
Household received Food Stamps/SNAP in the past 12 months: 3,913 Household did not receive Food Stamps/SNAP in the past 12 months: 11,779
Women who had a birth in the past 12 months: 741 (534 now married, 213 unmarried) Women who did not have a birth in the past 12 months: 11,067 (3,817 now married, 7,247 unmarried)
Housing units in zip code 33162 with a mortgage: 5,034 (232 second mortgage, 145 both second mortgage and home equity loan) Houses without a mortgage: 115
Median monthly owner costs for units with a mortgage: $1,704 Median monthly owner costs for units without a mortgage: $524
Residents with income below the poverty level in 2022:
This zip code:
14.9%
Whole state:
12.7%
Residents with income below 50% of the poverty level in 2022:
This zip code:
8.4%
Whole state:
6.6%
Median number of rooms in houses and condos:
Here:
5.1
State:
5.9
Median number of rooms in apartments:
Here:
3.6
State:
4.2
Notable locations in this zip code not listed on our city pages
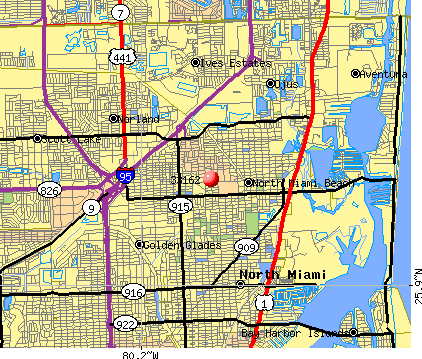
Notable locations in zip code 33162: Mall at 163rd Street (A), Briar Bay Convenience Center (B), Mall at 163rd Street (C), Watercrest Care Center (D), Sonia Garbutt Day Care Center (E), Small Fry Educational Center (F), North Miami Beach Library (G), North Miami Beach Police Station (H), North Miami Beach Presbyterian Church Day Care Center (I), McArthur Day Care Center (J), Hazel Crawford Day Care Center (K), Hebrew Home for the Aged - North Dade (L), Heritage Nursing and Rehabilitation Center (M), Fulford Christian Day Care (N), Brave Day Care Center (O), Azolina Young Family Day Care Center (P), Miami - Dade County Fire Rescue Station 31 (Q), Miami - Dade County Fire Rescue Station 32 (R), North Miami Beach Police Department - Neighborhood Resource Center (S). Display/hide their locations on the map
Parks in zip code 33162 include: Neal Park (1), Washington Park (2), Aqua Bowl Park (3), 19th Place Park (4), Allen Park (5), Oak Grove Park (6), Sauls Park (7), Snake Creek Park (8), Shenkenbeger Park (9). Display/hide their locations on the map
Tourist attraction (not listed on the city page) : A OK Travel- Inc (Tours & Charters; 633 Northeast 167th Street).
7,761 married couples with children.
2,732 single-parent households (836 men, 1,896 women).
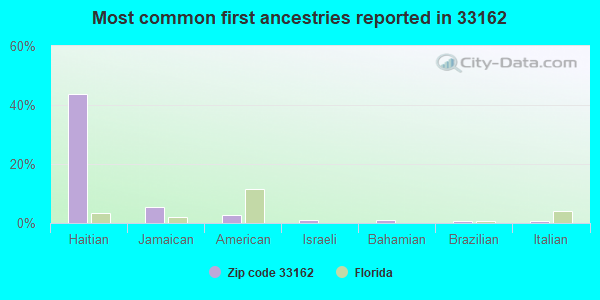
28.0% of residents of 33162 zip code speak English at home.
29.6% of residents speak Spanish at home (49% very well, 28% well, 13% not well, 9% not at all).
39.8% of residents speak other Indo-European language at home (64% very well, 24% well, 9% not well, 3% not at all).
2.5% of residents speak Asian or Pacific Island language at home (55% very well, 22% well, 18% not well, 5% not at all).
1.4% of residents speak other language at home (68% very well, 32% well).
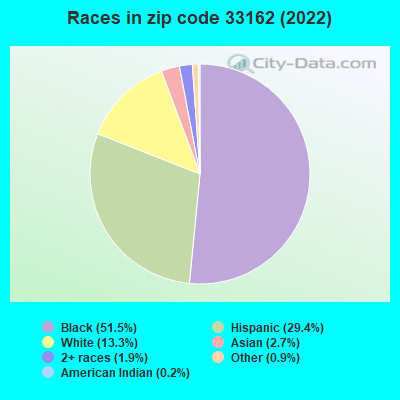
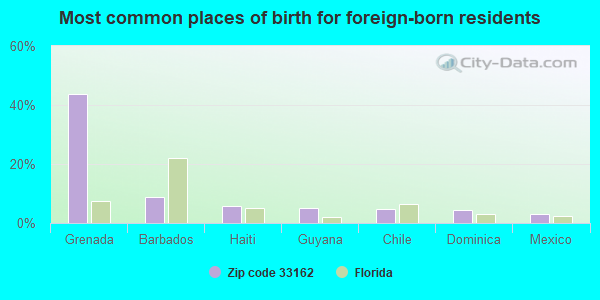
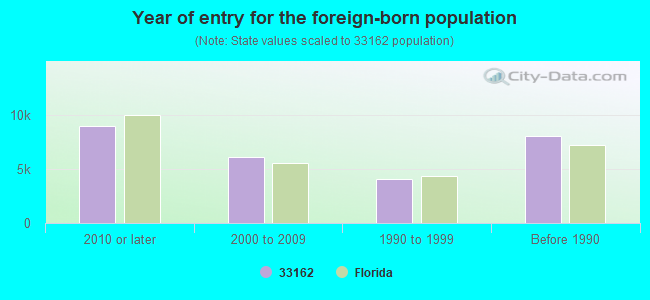
Foreign born population: 25,926 (52.2%) (60.0% of them are naturalized citizens)
Major facilities with environmental interests located in this zip code:
OAK GROVE ELEMENTARY SCHOOL (15640 N.E. 8TH AVENUE in NORTH MIAMI BEACH, FL)
(National Center for Education Statistics) - STATE ID-4021 Small Quantity Generators, between 100 kg and 1000 kg of hazardous waste/month (Resource Conservation and Recovery Act (tracking hazardous waste)) - notification Organizations: PAUL GREENFIELD, PRINCIPAL (CONTACT/OWNER)
, DADE COUNTY SCHOOL DISTRICT (SCHOOL DISTRICT)
Alternative names: DADE CO OAK GROVE ELEMENTARY
ASHLAND CHEMICAL INCORPORATED (200 NORTHEAST 181ST STREET in MIAMI, FL)
CRITERIA AND HAZARDOUS AIR POLLUTANT INVENTORY (Inventory of air pollution sources) HAZARDOUS WASTE BIENNIAL REPORTER (Resource Conservation and Recovery Act (tracking hazardous waste)) Large Quantity Generators, more that 1000 kg of hazardous waste/month (Resource Conservation and Recovery Act (tracking hazardous waste)) TSD (Resource Conservation and Recovery Act (tracking hazardous waste)) TRI REPORTER (Tracking of toxic chemicals releasing facilities) Business SIC classification: CHEMICALS AND ALLIED PRODUCTS Organizations: ASHLAND DISTRIBUTION CO. (CONTACT/OPERATOR)
, ASHLAND INC (CONTACT/OWNER)
Alternative names: ASHLAND DISTRIBUTION CO., ASHLAND DISTRIBUTION CO., ASHLAND INC.
NORTH MIAMI BEACH SENIOR HIGH SCHOOL (1247 N.E. 167TH STREET in NORTH MIAMI BEACH, FL)
(Geographic Names Information System) (National Center for Education Statistics) - STATE ID-7541 Organizations: DADE COUNTY SCHOOL DISTRICT (SCHOOL DISTRICT)
GERTRUDE K. EDLEMAN/SABAL PALM ELEMENTARY SCHOOL ( (17101 N.E. 7TH AVENUE in NORTH MIAMI BEACH, FL)
(National Center for Education Statistics) - STATE ID-4801 Organizations: DADE COUNTY SCHOOL DISTRICT (SCHOOL DISTRICT)
GREYNOLDS PARK ELEMENTARY SCHOOL (1536 N.E. 179TH STREET in NORTH MIAMI BEACH, FL)
(National Center for Education Statistics) - STATE ID-2281 Organizations: DADE COUNTY SCHOOL DISTRICT (SCHOOL DISTRICT)
JOHN F. KENNEDY MIDDLE SCHOOL (1075 N.E. 167TH STREET in NORTH MIAMI BEACH, FL)
(National Center for Education Statistics) - STATE ID-6301 Organizations: DADE COUNTY SCHOOL DISTRICT (SCHOOL DISTRICT)
NORTHEAST ACADEMY (FORMERLY NOV (1750 NE 168TH STREET in NORTH MIAMI BEACH, FL)
(National Center for Education Statistics) - STATE ID-0120 Organizations: DADE COUNTY SCHOOL DISTRICT (SCHOOL DISTRICT)
BISCAYNE COMMONS (BISCAYNE BLVD APPROXIMATELY 60 in NORTH MIAMI BEACH, FL)
National Pollutant Discharge Elimination System NON-MAJOR (Tracking pollutant discharge elimination systems) - permit Organizations: IRWIN TAUBER (CONTACT/OWNER)
ARNOLDS PAINT & BODY INC (1919 NE 153RD ST in MIAMI, FL)
(Resource Conservation and Recovery Act (tracking hazardous waste)) Organizations: KARL ECKARDT (CONTACT/OWNER)
GREAT SOUTHERN STUDIOS (15221 NE 21 AVE in MIAMI, FL)
(Resource Conservation and Recovery Act (tracking hazardous waste)) Organizations: NON NOTIFIER (CONTACT/OWNER)
HANFORD BLVD DRAINAGE IMPROVEM (NE 164TH ST in NORTH MIAMI BEACH, FL)
National Pollutant Discharge Elimination System NON-MAJOR (Tracking pollutant discharge elimination systems) - permit Organizations: ED DOMINGUEZ (CONTACT/OWNER)
MALL @ 163RD STREET (1421 N.E. 163RD STREET in NORTH MIAMI BEACH, FL)
National Pollutant Discharge Elimination System NON-MAJOR (Tracking pollutant discharge elimination systems) - permit Organizations: THOMAS MULKEY (CONTACT/OWNER)
CUTE SHOTS INC (1731 NE 163RD ST in NORTH MIAMI BEACH, FL)
(Resource Conservation and Recovery Act (tracking hazardous waste)) Organizations: STELLA VAN (CONTACT/OWNER)
Housing units lacking complete plumbing facilities: 0.7% Housing units lacking complete kitchen facilities: 1.2%
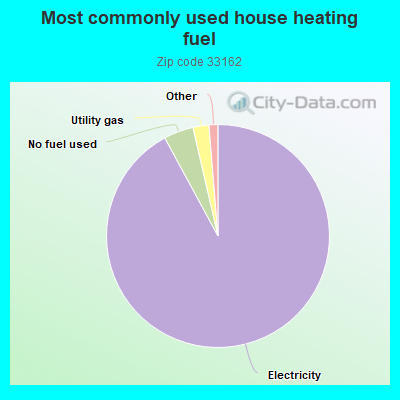
92.0%Electricity
4.3%No fuel used
2.3%Utility gas
0.7%Bottled, tank, or LP gas
0.6%Other fuel
Population in 1990: 37,052. Population change in the 1990s: +8,172 (+22.1%).
Place of birth for U.S.-born residents:
This state: 17,927
Northeast: 3,067
Midwest: 431
South: 727
West: 348
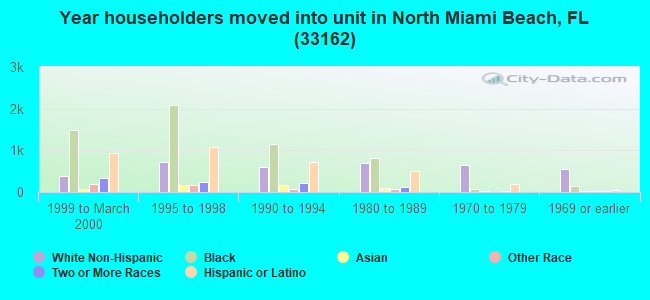
59% of the 33162 zip code residents lived in the same house 5 years ago. Out of people who lived in different houses, 82% lived in this county. Out of people who lived in different counties, 50% lived in Florida.
93% of the 33162 zip code residents lived in the same house 1 year ago. Out of people who lived in different houses, 52% moved from this county. Out of people who lived in different houses, 17% moved from different county within same state. Out of people who lived in different houses, 12% moved from different state. Out of people who lived in different houses, 25% moved from abroad.
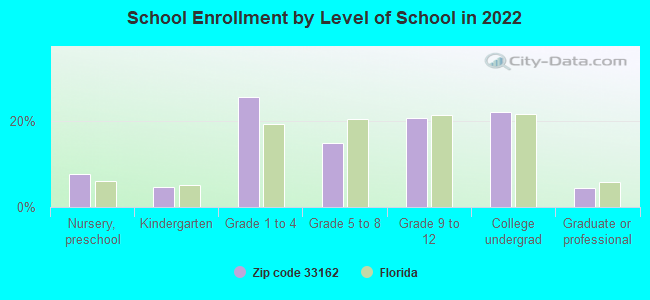
Private vs. public school enrollment:
Students in private schools in grades 1 to 8 (elementary and middle school): 1,067
Here:
18.8%
Florida:
15.8%
Students in private schools in grades 9 to 12 (high school): 315
Here:
10.8%
Florida:
12.9%
Students in private undergraduate colleges: 751
Here:
24.1%
Florida:
23.6%
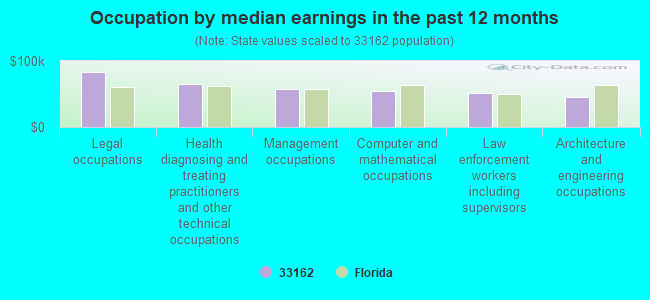
Occupation by median earnings in the past 12 months ($)
82,912Legal occupations
65,094Health diagnosing and treating practitioners and other technical occupations
56,879Management occupations
54,991Computer and mathematical occupations
51,392Law enforcement workers including supervisors
46,136Architecture and engineering occupations
Companies with federal contracts located in this zip code:
SOLO CONSTRUCTION CORP. (15251 NE 18TH AVENUE, SUIT in MIAMI, FL; small business) : $935,647 in 10 contractsfrom 2000 to 2005
Contracts for Maintenance, Repair or Alteration of Real Property -- Miscellaneous Buildings, Maintenance, Repair or Alteration of Real Property -- Sewage and Waste Facilities by Air Force Signed by year:2000: $515,000; 2001: $344,739; 2002: $0; 2003: $18,000; 2004: $30,208; 2005: $27,700; 2006: $0.
Biggest contracts:
$490,000 with Air Force for Maintenance, Repair or Alteration of Real Property -- Miscellaneous Buildings. Signed on 2000-09-30. Completion date: 2000-12-30.
$314,739, same as above.Signed on 2001-09-28. Completion date: 2001-09-28.
$28,000, same as above.Signed on 2001-05-17. Completion date: 2001-06-15.
$25,700, same as above.Signed on 2005-07-29. Completion date: 2005-09-01.
EXPRESSIONS UNLIMITED IN LANGU (16791 NE 20TH AVENUE in MIAMI, FL) : $124,415 in 11 contractsfrom 2003 to 2004
Contracts for Translation and Interpreting Services(Including Sign Language), ADP Components, Other Professional Services by Army, Navy Signed by year:2000: $0; 2001: $0; 2002: $0; 2003: $16,511; 2004: $107,904; 2005: $0; 2006: $0.
Biggest contracts:
$37,342 with Army for Translation and Interpreting Services(Including Sign Language). Taking place in TX. Signed on 2004-05-06. Completion date: 2004-06-25.
$29,095 with Navy for Translation and Interpreting Services(Including Sign Language). Taking place in CA. Signed on 2004-04-26. Completion date: 2004-05-06.
$27,847 with Army for ADP Components. Taking place in AZ. Signed on 2004-08-13. Completion date: 2004-08-22.
$16,511 with Army for Other Professional Services. Taking place in GA. Signed on 2003-05-01. Completion date: 2003-05-22.
FREISTAT & LIEBMAN (16211 NE 18TH AVE in MIAMI, FL; small business)
$58,240 with Navy for Dentistry Services. Taking place in IL. Signed on 2000-02-16. Completion date: 2000-09-30.
AUDIO ONE SOUND & VIDEO CORP (1926 NE 154TH ST in MIAMI, FL; small business) : $6,394 in 2 contractsin 2005
$4,174 with Navy for Training Aids. Signed on 2005-06-30. Completion date: 2005-07-25.
$2,220 with Navy for Miscellaneous Items. Taking place in SC. Signed on 2005-03-31. Completion date: 2005-04-15.
OWL AEROSPACE, INC (15421 W DIXIE HWY , BAY # in NORTH MIAMI BE, FL; small business)
$100 with Navy for Fastening Device. Signed on 2005-01-24. Completion date: 2005-01-28.
Top industries in this zip code by the number of employees in 2005:
Educational Services: Colleges, Universities, and Professional Schools (500-999 employees: 1 establishment, 20-49 employees: 1 establishment)
Wholesale Trade: Electrical Apparatus and Equipment, Wiring Supplies, and Related Equipment Merchant Wholesalers (250-499: 1, 5-9: 1, 1-4: 1)
Professional, Scientific, and Technical Services: Offices of Lawyers (10-19: 4, 5-9: 15, 1-4: 60)
Health Care and Social Assistance: Offices of Physicians (except Mental Health Specialists) (10-19: 6, 5-9: 11, 1-4: 33)
Administrative and Support and Waste Management and Remediation Services: Security Guards and Patrol Services (100-249: 1, 20-49: 1, 10-19: 1, 5-9: 1, 1-4: 1)
2008 - 2018 National Fire Incident Reporting System (NFIRS) incidents
Based on the data from the years 2008 - 2018 the average number of fires per year is 83. The highest number of fire incidents - 108 took place in 2009, and the least - 50 in 2015. The data has a decreasing trend.
When looking into fire subcategories, the most incidents belonged to: Outside Fires (35.1%), and Structure Fires (34.1%).
Fire incident types reported to NFIRS in Zip Code 33162
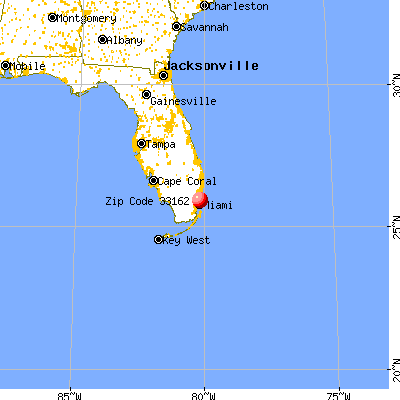


 Nearest zip codes: 33179, 33161, 33181, 33169, 33160, 33180.
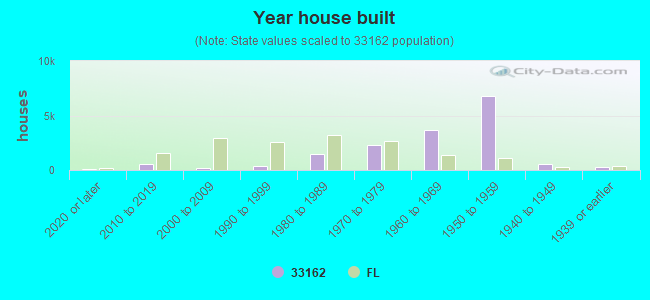


 Based on the data from the years 2008 - 2018 the average number of fires per year is 83. The highest number of fire incidents - 108 took place in 2009, and the least - 50 in 2015. The data has a decreasing trend.
 When looking into fire subcategories, the most incidents belonged to: Outside Fires (35.1%), and Structure Fires (34.1%).