Estimated zip code population in 2022: 43,244 Zip code population in 2010: 40,053 Zip code population in 2000: 33,833
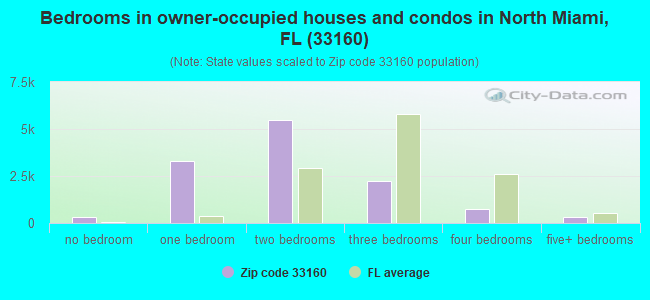
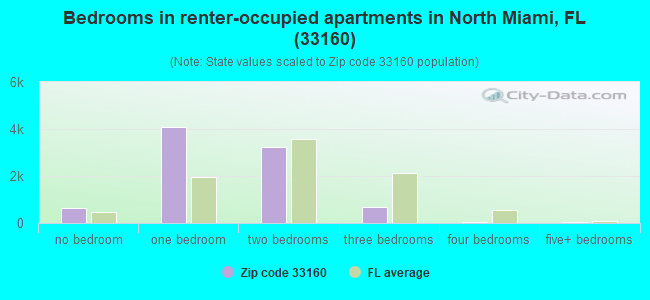
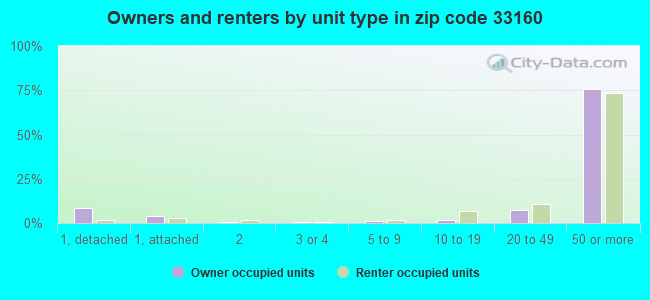
Houses and condos: 36,461 Renter-occupied apartments: 8,676
% of renters here:
41%
State:
33%
March 2022 cost of living index in zip code 33160: 105.6 (more than average, U.S. average is 100)
Land area: 4.2 sq. mi. Water area: 3.2 sq. mi.
Population density: 10,177 people per square mile
(high).
OSM Map
General Map
Google Map
MSN Map
OSM Map
General Map
Google Map
MSN Map
OSM Map
General Map
Google Map
MSN Map
OSM Map
General Map
Google Map
MSN Map
Please wait while loading the map...
Real estate property taxes paid for housing units in 2022:
This zip code:
0.9% ($3,405)
Florida:
0.7% ($2,529)
Median real estate property taxes paid for housing units with mortgages in 2022: $3,588 (1.1%) Median real estate property taxes paid for housing units with no mortgage in 2022: $3,281 (0.7%)
Estimated median house/condo value in 2022: $392,758
33160:
$392,758
Florida:
$354,100
According to our research of Florida and other state lists, there were 12 registered sex offenders living in 33160 zip code as of April 27, 2024. The ratio of all residents to sex offenders in zip code 33160 is 3,361 to 1. The ratio of registered sex offenders to all residents in this zip code is much lower than the state average.
Median resident age:
This zip code:
50.7 years
Florida median age:
42.7 years
Average household size:
This zip code:
2.1 people
Florida:
2.5 people
Averages for the 2020 tax year for zip code 33160, filed in 2021:
Average Adjusted Gross Income (AGI) in 2020: $205,670 (Individual Income Tax Returns)
Here:
$205,670
State:
$82,200
Salary/wage: $103,655 (reported on 62.9% of returns)
Here:
$103,655
State:
$58,347
(% of AGI for various income ranges: 1046.5% for AGIs below $25k, 3528.6% for AGIs $25k-50k, 7270.8% for AGIs $50k-75k, 10935.6% for AGIs $75k-100k, 20263.9% for AGIs $100k-200k, 236154.2% for AGIs over 200k)
Taxable interest for individuals: $20,400 (reported on 31.1% of returns)
This zip code:
$20,400
Florida:
$4,272
(% of AGI for various income ranges: 48.1% for AGIs below $25k, 118.7% for AGIs $25k-50k, 218.4% for AGIs $50k-75k, 414.2% for AGIs $75k-100k, 1341.6% for AGIs $100k-200k, 30260.3% for AGIs over 200k)
Ordinary dividends: $46,034 (reported on 23.7% of returns)
Here:
$46,034
State:
$15,863
(% of AGI for various income ranges: 56.1% for AGIs below $25k, 134.9% for AGIs $25k-50k, 302.8% for AGIs $50k-75k, 527.3% for AGIs $75k-100k, 2004.7% for AGIs $100k-200k, 54415.8% for AGIs over 200k)
Net capital gain/loss in AGI: +$257,464 (reported on 26.7% of returns)
Here:
+$257,464
State:
+$62,983
(% of AGI for various income ranges: 32.0% for AGIs below $25k, 108.2% for AGIs $25k-50k, 332.0% for AGIs $50k-75k, 793.6% for AGIs $75k-100k, 2615.6% for AGIs $100k-200k, 388688.9% for AGIs over 200k)
Profit/loss from business: +$17,450 (reported on 36.6% of returns)
Here:
+$17,450
State:
+$9,719
(% of AGI for various income ranges: 522.0% for AGIs below $25k, 503.9% for AGIs $25k-50k, 570.5% for AGIs $50k-75k, 804.0% for AGIs $75k-100k, 1516.1% for AGIs $100k-200k, 18650.0% for AGIs over 200k)
Taxable individual retirement arrangement distribution: $36,502 (reported on 6.5% of returns)
33160:
$36,502
Florida:
$24,823
(% of AGI for various income ranges: 50.8% for AGIs below $25k, 73.0% for AGIs $25k-50k, 210.3% for AGIs $50k-75k, 346.2% for AGIs $75k-100k, 1327.3% for AGIs $100k-200k, 7817.6% for AGIs over 200k)
Self-employed (Keogh) retirement plans: $33,676 (reported on 0.8% of returns)
33160:
$33,676
Florida:
$29,694
(% of AGI for various income ranges: 8.2% for AGIs $25k-50k, 59.9% for AGIs $100k-200k, 1299.5% for AGIs over 200k)
Total itemized deductions: $115,774 (reported on 10.5% of returns)
Here:
$115,774
State:
$45,393
(% of AGI for various income ranges: 77.5% for AGIs below $25k, 196.5% for AGIs $25k-50k, 483.6% for AGIs $50k-75k, 730.4% for AGIs $75k-100k, 1917.9% for AGIs $100k-200k, 60146.6% for AGIs over 200k)
Charity contributions: $40,572 (reported on 8.4% of returns)
Here:
$40,572
State:
$20,178
(% of AGI for various income ranges: 4.0% for AGIs below $25k, 24.5% for AGIs $25k-50k, 74.6% for AGIs $50k-75k, 107.9% for AGIs $75k-100k, 315.5% for AGIs $100k-200k, 18348.4% for AGIs over 200k)
Taxes paid: $7,875 (reported on 10.4% of returns)
33160:
$7,875
State:
$6,967
(% of AGI for various income ranges: 15.8% for AGIs below $25k, 41.5% for AGIs $25k-50k, 101.1% for AGIs $50k-75k, 148.5% for AGIs $75k-100k, 407.5% for AGIs $100k-200k, 2517.6% for AGIs over 200k)
Earned income credit: $1,873 (reported on 19.0% of returns)
Here:
$1,873
State:
$2,306
(% of AGI for various income ranges: 110.5% for AGIs below $25k, 75.3% for AGIs $25k-50k, 0.9% for AGIs $50k-75k)
Percentage of individuals using paid preparers for their 2020 taxes: 89.9%
Here:
90%
State:
92%
(% for various income ranges: 88.2% for AGIs below $25k, 90.4% for AGIs $25k-50k, 90.6% for AGIs $50k-75k, 91.0% for AGIs $75k-100k, 90.6% for AGIs $100k-200k, 93.1% for AGIs over 200k)
Averages for the 2012 tax year for zip code 33160, filed in 2013:
Average Adjusted Gross Income (AGI) in 2012: $119,634 (Individual Income Tax Returns)
Here:
$119,634
State:
$60,316
Salary/wage: $60,451 (reported on 68.1% of returns)
Here:
$60,451
State:
$45,277
(% of AGI for various income ranges: 62.8% for AGIs below $25k, 75.4% for AGIs $25k-50k, 71.1% for AGIs $50k-75k, 68.7% for AGIs $75k-100k, 55.8% for AGIs $100k-200k, 20.2% for AGIs over 200k)
Taxable interest for individuals: $12,046 (reported on 32.8% of returns)
This zip code:
$12,046
Florida:
$3,587
(% of AGI for various income ranges: 3.3% for AGIs below $25k, 2.1% for AGIs $25k-50k, 2.8% for AGIs $50k-75k, 3.2% for AGIs $75k-100k, 4.7% for AGIs $100k-200k, 3.3% for AGIs over 200k)
Ordinary dividends: $46,450 (reported on 21.1% of returns)
Here:
$46,450
State:
$12,831
(% of AGI for various income ranges: 4.3% for AGIs below $25k, 3.0% for AGIs $25k-50k, 3.9% for AGIs $50k-75k, 4.5% for AGIs $75k-100k, 5.7% for AGIs $100k-200k, 9.9% for AGIs over 200k)
Net capital gain/loss in AGI: +$122,149 (reported on 21.6% of returns)
Here:
+$122,149
State:
+$33,493
(% of AGI for various income ranges: 0.7% for AGIs $25k-50k, 1.6% for AGIs $50k-75k, 2.4% for AGIs $75k-100k, 5.5% for AGIs $100k-200k, 30.9% for AGIs over 200k)
Profit/loss from business: +$16,455 (reported on 27.9% of returns)
Here:
+$16,455
State:
+$10,012
(% of AGI for various income ranges: 21.6% for AGIs below $25k, 5.8% for AGIs $25k-50k, 3.5% for AGIs $50k-75k, 3.5% for AGIs $75k-100k, 4.8% for AGIs $100k-200k, 2.4% for AGIs over 200k)
Taxable individual retirement arrangement distribution: $32,267 (reported on 8.7% of returns)
33160:
$32,267
Florida:
$21,544
(% of AGI for various income ranges: 2.5% for AGIs below $25k, 1.9% for AGIs $25k-50k, 2.4% for AGIs $50k-75k, 3.3% for AGIs $75k-100k, 5.7% for AGIs $100k-200k, 1.9% for AGIs over 200k)
Self-employment retirement plans: $21,550 (reported on 0.7% of returns)
33160:
$21,550
Florida:
$20,611
(% of AGI for various income ranges: 0.1% for AGIs $25k-50k, 0.2% for AGIs $50k-75k, 0.2% for AGIs $100k-200k, 0.1% for AGIs over 200k)
Total itemized deductions: $43,210 (13% of AGI, reported on 29.0% of returns)
Here:
$43,210
State:
$25,533
Here:
13.3% of AGI
State:
18.0% of AGI
(% of AGI for various income ranges: 12.6% for AGIs below $25k, 13.4% for AGIs $25k-50k, 15.1% for AGIs $50k-75k, 14.4% for AGIs $75k-100k, 16.3% for AGIs $100k-200k, 8.6% for AGIs over 200k)
Charity contributions: $8,974 (reported on 22.6% of returns)
Here:
$8,974
State:
$5,698
(% of AGI for various income ranges: 0.7% for AGIs below $25k, 1.2% for AGIs $25k-50k, 1.4% for AGIs $50k-75k, 1.4% for AGIs $75k-100k, 2.0% for AGIs $100k-200k, 1.8% for AGIs over 200k)
Taxes paid: $13,040 (reported on 28.0% of returns)
33160:
$13,040
State:
$6,203
(% of AGI for various income ranges: 2.4% for AGIs below $25k, 2.6% for AGIs $25k-50k, 3.3% for AGIs $50k-75k, 3.5% for AGIs $75k-100k, 5.0% for AGIs $100k-200k, 2.8% for AGIs over 200k)
Earned income credit: $1,995 (reported on 20.6% of returns)
Here:
$1,995
State:
$2,372
(% of AGI for various income ranges: 6.5% for AGIs below $25k, 0.8% for AGIs $25k-50k)
Percentage of individuals using paid preparers for their 2012 taxes: 73.0%
Here:
73%
State:
54%
(% for various income ranges: 70.9% for AGIs below $25k, 69.7% for AGIs $25k-50k, 71.9% for AGIs $50k-75k, 74.2% for AGIs $75k-100k, 79.9% for AGIs $100k-200k, 91.2% for AGIs over 200k)
Averages for the 2004 tax year for zip code 33160, filed in 2005:
Average Adjusted Gross Income (AGI) in 2004: $71,393 (Individual Income Tax Returns)
Here:
$71,393
State:
$50,523
Salary/wage: $47,916 (reported on 68.2% of returns)
Here:
$47,916
State:
$39,563
(% of AGI for various income ranges: 64.1% for AGIs $10k-25k, 76.5% for AGIs $25k-50k, 67.9% for AGIs $50k-75k, 63.7% for AGIs $75k-100k, 31.1% for AGIs over 100k)
Taxable interest for individuals: $7,892 (reported on 46.7% of returns)
This zip code:
$7,892
Florida:
$3,211
(% of AGI for various income ranges: 7.7% for AGIs $10k-25k, 4.5% for AGIs $25k-50k, 5.4% for AGIs $50k-75k, 6.7% for AGIs $75k-100k, 4.3% for AGIs over 100k)
Taxable dividends: $10,782 (reported on 27.6% of returns)
Here:
$10,782
State:
$6,129
(% of AGI for various income ranges: 4.3% for AGIs $10k-25k, 2.8% for AGIs $25k-50k, 3.5% for AGIs $50k-75k, 4.0% for AGIs $75k-100k, 4.0% for AGIs over 100k)
Net capital gain/loss: +$48,638 (reported on 28.4% of returns)
Here:
+$48,638
State:
+$27,205
(% of AGI for various income ranges: -0.1% for AGIs $10k-25k, 1.1% for AGIs $25k-50k, 2.5% for AGIs $50k-75k, 4.1% for AGIs $75k-100k, 27.5% for AGIs over 100k)
Profit/loss from business: +$14,027 (reported on 23.3% of returns)
Here:
+$14,027
State:
+$10,634
(% of AGI for various income ranges: 13.3% for AGIs $10k-25k, 4.8% for AGIs $25k-50k, 3.9% for AGIs $50k-75k, 4.8% for AGIs $75k-100k, 3.1% for AGIs over 100k)
IRA payment deduction: $3,529 (reported on 3.1% of returns)
33160:
$3,529
Florida:
$3,082
(% of AGI for various income ranges: 0.2% for AGIs $10k-25k, 0.3% for AGIs $25k-50k, 0.2% for AGIs $50k-75k, 0.2% for AGIs $75k-100k, 0.1% for AGIs over 100k)
Self-employed pension: $18,000 (reported on 0.7% of returns)
Here:
$18,000
Florida:
$15,857
(% of AGI for various income ranges: 0.1% for AGIs $10k-25k, 0.1% for AGIs $50k-75k, 0.2% for AGIs $75k-100k, 0.2% for AGIs over 100k)
Total itemized deductions: $25,911 (19% of AGI, reported on 36.2% of returns)
Here:
$25,911
State:
$20,370
Here:
19.3% of AGI
State:
20.7% of AGI
(% of AGI for various income ranges: 24.6% for AGIs $10k-25k, 19.1% for AGIs $25k-50k, 18.7% for AGIs $50k-75k, 17.9% for AGIs $75k-100k, 9.1% for AGIs over 100k)
Charity contributions deductions: $4,369 (3% of AGI, reported on 29.5% of returns)
Here:
$4,369
State:
$4,064
Here:
2.9% of AGI
State:
3.8% of AGI
(% of AGI for various income ranges: 1.3% for AGIs $10k-25k, 1.7% for AGIs $25k-50k, 1.7% for AGIs $50k-75k, 1.9% for AGIs $75k-100k, 1.8% for AGIs over 100k)
Total tax: $17,583 (reported on 75.2% of returns)
33160:
$17,583
State:
$9,431
(% of AGI for various income ranges: 4.7% for AGIs $10k-25k, 7.2% for AGIs $25k-50k, 10.7% for AGIs $50k-75k, 12.5% for AGIs $75k-100k, 22.9% for AGIs over 100k)
Earned income credit: $1,474 (reported on 15.5% of returns)
Here:
$1,474
State:
$1,808
Percentage of individuals using paid preparers for their 2004 taxes: 74.3%
Here:
74%
State:
60%
(% for various income ranges: 73.6% for AGIs below $10k, 74.1% for AGIs $10k-25k, 70.6% for AGIs $25k-50k, 72.3% for AGIs $50k-75k, 75.8% for AGIs $75k-100k, 85.6% for AGIs over 100k)
Likely homosexual households (counted as self-reported same-sex unmarried-partner households)
Lesbian couples: 0.1% of all households
Gay men: 0.4% of all households
Household received Food Stamps/SNAP in the past 12 months: 1,419 Household did not receive Food Stamps/SNAP in the past 12 months: 19,743
Women who had a birth in the past 12 months: 520 (430 now married, 101 unmarried) Women who did not have a birth in the past 12 months: 7,744 (3,191 now married, 4,552 unmarried)
Housing units in zip code 33160 with a mortgage: 5,072 (387 second mortgage, 14 home equity loan, 312 both second mortgage and home equity loan) Houses without a mortgage: 63
Median monthly owner costs for units with a mortgage: $2,290 Median monthly owner costs for units without a mortgage: $1,090
Residents with income below the poverty level in 2022:
This zip code:
13.1%
Whole state:
12.7%
Residents with income below 50% of the poverty level in 2022:
This zip code:
6.7%
Whole state:
6.6%
Median number of rooms in houses and condos:
Here:
4.0
State:
5.9
Median number of rooms in apartments:
Here:
3.4
State:
4.2
Notable locations in this zip code not listed on our city pages
Notable locations in zip code 33160: R K Sunny Isles Plaza (A), North Miami Athletic Stadium (B), Trump International Golf Club (C), Greynolds Park Golf Course (D), Maule Lake Marina (E), Sunny Isles Marina (F), Sunny Isle Fishing Pier (G), Causeway Plaza (H), Shoprite Center (I), Causeway Square (J), Tiny Town Development Center (K), Sunny Isles Beach Police Station (L), Golden Beach City Hall (M), Golden Beach Police Station (N), Greynolds Park Manor Rehabilitation Center (O), Aventura Fire Station (P), Aventura Learning Center (Q), Miami - Dade County Fire Rescue Station 10 (R), Miami - Dade County Fire Rescue Station 21 (S), Miami - Dade County Fire Rescue Station 22 (T). Display/hide their locations on the map
Churches in zip code 33160 include: Saint Bernard de Clairvaux Episcopal Church (A), Temple Bnai Zion (B), Saint Mary Magdalen Church (C). Display/hide their locations on the map
Parks in zip code 33160 include: East Greynolds Park (1), Sunny Isles Beach Park (2), Oleta River State Park (3), Snyder Tennis Complex (4), South Park (5), Loggia Beach Park (6), Haulover Beach Park (7). Display/hide their locations on the map
4,720 married couples with children.
1,663 single-parent households (240 men, 1,423 women).
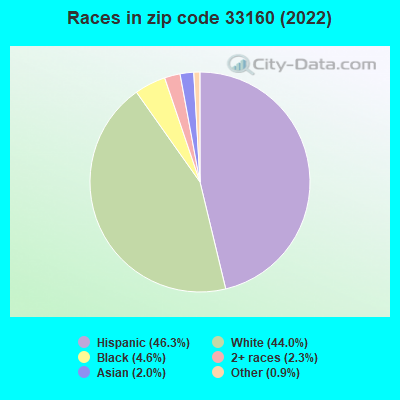
29.2% of residents of 33160 zip code speak English at home.
46.2% of residents speak Spanish at home (54% very well, 29% well, 12% not well, 5% not at all).
22.2% of residents speak other Indo-European language at home (56% very well, 32% well, 11% not well, 1% not at all).
0.8% of residents speak Asian or Pacific Island language at home (59% very well, 26% well, 8% not well, 7% not at all).
2.5% of residents speak other language at home (80% very well, 17% well, 3% not well).
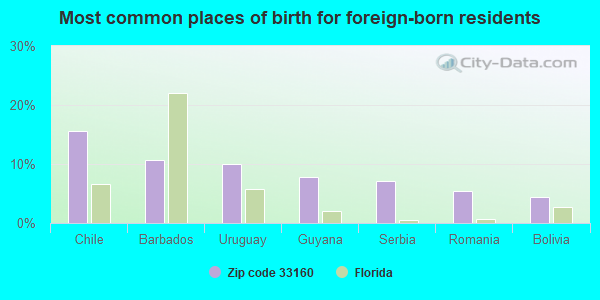
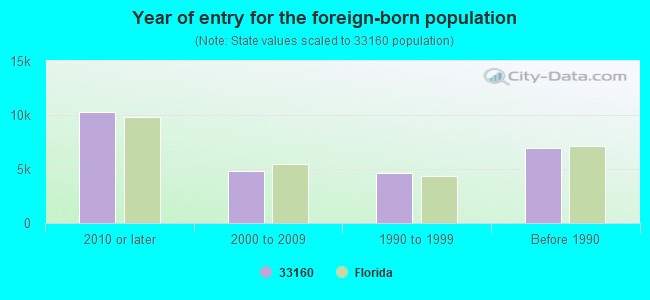
Foreign born population: 25,567 (59.1%) (62.8% of them are naturalized citizens)
This zip code:
59.1%
Whole state:
21.7%
16%Chile
11%Barbados
10%Uruguay
8%Guyana
7%Serbia
5%Romania
4%Bolivia
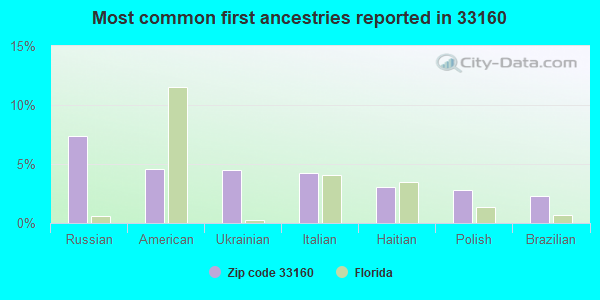
7%Russian
5%American
4%Ukrainian
4%Italian
3%Haitian
3%Polish
2%Brazilian
Year of entry for the foreign-born population
10,2582010 or later
4,8082000 to 2009
4,6461990 to 1999
6,954Before 1990
Major facilities with environmental interests located in this zip code:
L&S AUTO SERVICE INC (18310 W DIXIE HWY in MIAMI, FL)
AIR MINOR (AIRS/AFS) (Integrated Compliance Information System) - ICIS-04-2000-0012, FORMAL ENFORCEMENT ACTION Small Quantity Generators, between 100 kg and 1000 kg of hazardous waste/month (Resource Conservation and Recovery Act (tracking hazardous waste)) - notification Business SIC classification: GENERAL AUTOMOTIVE REPAIR SHOPS Organizations: RODRIGUEZ, JOSE L (CONTACT/OWNER)
Alternative names: RODEZ SERVICE
CIGARETTE RACING TEAM LLC (3131 NORTHEAST 188TH STREET in MIAMI, FL)
AIR MAJOR (AIRS/AFS) National Pollutant Discharge Elimination System NON-MAJOR (Tracking pollutant discharge elimination systems) - permit Large Quantity Generators, more that 1000 kg of hazardous waste/month (Resource Conservation and Recovery Act (tracking hazardous waste)) TRI REPORTER (Tracking of toxic chemicals releasing facilities) Business SIC classification: SHIP BUILDING AND REPAIRING; BOAT BUILDING AND REPAIRING Organizations: JIM CLAVIJO (CONTACT/OPERATOR)
, NEILL HERNANDEZ (CONTACT/OWNER)
, SKIP BRAVER (CONTACT/OWNER)
Alternative names: CIGARETTE RACING TEAM INC, CIGARETTE RACING TEAMS INC
CROWN LAUNDRY & CLEANERS (2025 NORTHEAST 163 STREET in NORTH MIAMI BEACH, FL)
AIR MINOR (AIRS/AFS) Small Quantity Generators, between 100 kg and 1000 kg of hazardous waste/month (Resource Conservation and Recovery Act (tracking hazardous waste)) - notification Business SIC classification: DRYCLEANING PLANTS, EXCEPT RUG CLEANING Organizations: MARVIN SHANKIN, PRESIDENT (CONTACT/OWNER)
Alternative names: NORTH MIAMI BEACH CLEANING AND LAUNDRY C
COUNTRY CLUB CLEANERS INC (749 NE 167 ST in NORTH MIAMI BEACH, FL)
AIR MINOR (AIRS/AFS) (Resource Conservation and Recovery Act (tracking hazardous waste)) Business SIC classification: DRYCLEANING PLANTS, EXCEPT RUG CLEANING Organizations: AKBERALI M DHAYA (CONTACT/OWNER)
Alternative names: CLOVER CLEANER
SKYLAKE WASHBOWL,1989, INC (1820 NE 185TH STREET in NORTH MIAMI BEACH, FL)
AIR MINOR (AIRS/AFS) (Resource Conservation and Recovery Act (tracking hazardous waste)) Business SIC classification: DRYCLEANING PLANTS, EXCEPT RUG CLEANING Organizations: MARK BENGHIAT, MGR (CONTACT/OWNER)
Alternative names: SKYLAKE WASHBOWL INC
ALIA CLEANERS INC (16990 NE 19TH AVENUE in NORTH MIAMI BEACH, FL)
AIR MINOR (AIRS/AFS) Small Quantity Generators, between 100 kg and 1000 kg of hazardous waste/month (Resource Conservation and Recovery Act (tracking hazardous waste)) - notification TARGETED BROWNFIELDS ASSESSMENT (TBA) Business SIC classification: DRYCLEANING PLANTS, EXCEPT RUG CLEANING Organizations: JOE EDELSTEIN PRES (CONTACT/OWNER)
Alternative names: ELAT DRY CLEANERS INC, GOODY'S QUALITY CLEANERS
PERLA CLEANERS INC (16100 COLLINS AVE #101 in NORTH MIAMI BEACH, FL)
AIR MINOR (AIRS/AFS) Business SIC classification: DRYCLEANING PLANTS, EXCEPT RUG CLEANING
BISCAYNE DRY CLEANERS (20107 BISCAYNE BLVD in AVENTURA, FL)
AIR MINOR (AIRS/AFS) Small Quantity Generators, between 100 kg and 1000 kg of hazardous waste/month (Resource Conservation and Recovery Act (tracking hazardous waste)) - notification Business SIC classification: DRYCLEANING PLANTS, EXCEPT RUG CLEANING Organizations: DAWOOD SIDDIQ MGR (CONTACT/OWNER)
PUCHI CORP (18139 BISCAYNE BLVD in NORTH MIAMI BEACH, FL)
AIR MINOR (AIRS/AFS) Small Quantity Generators, between 100 kg and 1000 kg of hazardous waste/month (Resource Conservation and Recovery Act (tracking hazardous waste)) Business SIC classification: DRYCLEANING PLANTS, EXCEPT RUG CLEANING Organizations: MELVIN BURTON, GEN PARTNER (CONTACT/OWNER)
Alternative names: BISCAYNE HARBOUR PLAZA CLEANERS, BORO CORPORATION
OCEANIA EXECUTIVE CLEANERS INC (167 SUNNY ISLE BOULEVARD in NORTH MIAMI BEACH, FL)
AIR MINOR (AIRS/AFS) Small Quantity Generators, between 100 kg and 1000 kg of hazardous waste/month (Resource Conservation and Recovery Act (tracking hazardous waste)) Business SIC classification: DRYCLEANING PLANTS, EXCEPT RUG CLEANING Organizations: EDUARDO BAELLA (CONTACT/OWNER)
Alternative names: OCEANIA EXECUTIVE DRY CLEANERS
SENSATION CLEANERS CO (850 IVES DAIRY ROAD T-61 in NORTH MIAMI BEACH, FL)
AIR MINOR (AIRS/AFS) Small Quantity Generators, between 100 kg and 1000 kg of hazardous waste/month (Resource Conservation and Recovery Act (tracking hazardous waste)) - notification Business SIC classification: DRYCLEANING PLANTS, EXCEPT RUG CLEANING Organizations: ROACH LEVI, MGR (CONTACT/OWNER)
Alternative names: D & B QUALITY CLEANERS, DOMINGUE & GEORGES CORPORATION
176 BEACH LAUNDRY & DRY CLEANERS (17612 COLLINS AVE in SUNNY ISLES BEACH, FL)
(Resource Conservation and Recovery Act (tracking hazardous waste)) Organizations: MARK ORLHAC, PRES (CONTACT/OWNER)
JIFFY LUBE STORE #981 (20175 BISCAYNE BLVD in NORTH MIAMI BEACH, FL)
(Resource Conservation and Recovery Act (tracking hazardous waste)) Organizations: JOSE GONZALEZ, REGIONAL REG (CONTACT/OWNER)
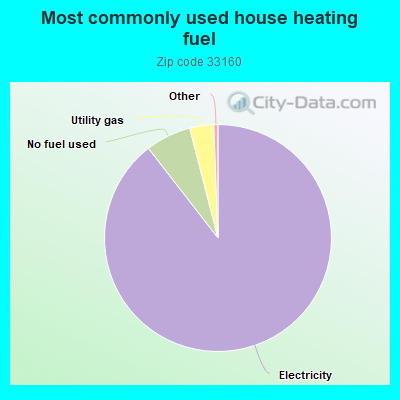
Housing units lacking complete plumbing facilities: 0.2% Housing units lacking complete kitchen facilities: 0.6%
89.5%Electricity
6.5%No fuel used
3.4%Utility gas
Population in 1990: 26,987. Population change in the 1990s: +6,846 (+25.4%).
Place of birth for U.S.-born residents:
This state: 7,153
Northeast: 6,973
Midwest: 1,441
South: 1,087
West: 488
49% of the 33160 zip code residents lived in the same house 5 years ago. Out of people who lived in different houses, 62% lived in this county. Out of people who lived in different counties, 50% lived in Florida.
87% of the 33160 zip code residents lived in the same house 1 year ago. Out of people who lived in different houses, 43% moved from this county. Out of people who lived in different houses, 8% moved from different county within same state. Out of people who lived in different houses, 17% moved from different state. Out of people who lived in different houses, 38% moved from abroad.
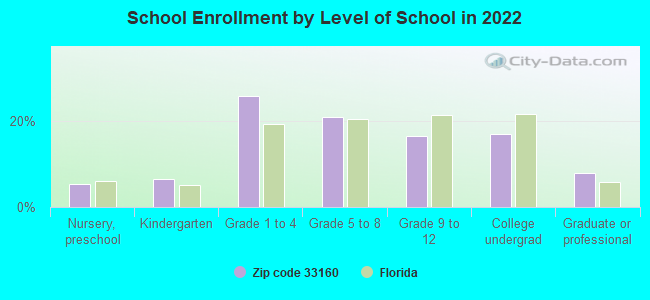
Private vs. public school enrollment:
Students in private schools in grades 1 to 8 (elementary and middle school): 561
Here:
16.2%
Florida:
15.8%
Students in private schools in grades 9 to 12 (high school): 277
Here:
22.8%
Florida:
12.9%
Students in private undergraduate colleges: 294
Here:
23.5%
Florida:
23.6%
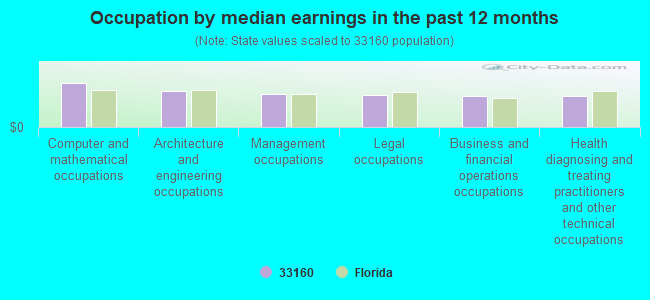
Occupation by median earnings in the past 12 months ($)
108,766Computer and mathematical occupations
88,350Architecture and engineering occupations
81,862Management occupations
79,304Legal occupations
76,634Business and financial operations occupations
75,417Health diagnosing and treating practitioners and other technical occupations
Companies with federal contracts located in this zip code:
BREAKTHROUGH ENERGY SYSTEMS, I (16425 COLLINS AVENUE SUI in SUNNY ISLES, FL; small business) : $78,000 in 2 contractsfrom 2000 to 2001
$45,000 with Army for Educational Services. Signed on 2001-02-27. Completion date: 2001-03-19.
$33,000 with Army for Services -- Basic Research (R&D). Signed on 2000-09-19. Completion date: 2001-10-31.
ABC ALARM LOCK AND KEY INC (18200 WEST DIXIE HIGHWAY in NORTH MIAMI BE, FL; small business) : $33,512 in 3 contractsfrom 2003 to 2004
$17,262 with Army for Hardware, Commercial. Signed on 2003-04-01. Completion date: 2003-04-18.
$9,000 with Army for Miscellaneous Machine Tools. Signed on 2004-02-10. Completion date: 2004-02-24.
$7,250 with Army for Miscellaneous Maintenance and Repair Shop Specialized Equipment. Signed on 2003-12-29. Completion date: 2003-12-30.
Top industries in this zip code by the number of employees in 2005:
Other Services (except Public Administration): Other Similar Organizations (except Business, Professional, Labor, and Political Organizations) (100-249: 1, 20-49: 1, 10-19: 9, 5-9: 16, 1-4: 21)
Finance and Insurance: Direct Property and Casualty Insurance Carriers (250-499: 1, 5-9: 1, 1-4: 1)
Health Care and Social Assistance: Nursing Care Facilities (100-249: 2)
2008 - 2018 National Fire Incident Reporting System (NFIRS) incidents
Based on the data from the years 2008 - 2018 the average number of fires per year is 60. The highest number of fire incidents - 74 took place in 2014, and the least - 39 in 2015. The data has a decreasing trend.
When looking into fire subcategories, the most incidents belonged to: Structure Fires (42.6%), and Outside Fires (35.6%).
Fire incident types reported to NFIRS in Zip Code 33160

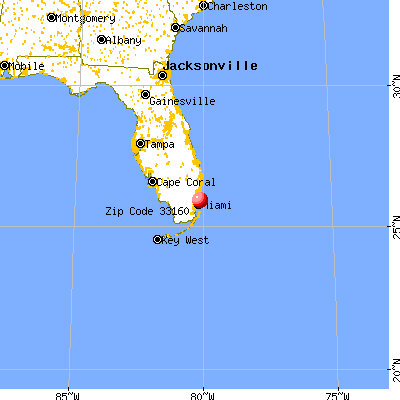


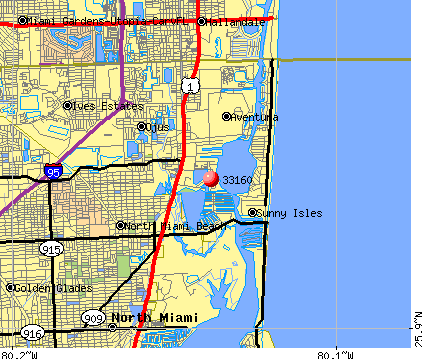 Nearest zip codes: 33180, 33181, 33162, 33179, 33154, 33009.
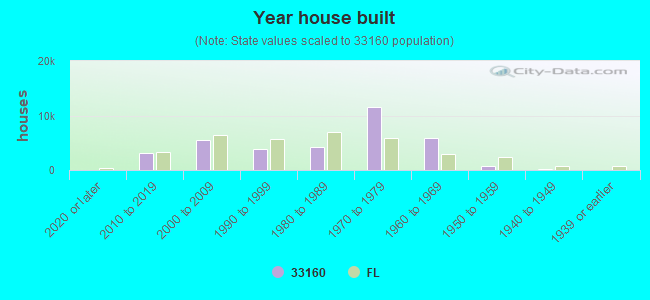


 Based on the data from the years 2008 - 2018 the average number of fires per year is 60. The highest number of fire incidents - 74 took place in 2014, and the least - 39 in 2015. The data has a decreasing trend.
 When looking into fire subcategories, the most incidents belonged to: Structure Fires (42.6%), and Outside Fires (35.6%).