Estimated zip code population in 2022: 45,131 Zip code population in 2010: 39,341 Zip code population in 2000: 34,504
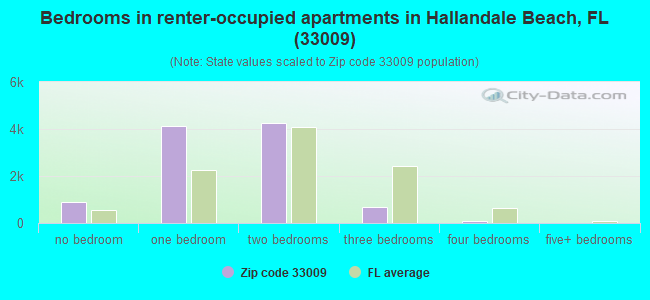
Houses and condos: 32,222 Renter-occupied apartments: 9,944
% of renters here:
45%
State:
33%
March 2022 cost of living index in zip code 33009: 109.2 (more than average, U.S. average is 100)
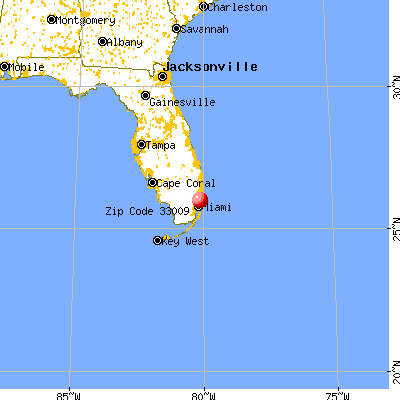
Land area: 5.1 sq. mi. Water area: 0.6 sq. mi.
Population density: 8,874 people per square mile
(high).
OSM Map
General Map
Google Map
MSN Map
OSM Map
General Map
Google Map
MSN Map
OSM Map
General Map
Google Map
MSN Map
OSM Map
General Map
Google Map
MSN Map
Please wait while loading the map...
Real estate property taxes paid for housing units in 2022:
This zip code:
0.9% ($2,676)
Florida:
0.7% ($2,529)
Median real estate property taxes paid for housing units with mortgages in 2022: $2,669 (0.9%) Median real estate property taxes paid for housing units with no mortgage in 2022: $2,680 (1.0%)
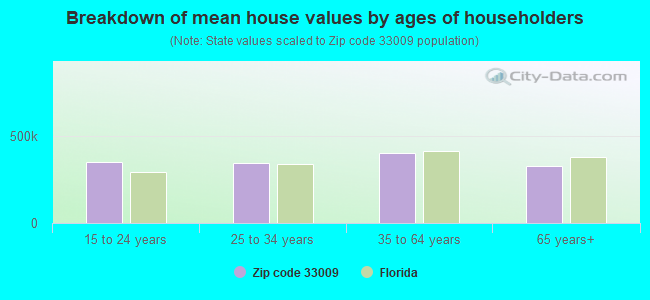
Estimated median house/condo value in 2022: $287,328
33009:
$287,328
Florida:
$354,100
According to our research of Florida and other state lists, there were 20 registered sex offenders living in 33009 zip code as of April 27, 2024. The ratio of all residents to sex offenders in zip code 33009 is 2,071 to 1. The ratio of registered sex offenders to all residents in this zip code is much lower than the state average.
Median resident age:
This zip code:
46.4 years
Florida median age:
42.7 years
Average household size:
This zip code:
2.1 people
Florida:
2.5 people
Averages for the 2020 tax year for zip code 33009, filed in 2021:
Average Adjusted Gross Income (AGI) in 2020: $59,411 (Individual Income Tax Returns)
Here:
$59,411
State:
$82,200
Salary/wage: $45,481 (reported on 67.2% of returns)
Here:
$45,481
State:
$58,347
(% of AGI for various income ranges: 1105.3% for AGIs below $25k, 3603.8% for AGIs $25k-50k, 6931.0% for AGIs $50k-75k, 10253.2% for AGIs $75k-100k, 17493.4% for AGIs $100k-200k, 109582.9% for AGIs over 200k)
Taxable interest for individuals: $5,146 (reported on 20.4% of returns)
This zip code:
$5,146
Florida:
$4,272
(% of AGI for various income ranges: 26.8% for AGIs below $25k, 42.4% for AGIs $25k-50k, 100.1% for AGIs $50k-75k, 211.8% for AGIs $75k-100k, 559.7% for AGIs $100k-200k, 8982.9% for AGIs over 200k)
Ordinary dividends: $11,865 (reported on 13.5% of returns)
Here:
$11,865
State:
$15,863
(% of AGI for various income ranges: 26.5% for AGIs below $25k, 49.9% for AGIs $25k-50k, 150.5% for AGIs $50k-75k, 361.1% for AGIs $75k-100k, 932.9% for AGIs $100k-200k, 14353.6% for AGIs over 200k)
Net capital gain/loss in AGI: +$44,111 (reported on 15.2% of returns)
Here:
+$44,111
State:
+$62,983
(% of AGI for various income ranges: 8.2% for AGIs below $25k, 50.1% for AGIs $25k-50k, 215.7% for AGIs $50k-75k, 457.9% for AGIs $75k-100k, 1557.4% for AGIs $100k-200k, 90763.6% for AGIs over 200k)
Profit/loss from business: +$8,353 (reported on 37.1% of returns)
Here:
+$8,353
State:
+$9,719
(% of AGI for various income ranges: 366.6% for AGIs below $25k, 274.5% for AGIs $25k-50k, 395.5% for AGIs $50k-75k, 630.0% for AGIs $75k-100k, 1147.3% for AGIs $100k-200k, 9898.6% for AGIs over 200k)
Taxable individual retirement arrangement distribution: $21,358 (reported on 5.4% of returns)
33009:
$21,358
Florida:
$24,823
(% of AGI for various income ranges: 38.5% for AGIs below $25k, 71.0% for AGIs $25k-50k, 157.6% for AGIs $50k-75k, 356.7% for AGIs $75k-100k, 923.1% for AGIs $100k-200k, 6077.1% for AGIs over 200k)
Self-employed (Keogh) retirement plans: $43,280 (reported on 0.2% of returns)
33009:
$43,280
Florida:
$29,694
(% of AGI for various income ranges: 99.5% for AGIs $75k-100k, 1076.4% for AGIs over 200k)
Total itemized deductions: $40,014 (reported on 5.7% of returns)
Here:
$40,014
State:
$45,393
(% of AGI for various income ranges: 39.7% for AGIs below $25k, 169.2% for AGIs $25k-50k, 335.4% for AGIs $50k-75k, 603.8% for AGIs $75k-100k, 1433.3% for AGIs $100k-200k, 15262.1% for AGIs over 200k)
Charity contributions: $10,602 (reported on 4.4% of returns)
Here:
$10,602
State:
$20,178
(% of AGI for various income ranges: 2.5% for AGIs below $25k, 26.5% for AGIs $25k-50k, 56.2% for AGIs $50k-75k, 102.3% for AGIs $75k-100k, 205.0% for AGIs $100k-200k, 4264.3% for AGIs over 200k)
Taxes paid: $6,866 (reported on 5.6% of returns)
33009:
$6,866
State:
$6,967
(% of AGI for various income ranges: 6.8% for AGIs below $25k, 33.9% for AGIs $25k-50k, 70.6% for AGIs $50k-75k, 147.6% for AGIs $75k-100k, 304.9% for AGIs $100k-200k, 1686.4% for AGIs over 200k)
Earned income credit: $2,031 (reported on 26.7% of returns)
Here:
$2,031
State:
$2,306
(% of AGI for various income ranges: 130.1% for AGIs below $25k, 77.0% for AGIs $25k-50k, 1.0% for AGIs $50k-75k)
Percentage of individuals using paid preparers for their 2020 taxes: 89.9%
Here:
90%
State:
92%
(% for various income ranges: 88.5% for AGIs below $25k, 91.2% for AGIs $25k-50k, 90.4% for AGIs $50k-75k, 89.9% for AGIs $75k-100k, 91.6% for AGIs $100k-200k, 93.1% for AGIs over 200k)
Averages for the 2012 tax year for zip code 33009, filed in 2013:
Average Adjusted Gross Income (AGI) in 2012: $47,580 (Individual Income Tax Returns)
Here:
$47,580
State:
$60,316
Salary/wage: $36,822 (reported on 72.5% of returns)
Here:
$36,822
State:
$45,277
(% of AGI for various income ranges: 68.2% for AGIs below $25k, 80.5% for AGIs $25k-50k, 72.0% for AGIs $50k-75k, 64.1% for AGIs $75k-100k, 60.0% for AGIs $100k-200k, 28.5% for AGIs over 200k)
Taxable interest for individuals: $4,821 (reported on 23.9% of returns)
This zip code:
$4,821
Florida:
$3,587
(% of AGI for various income ranges: 2.1% for AGIs below $25k, 1.5% for AGIs $25k-50k, 2.2% for AGIs $50k-75k, 2.6% for AGIs $75k-100k, 2.6% for AGIs $100k-200k, 3.0% for AGIs over 200k)
Ordinary dividends: $12,468 (reported on 15.1% of returns)
Here:
$12,468
State:
$12,831
(% of AGI for various income ranges: 2.7% for AGIs below $25k, 2.1% for AGIs $25k-50k, 3.5% for AGIs $50k-75k, 4.2% for AGIs $75k-100k, 4.5% for AGIs $100k-200k, 5.3% for AGIs over 200k)
Net capital gain/loss in AGI: +$39,988 (reported on 13.9% of returns)
Here:
+$39,988
State:
+$33,493
(% of AGI for various income ranges: 0.3% for AGIs $25k-50k, 0.6% for AGIs $50k-75k, 1.1% for AGIs $75k-100k, 3.1% for AGIs $100k-200k, 33.0% for AGIs over 200k)
Profit/loss from business: +$8,713 (reported on 25.8% of returns)
Here:
+$8,713
State:
+$10,012
(% of AGI for various income ranges: 15.8% for AGIs below $25k, 3.3% for AGIs $25k-50k, 2.6% for AGIs $50k-75k, 2.6% for AGIs $75k-100k, 3.9% for AGIs $100k-200k, 2.4% for AGIs over 200k)
Taxable individual retirement arrangement distribution: $14,985 (reported on 8.0% of returns)
33009:
$14,985
Florida:
$21,544
(% of AGI for various income ranges: 2.5% for AGIs below $25k, 1.7% for AGIs $25k-50k, 3.1% for AGIs $50k-75k, 3.7% for AGIs $75k-100k, 5.0% for AGIs $100k-200k, 1.6% for AGIs over 200k)
Self-employment retirement plans: $17,633 (reported on 0.3% of returns)
33009:
$17,633
Florida:
$20,611
(% of AGI for various income ranges: 0.3% for AGIs $50k-75k, 0.2% for AGIs over 200k)
Total itemized deductions: $22,263 (18% of AGI, reported on 20.4% of returns)
Here:
$22,263
State:
$25,533
Here:
18.2% of AGI
State:
18.0% of AGI
(% of AGI for various income ranges: 7.8% for AGIs below $25k, 11.6% for AGIs $25k-50k, 12.7% for AGIs $50k-75k, 13.2% for AGIs $75k-100k, 11.2% for AGIs $100k-200k, 6.5% for AGIs over 200k)
Charity contributions: $3,936 (reported on 15.7% of returns)
Here:
$3,936
State:
$5,698
(% of AGI for various income ranges: 0.5% for AGIs below $25k, 1.2% for AGIs $25k-50k, 1.5% for AGIs $50k-75k, 1.5% for AGIs $75k-100k, 1.3% for AGIs $100k-200k, 1.6% for AGIs over 200k)
Taxes paid: $5,416 (reported on 19.6% of returns)
33009:
$5,416
State:
$6,203
(% of AGI for various income ranges: 1.3% for AGIs below $25k, 1.7% for AGIs $25k-50k, 2.3% for AGIs $50k-75k, 2.7% for AGIs $75k-100k, 3.1% for AGIs $100k-200k, 2.4% for AGIs over 200k)
Earned income credit: $2,132 (reported on 28.4% of returns)
Here:
$2,132
State:
$2,372
(% of AGI for various income ranges: 7.8% for AGIs below $25k, 0.9% for AGIs $25k-50k)
Percentage of individuals using paid preparers for their 2012 taxes: 70.0%
Here:
70%
State:
54%
(% for various income ranges: 69.7% for AGIs below $25k, 68.7% for AGIs $25k-50k, 70.4% for AGIs $50k-75k, 67.1% for AGIs $75k-100k, 77.8% for AGIs $100k-200k, 82.5% for AGIs over 200k)
Averages for the 2004 tax year for zip code 33009, filed in 2005:
Average Adjusted Gross Income (AGI) in 2004: $38,121 (Individual Income Tax Returns)
Here:
$38,121
State:
$50,523
Salary/wage: $30,787 (reported on 70.5% of returns)
Here:
$30,787
State:
$39,563
(% of AGI for various income ranges: 89.5% for AGIs below $10k, 70.2% for AGIs $10k-25k, 76.1% for AGIs $25k-50k, 68.0% for AGIs $50k-75k, 60.3% for AGIs $75k-100k, 31.1% for AGIs over 100k)
Taxable interest for individuals: $5,658 (reported on 39.8% of returns)
This zip code:
$5,658
Florida:
$3,211
(% of AGI for various income ranges: 17.7% for AGIs below $10k, 6.1% for AGIs $10k-25k, 3.8% for AGIs $25k-50k, 5.0% for AGIs $50k-75k, 4.9% for AGIs $75k-100k, 7.1% for AGIs over 100k)
Taxable dividends: $7,659 (reported on 22.9% of returns)
Here:
$7,659
State:
$6,129
(% of AGI for various income ranges: 10.5% for AGIs below $10k, 3.6% for AGIs $10k-25k, 2.8% for AGIs $25k-50k, 3.9% for AGIs $50k-75k, 5.0% for AGIs $75k-100k, 6.1% for AGIs over 100k)
Net capital gain/loss: +$14,777 (reported on 22.1% of returns)
Here:
+$14,777
State:
+$27,205
(% of AGI for various income ranges: -5.2% for AGIs below $10k, -0.2% for AGIs $10k-25k, 0.8% for AGIs $25k-50k, 1.7% for AGIs $50k-75k, 4.3% for AGIs $75k-100k, 22.2% for AGIs over 100k)
Profit/loss from business: +$8,695 (reported on 20.0% of returns)
Here:
+$8,695
State:
+$10,634
(% of AGI for various income ranges: 33.9% for AGIs below $10k, 9.2% for AGIs $10k-25k, 3.8% for AGIs $25k-50k, 2.4% for AGIs $50k-75k, 4.2% for AGIs $75k-100k, 2.5% for AGIs over 100k)
IRA payment deduction: $2,842 (reported on 2.4% of returns)
33009:
$2,842
Florida:
$3,082
(% of AGI for various income ranges: 0.4% for AGIs below $10k, 0.2% for AGIs $10k-25k, 0.3% for AGIs $25k-50k, 0.3% for AGIs $50k-75k, 0.2% for AGIs $75k-100k, 0.1% for AGIs over 100k)
Self-employed pension: $13,146 (reported on 0.3% of returns)
Here:
$13,146
Florida:
$15,857
Total itemized deductions: $19,624 (27% of AGI, reported on 28.6% of returns)
Here:
$19,624
State:
$20,370
Here:
27.3% of AGI
State:
20.7% of AGI
(% of AGI for various income ranges: 22.0% for AGIs below $10k, 13.0% for AGIs $10k-25k, 15.7% for AGIs $25k-50k, 16.2% for AGIs $50k-75k, 16.8% for AGIs $75k-100k, 13.2% for AGIs over 100k)
Charity contributions deductions: $2,923 (4% of AGI, reported on 23.8% of returns)
Here:
$2,923
State:
$4,064
Here:
3.8% of AGI
State:
3.8% of AGI
(% of AGI for various income ranges: 1.0% for AGIs below $10k, 1.1% for AGIs $10k-25k, 1.6% for AGIs $25k-50k, 2.1% for AGIs $50k-75k, 2.3% for AGIs $75k-100k, 2.1% for AGIs over 100k)
Total tax: $6,631 (reported on 71.0% of returns)
33009:
$6,631
State:
$9,431
(% of AGI for various income ranges: 6.3% for AGIs below $10k, 4.0% for AGIs $10k-25k, 7.1% for AGIs $25k-50k, 10.6% for AGIs $50k-75k, 12.6% for AGIs $75k-100k, 20.3% for AGIs over 100k)
Earned income credit: $1,739 (reported on 22.0% of returns)
Here:
$1,739
State:
$1,808
Percentage of individuals using paid preparers for their 2004 taxes: 70.9%
Here:
71%
State:
60%
(% for various income ranges: 69.1% for AGIs below $10k, 71.7% for AGIs $10k-25k, 68.7% for AGIs $25k-50k, 71.5% for AGIs $50k-75k, 73.0% for AGIs $75k-100k, 82.8% for AGIs over 100k)
Likely homosexual households (counted as self-reported same-sex unmarried-partner households)
Lesbian couples: 0.2% of all households
Gay men: 0.2% of all households
Household received Food Stamps/SNAP in the past 12 months: 3,515 Household did not receive Food Stamps/SNAP in the past 12 months: 18,356
Women who had a birth in the past 12 months: 587 (267 now married, 304 unmarried) Women who did not have a birth in the past 12 months: 9,025 (2,987 now married, 6,035 unmarried)
Housing units in zip code 33009 with a mortgage: 3,879 (346 second mortgage, 21 home equity loan, 288 both second mortgage and home equity loan) Houses without a mortgage: 156
Median monthly owner costs for units with a mortgage: $1,676 Median monthly owner costs for units without a mortgage: $790
Residents with income below the poverty level in 2022:
This zip code:
21.8%
Whole state:
12.7%
Residents with income below 50% of the poverty level in 2022:
This zip code:
10.0%
Whole state:
6.6%
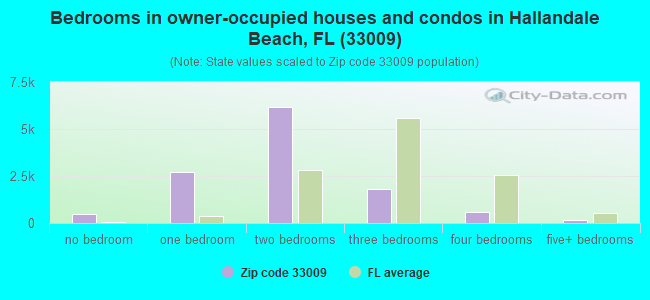
Median number of rooms in houses and condos:
Here:
4.0
State:
5.9
Median number of rooms in apartments:
Here:
3.4
State:
4.2
Notable locations in this zip code not listed on our city pages
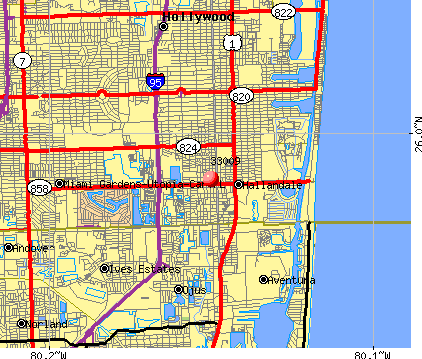
Notable locations in zip code 33009: Gulfstream Park Racetrack (A), Hollywood Kennel Club (B), Hallandale Adult Community Center (C), Diplomat Country Club (D), Golden Isles Professional Plaza (E), Hollywood Greyhound Track (F), Glen Eagle at Bretonne Park (G), Venetian Marina (H), Town Plaza (I), Village Shopping Plaza (J), Hallandale Branch Library (K), Hallandale Chamber of Commerce (L), Hallandale Fire Station (M), Hallandale Library (N), Hallandale Police Station (O), Cultural Community Center (P), Care House of Hallandale Beach (Q), Hallandale Beach Fire Rescue Station 7 (R), Hallandale Beach Fire Rescue Station 60 (S), Hallandale Fire / Rescue Station 90 (T). Display/hide their locations on the map
Shopping Centers: Hallandale Shopping Center (1), Seawalk Pointe Shopping Center (2), Seawalk Pointe Shopping Center (3), Hallandale Shopping Center (4), Diplomat Mall Shopping Center (5). Display/hide their locations on the map
Churches in zip code 33009 include: Saint Charles Barromeo Church (A), Saint Matthews Church (B), Community Missionary Baptist Church (C), First Baptist Church of Hallandale (D). Display/hide their locations on the map
Parks in zip code 33009 include: North Park (1), Golden Isles Park (2), Three Islands Park (3), Hallandale City Park (4), Ingalls Park (5), Foster Park (6), Dixie Park (7). Display/hide their locations on the map
2,855 married couples with children.
3,455 single-parent households (656 men, 2,799 women).
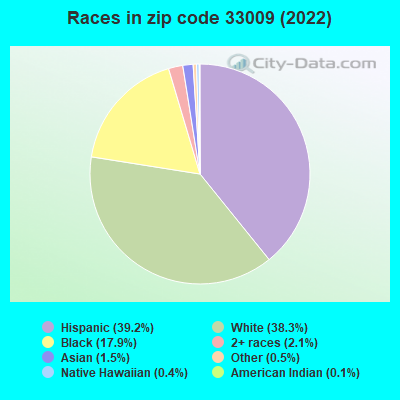
37.5% of residents of 33009 zip code speak English at home.
37.1% of residents speak Spanish at home (51% very well, 20% well, 21% not well, 8% not at all).
23.3% of residents speak other Indo-European language at home (55% very well, 29% well, 14% not well, 2% not at all).
0.6% of residents speak Asian or Pacific Island language at home (62% very well, 38% well).
2.6% of residents speak other language at home (75% very well, 18% well, 7% not well).
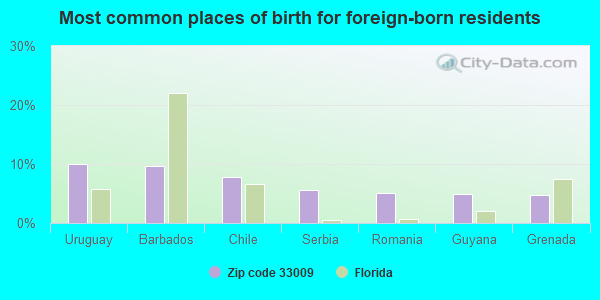
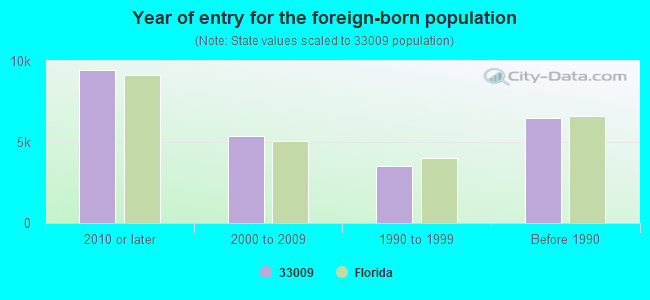
Foreign born population: 23,235 (51.5%) (58.4% of them are naturalized citizens)
Major facilities with environmental interests located in this zip code:
GOLD COAST CHEMICAL PRODUCTS DIV DORA IND INC (2790 S PARK RD in PEMBROKE PARK, FL)
STATE MASTER (New Jersey environmental info) - NJEMS-003561, PESTICIDES - MANUFACTURE (Resource Conservation and Recovery Act (tracking hazardous waste)) Organizations: I-95 REALTY INC (CONTACT/OWNER)
LAVIANO S MARINE SERVICE (3146 JOHN P CURCIE DR BAY 2 in PEMBROKE PARK, FL)
STATE MASTER (FDM) - CHAZ-FLD982147399, HAZARDOUS WASTE REGULATION PROGRAM (Resource Conservation and Recovery Act (tracking hazardous waste)) Business SIC classification: REPAIR SHOPS AND RELATED SERVICES Organizations: LISA LAVIANO (CONTACT/OWNER)
Alternative names: B C DIESEL ENGINE REPAIRS INC, LAVIANO`S MARINE SERVICE
HALLANDALE ADULT & COMMUNITY CENTER (1000 SW 3RD ST in HALLANDALE BEACH, FL)
(Geographic Names Information System) (National Center for Education Statistics) - STATE ID-0592 Organizations: BROWARD COUNTY SCHOOL DISTRICT (SCHOOL DISTRICT)
HALLANDALE ELEMENTARY SCHOOL (120 SW 4TH AVE in HALLANDALE, FL)
(Geographic Names Information System) (National Center for Education Statistics) - STATE ID-0131 Organizations: BROWARD COUNTY SCHOOL DISTRICT (SCHOOL DISTRICT)
SOUTH AREA ALTERNATIVE CENTER (1050 NW 7TH CT in HALLANDALE BEACH, FL)
(Geographic Names Information System) (National Center for Education Statistics) - STATE ID-0405 Organizations: BROWARD COUNTY SCHOOL DISTRICT (SCHOOL DISTRICT)
PEMBROK PARK WAREHOUSE (3130 SW 19TH ST in PEMBROKE PARK, FL)
(Integrated Compliance Information System) - ICIS-04-1999-0545, FORMAL ENFORCEMENT ACTION, ICIS-04-2001-9026, ICIS-04-1990-0127, ICIS-04-2002-3774, Small Quantity Generators, between 100 kg and 1000 kg of hazardous waste/month (Resource Conservation and Recovery Act (tracking hazardous waste)) - notification Organizations: NON NOTIFIED (CONTACT/OWNER)
Alternative names: PETROLEUM PRODUCTS CORP
PACE CENTER FOR GIRLS, INC. (1000 SW 3RD STREET in HALLANDALE, FL)
(National Center for Education Statistics) - STATE ID-6091 Organizations: BROWARD COUNTY SCHOOL DISTRICT (SCHOOL DISTRICT)
MARK 1 POWER BOATS, INC. (1798 S. W. 31ST AVE in HALLANDALE, FL)
(Integrated Compliance Information System) - ICIS-04-1998-0214, FORMAL ENFORCEMENT ACTION Business SIC classification: BOAT BUILDING AND REPAIRING
HANG LOOSE INTERNATIONAL CORP. (470 ANSIN BLVD. in HALLANDALE, FL)
HOUSE OF LORRAINE (500 E HALLANDALE BEACH BLVD in HALLANDALE, FL)
Small Quantity Generators, between 100 kg and 1000 kg of hazardous waste/month (Resource Conservation and Recovery Act (tracking hazardous waste)) - notification Large Quantity Generators, more that 1000 kg of hazardous waste/month (Resource Conservation and Recovery Act (tracking hazardous waste)) Organizations: FLORIDA DEP (CONTACT/OPERATOR)
, G GROSS (CONTACT/OWNER)
, KNORR & KNORR (CONTACT/OWNER)
Alternative names: DEP HOUSE OF LORRAINE VALET, FLORIDA DEP DSCP D112 #069500422
SKIN AND CANCER ASSOCIATION (2100 E HALLANDALE BOULEVARD in HALLANDALE, FL)
(Resource Conservation and Recovery Act (tracking hazardous waste)) Small Quantity Generators, between 100 kg and 1000 kg of hazardous waste/month (Resource Conservation and Recovery Act (tracking hazardous waste)) - notification Business NAICS classification: OFFICES OF PHYSICIANS, MENTAL HEALTH SPECIALISTS.; MEDICAL LABORATORIES. Organizations: RICHARD GREEN (CONTACT/OWNER)
, RICHARD GREENE MD (CONTACT/OWNER)
Alternative names: SKIN & CANCER ASSN
7-ELEVEN STORE #25077 (747 W HALLANDALE BEACH BLVD in HALLANDALE BEACH, FL)
National Pollutant Discharge Elimination System NON-MAJOR (Tracking pollutant discharge elimination systems) - permit Organizations: WILLO SMITH (CONTACT/OWNER)
Alternative names: HANDYWAY STORE #2292 (IW)
HALLENDALE HIGH ATHLETIC FACIL (720 NW 9TH AVE in HALLENDALE BEACH, FL)
National Pollutant Discharge Elimination System NON-MAJOR (Tracking pollutant discharge elimination systems) - permit Organizations: JOSEPH CERRONE (CONTACT/OWNER)
Alternative names: BLACKWATER CREEK SUBDIVISION
Housing units lacking complete plumbing facilities: 0.4% Housing units lacking complete kitchen facilities: 0.9%
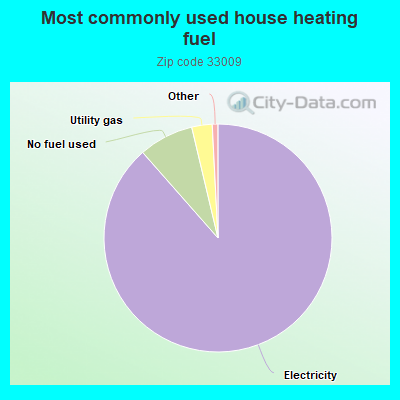
88.6%Electricity
7.8%No fuel used
2.9%Utility gas
Population in 1990: 33,743. Population change in the 1990s: +761 (+2.3%).
Place of birth for U.S.-born residents:
This state: 11,599
Northeast: 5,089
Midwest: 1,799
South: 1,647
West: 578
55% of the 33009 zip code residents lived in the same house 5 years ago. Out of people who lived in different houses, 44% lived in this county. Out of people who lived in different counties, 50% lived in Florida.
84% of the 33009 zip code residents lived in the same house 1 year ago. Out of people who lived in different houses, 35% moved from this county. Out of people who lived in different houses, 22% moved from different county within same state. Out of people who lived in different houses, 20% moved from different state. Out of people who lived in different houses, 27% moved from abroad.
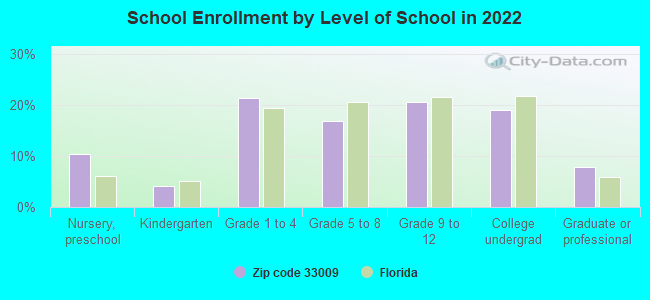
Private vs. public school enrollment:
Students in private schools in grades 1 to 8 (elementary and middle school): 376
Here:
14.2%
Florida:
15.8%
Students in private schools in grades 9 to 12 (high school): 341
Here:
23.8%
Florida:
12.9%
Students in private undergraduate colleges: 345
Here:
26.0%
Florida:
23.6%
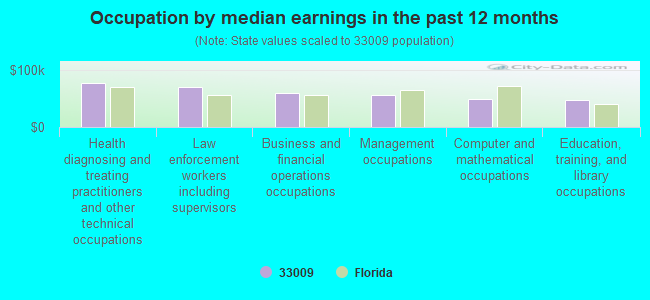
Occupation by median earnings in the past 12 months ($)
77,415Health diagnosing and treating practitioners and other technical occupations
69,674Law enforcement workers including supervisors
60,470Business and financial operations occupations
55,459Management occupations
49,543Computer and mathematical occupations
48,259Education, training, and library occupations
Companies with federal contracts located in this zip code:
AUDIO SOUND INC (1835 E HALLANDALE ABLVD in HALLANDALE, FL; small business)
$30,355 with Navy for Phonographs, Radio and Television Sets: Home Type. Signed on 2004-09-30. Completion date: 2004-10-15.
AMERICAN HEART SCIENCE (111 S E 1ST AVENUE in HALLANDALE, FL; small business) : $23,384 in 2 contractsfrom 2004 to 2005
$14,192 with Department of Defense for Hospital Furniture, Equipment, Utensils, and Supplies. Signed on 2005-01-07. Completion date: 2005-01-07.
$9,192 with Army for Medical and Surgical Instruments, Equipment, and Supplies. Taking place in CA. Signed on 2004-08-13. Completion date: 2004-08-20.
SEAKING INC (3126 JOHN P CURCI DR # 3 in HALLANDALE, FL; small business)
$3,428 with Army for Kitchen Equipment and Appliances. Signed on 2003-09-03. Completion date: 2003-10-14.
Top industries in this zip code by the number of employees in 2005:
Management of Companies and Enterprises: Corporate, Subsidiary, and Regional Managing Offices (250-499: 1, 1-4: 1)
Arts, Entertainment, and Recreation: Racetracks (250-499: 1)
Health Care and Social Assistance: Offices of Physicians (except Mental Health Specialists) (20-49: 4, 10-19: 6, 5-9: 11, 1-4: 30)
Other Services (except Public Administration): Other Similar Organizations (except Business, Professional, Labor, and Political Organizations) (50-99: 1, 20-49: 3, 10-19: 4, 5-9: 6, 1-4: 31)
People in group quarters in 2010:
62 people in emergency and transitional shelters (with sleeping facilities) for people experiencing homelessness
15 people in residential treatment centers for adults
14 people in group homes intended for adults
10 people in workers' group living quarters and job corps centers
People in group quarters in 2000:
133 people in nursing homes
128 people in other noninstitutional group quarters
17 people in homes for the mentally retarded
Fatal accident statistics in 2014:
Fatal accident count: 4
Vehicles involved in fatal accidents: 6
Fatal accidents caused by drunken drivers: 1
Fatalities: 4
Persons involved in fatal accidents: 6
Pedestrians involved in fatal accidents: 3
Fatal accident statistics in 2013:
Fatal accident count: 4
Vehicles involved in fatal accidents: 4
Fatal accidents caused by drunken drivers: 1
Fatalities: 4
Persons involved in fatal accidents: 7
Pedestrians involved in fatal accidents: 2
Home Mortgage Disclosure Act Aggregated Statistics For Year 2009 (Based on 12 full and 4 partial tracts)
A) FHA, FSA/RHS & VA Home Purchase Loans
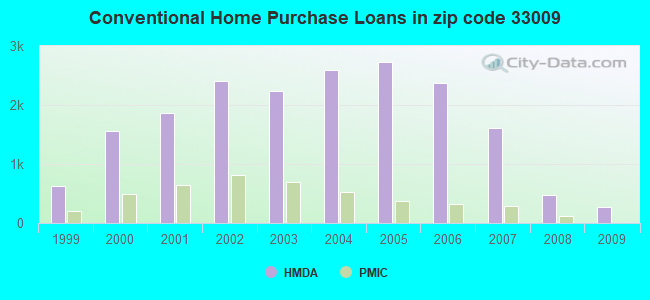
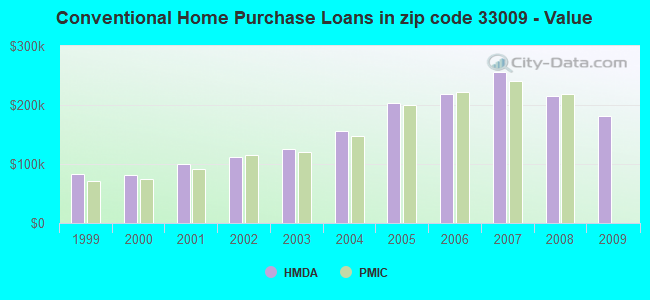
B) Conventional Home Purchase Loans
C) Refinancings
D) Home Improvement Loans
E) Loans on Dwellings For 5+ Families
F) Non-occupant Loans on < 5 Family Dwellings (A B C & D)
G) Loans On Manufactured Home Dwelling (A B C & D)
Number
Average Value
Number
Average Value
Number
Average Value
Number
Average Value
Number
Average Value
Number
Average Value
Number
Average Value
LOANS ORIGINATED
64
$146,716
275
$181,668
184
$180,176
13
$171,366
0
$0
159
$178,947
2
$76,700
APPLICATIONS APPROVED, NOT ACCEPTED
5
$93,378
38
$152,387
57
$251,701
4
$21,885
0
$0
21
$213,400
2
$76,700
APPLICATIONS DENIED
42
$113,963
158
$138,397
353
$181,330
30
$65,444
0
$0
185
$156,089
2
$100,970
APPLICATIONS WITHDRAWN
39
$129,034
79
$205,580
135
$167,837
4
$106,280
2
$1,198,320
56
$143,880
0
$0
FILES CLOSED FOR INCOMPLETENESS
10
$104,852
23
$170,176
37
$192,451
3
$142,103
2
$249,650
13
$238,545
0
$0
Aggregated Statistics For Year 2008 (Based on 12 full and 4 partial tracts)
A) FHA, FSA/RHS & VA Home Purchase Loans
B) Conventional Home Purchase Loans
C) Refinancings
D) Home Improvement Loans
E) Loans on Dwellings For 5+ Families
F) Non-occupant Loans on < 5 Family Dwellings (A B C & D)
G) Loans On Manufactured Home Dwelling (A B C & D)
Number
Average Value
Number
Average Value
Number
Average Value
Number
Average Value
Number
Average Value
Number
Average Value
Number
Average Value
LOANS ORIGINATED
55
$171,499
474
$215,671
377
$203,018
43
$101,729
14
$465,077
315
$219,117
0
$0
APPLICATIONS APPROVED, NOT ACCEPTED
10
$175,849
126
$219,732
156
$159,498
29
$97,517
0
$0
88
$203,820
0
$0
APPLICATIONS DENIED
26
$168,381
311
$231,964
551
$206,531
85
$139,836
8
$414,900
249
$242,836
8
$59,681
APPLICATIONS WITHDRAWN
8
$118,445
141
$225,301
164
$226,180
12
$131,076
2
$898,740
95
$213,945
0
$0
FILES CLOSED FOR INCOMPLETENESS
6
$121,820
73
$227,627
83
$263,083
5
$122,696
0
$0
55
$226,810
0
$0
Aggregated Statistics For Year 2007 (Based on 12 full and 4 partial tracts)
A) FHA, FSA/RHS & VA Home Purchase Loans
B) Conventional Home Purchase Loans
C) Refinancings
D) Home Improvement Loans
E) Loans on Dwellings For 5+ Families
F) Non-occupant Loans on < 5 Family Dwellings (A B C & D)
G) Loans On Manufactured Home Dwelling (A B C & D)
Number
Average Value
Number
Average Value
Number
Average Value
Number
Average Value
Number
Average Value
Number
Average Value
Number
Average Value
LOANS ORIGINATED
17
$214,476
1,611
$255,898
1,323
$214,959
134
$130,015
20
$2,158,684
1,015
$259,409
5
$102,372
APPLICATIONS APPROVED, NOT ACCEPTED
0
$0
399
$264,695
406
$194,673
50
$113,060
2
$559,215
238
$255,826
2
$105,850
APPLICATIONS DENIED
7
$152,266
859
$250,221
1,220
$223,950
176
$119,895
4
$324,530
631
$242,176
8
$59,854
APPLICATIONS WITHDRAWN
0
$0
220
$282,174
440
$223,488
28
$86,100
2
$699,020
155
$274,288
0
$0
FILES CLOSED FOR INCOMPLETENESS
0
$0
105
$261,123
170
$263,118
11
$114,611
0
$0
78
$230,337
0
$0
Aggregated Statistics For Year 2006 (Based on 12 full and 4 partial tracts)
A) FHA, FSA/RHS & VA Home Purchase Loans
B) Conventional Home Purchase Loans
C) Refinancings
D) Home Improvement Loans
E) Loans on Dwellings For 5+ Families
F) Non-occupant Loans on < 5 Family Dwellings (A B C & D)
G) Loans On Manufactured Home Dwelling (A B C & D)
Number
Average Value
Number
Average Value
Number
Average Value
Number
Average Value
Number
Average Value
Number
Average Value
Number
Average Value
LOANS ORIGINATED
54
$184,869
2,368
$217,817
1,902
$203,860
187
$144,170
22
$908,964
1,164
$241,407
8
$45,924
APPLICATIONS APPROVED, NOT ACCEPTED
2
$168,765
350
$207,058
355
$213,556
62
$103,734
2
$479,855
191
$197,293
6
$41,837
APPLICATIONS DENIED
2
$142,785
1,117
$196,131
1,085
$219,025
176
$106,541
10
$618,905
476
$229,785
16
$45,716
APPLICATIONS WITHDRAWN
4
$245,882
422
$199,103
811
$206,108
44
$122,604
2
$738,890
245
$209,056
2
$404,390
FILES CLOSED FOR INCOMPLETENESS
0
$0
82
$229,391
200
$188,130
6
$138,117
0
$0
54
$200,779
0
$0
Aggregated Statistics For Year 2005 (Based on 12 full and 4 partial tracts)
A) FHA, FSA/RHS & VA Home Purchase Loans
B) Conventional Home Purchase Loans
C) Refinancings
D) Home Improvement Loans
E) Loans on Dwellings For 5+ Families
F) Non-occupant Loans on < 5 Family Dwellings (A B C & D)
G) Loans On Manufactured Home Dwelling (A B C & D)
Number
Average Value
Number
Average Value
Number
Average Value
Number
Average Value
Number
Average Value
Number
Average Value
Number
Average Value
LOANS ORIGINATED
8
$204,158
2,729
$202,594
1,906
$170,353
191
$125,097
38
$6,602,424
1,291
$207,610
12
$91,530
APPLICATIONS APPROVED, NOT ACCEPTED
2
$80,880
333
$199,709
396
$171,183
39
$68,807
4
$791,320
174
$204,381
4
$68,718
APPLICATIONS DENIED
2
$69,900
1,019
$200,704
1,015
$183,456
183
$93,028
2
$178,300
432
$197,198
22
$47,567
APPLICATIONS WITHDRAWN
4
$130,042
426
$208,973
748
$174,959
65
$243,205
6
$670,338
208
$203,726
3
$100,347
FILES CLOSED FOR INCOMPLETENESS
2
$79,975
121
$225,380
371
$171,449
8
$76,128
0
$0
31
$187,350
2
$97,865
Aggregated Statistics For Year 2004 (Based on 12 full and 4 partial tracts)
A) FHA, FSA/RHS & VA Home Purchase Loans
B) Conventional Home Purchase Loans
C) Refinancings
D) Home Improvement Loans
E) Loans on Dwellings For 5+ Families
F) Non-occupant Loans on < 5 Family Dwellings (A B C & D)
G) Loans On Manufactured Home Dwelling (A B C & D)
Number
Average Value
Number
Average Value
Number
Average Value
Number
Average Value
Number
Average Value
Number
Average Value
Number
Average Value
LOANS ORIGINATED
18
$164,166
2,596
$155,308
1,563
$141,083
157
$95,714
57
$1,667,836
1,044
$141,022
14
$70,642
APPLICATIONS APPROVED, NOT ACCEPTED
4
$94,868
409
$149,972
355
$127,611
41
$56,899
4
$1,220,222
187
$122,301
2
$28,385
APPLICATIONS DENIED
15
$122,505
796
$142,868
835
$135,337
180
$59,954
14
$579,181
340
$134,649
22
$48,690
APPLICATIONS WITHDRAWN
7
$147,106
315
$165,332
512
$137,485
45
$87,621
0
$0
97
$142,080
0
$0
FILES CLOSED FOR INCOMPLETENESS
0
$0
92
$176,843
359
$138,499
19
$97,772
0
$0
65
$147,261
2
$179,730
Aggregated Statistics For Year 2003 (Based on 12 full and 4 partial tracts)
A) FHA, FSA/RHS & VA Home Purchase Loans
B) Conventional Home Purchase Loans
C) Refinancings
D) Home Improvement Loans
E) Loans on Dwellings For 5+ Families
F) Non-occupant Loans on < 5 Family Dwellings (A B C & D)
Number
Average Value
Number
Average Value
Number
Average Value
Number
Average Value
Number
Average Value
Number
Average Value
LOANS ORIGINATED
36
$114,604
2,232
$125,992
2,376
$118,027
73
$64,543
34
$990,164
986
$114,824
APPLICATIONS APPROVED, NOT ACCEPTED
0
$0
307
$150,757
496
$114,069
25
$52,674
2
$412,420
114
$113,243
APPLICATIONS DENIED
15
$129,271
489
$112,875
1,111
$112,350
127
$37,858
4
$588,728
261
$103,286
APPLICATIONS WITHDRAWN
4
$117,870
314
$131,524
513
$127,660
20
$30,960
4
$1,695,782
127
$131,752
FILES CLOSED FOR INCOMPLETENESS
2
$158,380
101
$122,547
144
$117,739
4
$63,622
0
$0
42
$116,107
Aggregated Statistics For Year 2002 (Based on 12 full and 4 partial tracts)
A) FHA, FSA/RHS & VA Home Purchase Loans
B) Conventional Home Purchase Loans
C) Refinancings
D) Home Improvement Loans
E) Loans on Dwellings For 5+ Families
F) Non-occupant Loans on < 5 Family Dwellings (A B C & D)
Number
Average Value
Number
Average Value
Number
Average Value
Number
Average Value
Number
Average Value
Number
Average Value
LOANS ORIGINATED
74
$119,504
2,400
$111,360
1,423
$110,464
75
$69,573
25
$4,128,981
850
$106,578
APPLICATIONS APPROVED, NOT ACCEPTED
4
$104,672
287
$111,051
293
$101,802
31
$28,612
2
$284,600
125
$114,291
APPLICATIONS DENIED
20
$102,683
470
$101,568
796
$96,575
153
$49,750
4
$228,812
197
$93,712
APPLICATIONS WITHDRAWN
4
$119,005
230
$107,586
422
$150,774
28
$50,360
2
$284,570
110
$108,248
FILES CLOSED FOR INCOMPLETENESS
6
$120,193
77
$101,112
116
$124,179
2
$342,580
0
$0
27
$104,840
Aggregated Statistics For Year 2001 (Based on 12 full and 4 partial tracts)
A) FHA, FSA/RHS & VA Home Purchase Loans
B) Conventional Home Purchase Loans
C) Refinancings
D) Home Improvement Loans
E) Loans on Dwellings For 5+ Families
F) Non-occupant Loans on < 5 Family Dwellings (A B C & D)
Number
Average Value
Number
Average Value
Number
Average Value
Number
Average Value
Number
Average Value
Number
Average Value
LOANS ORIGINATED
115
$101,859
1,867
$99,517
997
$106,914
78
$30,757
29
$344,738
559
$87,567
APPLICATIONS APPROVED, NOT ACCEPTED
7
$71,267
220
$101,547
217
$83,069
31
$16,472
4
$119,832
65
$83,000
APPLICATIONS DENIED
27
$118,597
462
$87,630
718
$87,618
143
$28,473
4
$379,082
171
$78,994
APPLICATIONS WITHDRAWN
14
$111,014
185
$98,125
306
$87,879
28
$52,568
4
$358,270
48
$77,274
FILES CLOSED FOR INCOMPLETENESS
0
$0
49
$104,627
99
$97,658
9
$17,366
0
$0
19
$106,606
Aggregated Statistics For Year 2000 (Based on 12 full and 4 partial tracts)
A) FHA, FSA/RHS & VA Home Purchase Loans
B) Conventional Home Purchase Loans
C) Refinancings
D) Home Improvement Loans
E) Loans on Dwellings For 5+ Families
F) Non-occupant Loans on < 5 Family Dwellings (A B C & D)
Number
Average Value
Number
Average Value
Number
Average Value
Number
Average Value
Number
Average Value
Number
Average Value
LOANS ORIGINATED
125
$82,684
1,561
$81,680
260
$80,919
60
$27,910
10
$965,138
331
$65,395
APPLICATIONS APPROVED, NOT ACCEPTED
6
$81,602
241
$99,137
115
$86,314
44
$38,881
2
$236,075
65
$81,346
APPLICATIONS DENIED
15
$84,807
492
$90,074
417
$74,089
106
$38,459
8
$236,881
119
$83,385
APPLICATIONS WITHDRAWN
16
$90,135
171
$101,567
265
$54,541
13
$139,549
0
$0
45
$69,817
FILES CLOSED FOR INCOMPLETENESS
0
$0
65
$119,632
38
$85,036
3
$48,640
0
$0
15
$93,613
Aggregated Statistics For Year 1999 (Based on 6 full and 2 partial tracts)
A) FHA, FSA/RHS & VA Home Purchase Loans
B) Conventional Home Purchase Loans
C) Refinancings
D) Home Improvement Loans
E) Loans on Dwellings For 5+ Families
F) Non-occupant Loans on < 5 Family Dwellings (A B C & D)
2002 - 2018 National Fire Incident Reporting System (NFIRS) incidents
According to the data from the years 2002 - 2018 the average number of fire incidents per year is 123. The highest number of reported fires - 157 took place in 2008, and the least - 77 in 2017. The data has a dropping trend.
When looking into fire subcategories, the most reports belonged to: Structure Fires (55.8%), and Outside Fires (21.6%).
Fire incident types reported to NFIRS in Zip Code 33009


 Nearest zip codes: 33180, 33020, 33179, 33019, 33160, 33021.


 According to the data from the years 2002 - 2018 the average number of fire incidents per year is 123. The highest number of reported fires - 157 took place in 2008, and the least - 77 in 2017. The data has a dropping trend.
 When looking into fire subcategories, the most reports belonged to: Structure Fires (55.8%), and Outside Fires (21.6%).