Estimated zip code population in 2022: 13,883
Zip code population in 2010: 15,107
Zip code population in 2000: 17,432
Houses and condos: 12,884
Renter-occupied apartments: 1,620
% of renters here:
24%State:
33%
March 2022 cost of living index in zip code 33019: 112.0
(more than average, U.S. average is 100)
Land area: 3.9
sq. mi.
Water area: 2.7
sq. mi.
Population density: 3,523 people per square mile (average).
OSM Map
General Map
Google Map
MSN Map
OSM Map
General Map
Google Map
MSN Map
OSM Map
General Map
Google Map
MSN Map
OSM Map
General Map
Google Map
MSN Map
Please wait while loading the map...
Real estate property taxes paid for housing units in 2022:
This zip code:
1.0% ($7,526)Florida:
0.7% ($2,529)
Median real estate property taxes paid for housing units with mortgages in 2022: $8,397 (1.1%)
Median real estate property taxes paid for housing units with no mortgage in 2022: $6,568 (1.0%)
Profiles of local businesses
Business Search - 14 Million verified businesses
Males: 6,968 Females: 6,915
For population 25 years and over in 33019:
High school or higher: 98.3%Bachelor's degree or higher: 61.3%Graduate or professional degree: 31.1%Unemployed: 7.0%Mean travel time to work (commute): 30.4 minutes
For population 15 years and over in 33019:
Never married: 18.6%Now married: 60.4%Separated: 1.4%Widowed: 5.9%Divorced: 13.7%
Zip code 33019 compared to state average:
Median house value above state average. Unemployed percentage above state average. Black race population percentage significantly below state average. Median age significantly above state average. Foreign-born population percentage above state average. Length of stay since moving in significantly above state average. Number of rooms per house below state average. Percentage of population with a bachelor's degree or higher above state average. 8,937 64.4% White 4,091 29.5% Hispanic or Latino 382 2.8% Two or more races 322 2.3% Black 64 0.5% Some other race 52 0.4% Asian 32 0.2% American Indian
Data:
Median household income ($)
Median household income (% change since 2000)
Household income diversity
Ratio of average income to average house value (%)
Ratio of average income to average rent
Median household income ($) - White
Median household income ($) - Black or African American
Median household income ($) - Asian
Median household income ($) - Hispanic or Latino
Median household income ($) - American Indian and Alaska Native
Median household income ($) - Multirace
Median household income ($) - Other Race
Median household income for houses/condos with a mortgage ($)
Median household income for apartments without a mortgage ($)
Races - White alone (%)
Races - White alone (% change since 2000)
Races - Black alone (%)
Races - Black alone (% change since 2000)
Races - American Indian alone (%)
Races - American Indian alone (% change since 2000)
Races - Asian alone (%)
Races - Asian alone (% change since 2000)
Races - Hispanic (%)
Races - Hispanic (% change since 2000)
Races - Native Hawaiian and Other Pacific Islander alone (%)
Races - Native Hawaiian and Other Pacific Islander alone (% change since 2000)
Races - Two or more races (%)
Races - Two or more races (% change since 2000)
Races - Other race alone (%)
Races - Other race alone (% change since 2000)
Racial diversity
Unemployment (%)
Unemployment (% change since 2000)
Unemployment (%) - White
Unemployment (%) - Black or African American
Unemployment (%) - Asian
Unemployment (%) - Hispanic or Latino
Unemployment (%) - American Indian and Alaska Native
Unemployment (%) - Multirace
Unemployment (%) - Other Race
Population density (people per square mile)
Population - Males (%)
Population - Females (%)
Population - Males (%) - White
Population - Males (%) - Black or African American
Population - Males (%) - Asian
Population - Males (%) - Hispanic or Latino
Population - Males (%) - American Indian and Alaska Native
Population - Males (%) - Multirace
Population - Males (%) - Other Race
Population - Females (%) - White
Population - Females (%) - Black or African American
Population - Females (%) - Asian
Population - Females (%) - Hispanic or Latino
Population - Females (%) - American Indian and Alaska Native
Population - Females (%) - Multirace
Population - Females (%) - Other Race
Coronavirus confirmed cases (Apr 27, 2024)
Deaths caused by coronavirus (Apr 27, 2024)
Coronavirus confirmed cases (per 100k population) (Apr 27, 2024)
Deaths caused by coronavirus (per 100k population) (Apr 27, 2024)
Daily increase in number of cases (Apr 27, 2024)
Weekly increase in number of cases (Apr 27, 2024)
Cases doubled (in days) (Apr 27, 2024)
Hospitalized patients (Apr 18, 2022)
Negative test results (Apr 18, 2022)
Total test results (Apr 18, 2022)
COVID Vaccine doses distributed (per 100k population) (Sep 19, 2023)
COVID Vaccine doses administered (per 100k population) (Sep 19, 2023)
COVID Vaccine doses distributed (Sep 19, 2023)
COVID Vaccine doses administered (Sep 19, 2023)
Likely homosexual households (%)
Likely homosexual households (% change since 2000)
Likely homosexual households - Lesbian couples (%)
Likely homosexual households - Lesbian couples (% change since 2000)
Likely homosexual households - Gay men (%)
Likely homosexual households - Gay men (% change since 2000)
Cost of living index
Median gross rent ($)
Median contract rent ($)
Median monthly housing costs ($)
Median house or condo value ($)
Median house or condo value ($ change since 2000)
Mean house or condo value by units in structure - 1, detached ($)
Mean house or condo value by units in structure - 1, attached ($)
Mean house or condo value by units in structure - 2 ($)
Mean house or condo value by units in structure by units in structure - 3 or 4 ($)
Mean house or condo value by units in structure - 5 or more ($)
Mean house or condo value by units in structure - Boat, RV, van, etc. ($)
Mean house or condo value by units in structure - Mobile home ($)
Median house or condo value ($) - White
Median house or condo value ($) - Black or African American
Median house or condo value ($) - Asian
Median house or condo value ($) - Hispanic or Latino
Median house or condo value ($) - American Indian and Alaska Native
Median house or condo value ($) - Multirace
Median house or condo value ($) - Other Race
Median resident age
Resident age diversity
Median resident age - Males
Median resident age - Females
Median resident age - White
Median resident age - Black or African American
Median resident age - Asian
Median resident age - Hispanic or Latino
Median resident age - American Indian and Alaska Native
Median resident age - Multirace
Median resident age - Other Race
Median resident age - Males - White
Median resident age - Males - Black or African American
Median resident age - Males - Asian
Median resident age - Males - Hispanic or Latino
Median resident age - Males - American Indian and Alaska Native
Median resident age - Males - Multirace
Median resident age - Males - Other Race
Median resident age - Females - White
Median resident age - Females - Black or African American
Median resident age - Females - Asian
Median resident age - Females - Hispanic or Latino
Median resident age - Females - American Indian and Alaska Native
Median resident age - Females - Multirace
Median resident age - Females - Other Race
Commute - mean travel time to work (minutes)
Travel time to work - Less than 5 minutes (%)
Travel time to work - Less than 5 minutes (% change since 2000)
Travel time to work - 5 to 9 minutes (%)
Travel time to work - 5 to 9 minutes (% change since 2000)
Travel time to work - 10 to 19 minutes (%)
Travel time to work - 10 to 19 minutes (% change since 2000)
Travel time to work - 20 to 29 minutes (%)
Travel time to work - 20 to 29 minutes (% change since 2000)
Travel time to work - 30 to 39 minutes (%)
Travel time to work - 30 to 39 minutes (% change since 2000)
Travel time to work - 40 to 59 minutes (%)
Travel time to work - 40 to 59 minutes (% change since 2000)
Travel time to work - 60 to 89 minutes (%)
Travel time to work - 60 to 89 minutes (% change since 2000)
Travel time to work - 90 or more minutes (%)
Travel time to work - 90 or more minutes (% change since 2000)
Marital status - Never married (%)
Marital status - Now married (%)
Marital status - Separated (%)
Marital status - Widowed (%)
Marital status - Divorced (%)
Median family income ($)
Median family income (% change since 2000)
Median non-family income ($)
Median non-family income (% change since 2000)
Median per capita income ($)
Median per capita income (% change since 2000)
Median family income ($) - White
Median family income ($) - Black or African American
Median family income ($) - Asian
Median family income ($) - Hispanic or Latino
Median family income ($) - American Indian and Alaska Native
Median family income ($) - Multirace
Median family income ($) - Other Race
Median year house/condo built
Median year apartment built
Year house built - Built 2005 or later (%)
Year house built - Built 2000 to 2004 (%)
Year house built - Built 1990 to 1999 (%)
Year house built - Built 1980 to 1989 (%)
Year house built - Built 1970 to 1979 (%)
Year house built - Built 1960 to 1969 (%)
Year house built - Built 1950 to 1959 (%)
Year house built - Built 1940 to 1949 (%)
Year house built - Built 1939 or earlier (%)
Average household size
Household density (households per square mile)
Average household size - White
Average household size - Black or African American
Average household size - Asian
Average household size - Hispanic or Latino
Average household size - American Indian and Alaska Native
Average household size - Multirace
Average household size - Other Race
Occupied housing units (%)
Vacant housing units (%)
Owner occupied housing units (%)
Renter occupied housing units (%)
Vacancy status - For rent (%)
Vacancy status - For sale only (%)
Vacancy status - Rented or sold, not occupied (%)
Vacancy status - For seasonal, recreational, or occasional use (%)
Vacancy status - For migrant workers (%)
Vacancy status - Other vacant (%)
Residents with income below the poverty level (%)
Residents with income below 50% of the poverty level (%)
Children below poverty level (%)
Poor families by family type - Married-couple family (%)
Poor families by family type - Male, no wife present (%)
Poor families by family type - Female, no husband present (%)
Poverty status for native-born residents (%)
Poverty status for foreign-born residents (%)
Poverty among high school graduates not in families (%)
Poverty among people who did not graduate high school not in families (%)
Residents with income below the poverty level (%) - White
Residents with income below the poverty level (%) - Black or African American
Residents with income below the poverty level (%) - Asian
Residents with income below the poverty level (%) - Hispanic or Latino
Residents with income below the poverty level (%) - American Indian and Alaska Native
Residents with income below the poverty level (%) - Multirace
Residents with income below the poverty level (%) - Other Race
Air pollution - Air Quality Index (AQI)
Air pollution - CO
Air pollution - NO2
Air pollution - SO2
Air pollution - Ozone
Air pollution - PM10
Air pollution - PM25
Air pollution - Pb
Crime - Murders per 100,000 population
Crime - Rapes per 100,000 population
Crime - Robberies per 100,000 population
Crime - Assaults per 100,000 population
Crime - Burglaries per 100,000 population
Crime - Thefts per 100,000 population
Crime - Auto thefts per 100,000 population
Crime - Arson per 100,000 population
Crime - City-data.com crime index
Crime - Violent crime index
Crime - Property crime index
Crime - Murders per 100,000 population (5 year average)
Crime - Rapes per 100,000 population (5 year average)
Crime - Robberies per 100,000 population (5 year average)
Crime - Assaults per 100,000 population (5 year average)
Crime - Burglaries per 100,000 population (5 year average)
Crime - Thefts per 100,000 population (5 year average)
Crime - Auto thefts per 100,000 population (5 year average)
Crime - Arson per 100,000 population (5 year average)
Crime - City-data.com crime index (5 year average)
Crime - Violent crime index (5 year average)
Crime - Property crime index (5 year average)
1996 Presidential Elections Results (%) - Democratic Party (Clinton)
1996 Presidential Elections Results (%) - Republican Party (Dole)
1996 Presidential Elections Results (%) - Other
2000 Presidential Elections Results (%) - Democratic Party (Gore)
2000 Presidential Elections Results (%) - Republican Party (Bush)
2000 Presidential Elections Results (%) - Other
2004 Presidential Elections Results (%) - Democratic Party (Kerry)
2004 Presidential Elections Results (%) - Republican Party (Bush)
2004 Presidential Elections Results (%) - Other
2008 Presidential Elections Results (%) - Democratic Party (Obama)
2008 Presidential Elections Results (%) - Republican Party (McCain)
2008 Presidential Elections Results (%) - Other
2012 Presidential Elections Results (%) - Democratic Party (Obama)
2012 Presidential Elections Results (%) - Republican Party (Romney)
2012 Presidential Elections Results (%) - Other
2016 Presidential Elections Results (%) - Democratic Party (Clinton)
2016 Presidential Elections Results (%) - Republican Party (Trump)
2016 Presidential Elections Results (%) - Other
2020 Presidential Elections Results (%) - Democratic Party (Biden)
2020 Presidential Elections Results (%) - Republican Party (Trump)
2020 Presidential Elections Results (%) - Other
Ancestries Reported - Arab (%)
Ancestries Reported - Czech (%)
Ancestries Reported - Danish (%)
Ancestries Reported - Dutch (%)
Ancestries Reported - English (%)
Ancestries Reported - French (%)
Ancestries Reported - French Canadian (%)
Ancestries Reported - German (%)
Ancestries Reported - Greek (%)
Ancestries Reported - Hungarian (%)
Ancestries Reported - Irish (%)
Ancestries Reported - Italian (%)
Ancestries Reported - Lithuanian (%)
Ancestries Reported - Norwegian (%)
Ancestries Reported - Polish (%)
Ancestries Reported - Portuguese (%)
Ancestries Reported - Russian (%)
Ancestries Reported - Scotch-Irish (%)
Ancestries Reported - Scottish (%)
Ancestries Reported - Slovak (%)
Ancestries Reported - Subsaharan African (%)
Ancestries Reported - Swedish (%)
Ancestries Reported - Swiss (%)
Ancestries Reported - Ukrainian (%)
Ancestries Reported - United States (%)
Ancestries Reported - Welsh (%)
Ancestries Reported - West Indian (%)
Ancestries Reported - Other (%)
Educational Attainment - No schooling completed (%)
Educational Attainment - Less than high school (%)
Educational Attainment - High school or equivalent (%)
Educational Attainment - Less than 1 year of college (%)
Educational Attainment - 1 or more years of college (%)
Educational Attainment - Associate degree (%)
Educational Attainment - Bachelor's degree (%)
Educational Attainment - Master's degree (%)
Educational Attainment - Professional school degree (%)
Educational Attainment - Doctorate degree (%)
School Enrollment - Nursery, preschool (%)
School Enrollment - Kindergarten (%)
School Enrollment - Grade 1 to 4 (%)
School Enrollment - Grade 5 to 8 (%)
School Enrollment - Grade 9 to 12 (%)
School Enrollment - College undergrad (%)
School Enrollment - Graduate or professional (%)
School Enrollment - Not enrolled in school (%)
School enrollment - Public schools (%)
School enrollment - Private schools (%)
School enrollment - Not enrolled (%)
Median number of rooms in houses and condos
Median number of rooms in apartments
Housing units lacking complete plumbing facilities (%)
Housing units lacking complete kitchen facilities (%)
Density of houses
Urban houses (%)
Rural houses (%)
Households with people 60 years and over (%)
Households with people 65 years and over (%)
Households with people 75 years and over (%)
Households with one or more nonrelatives (%)
Households with no nonrelatives (%)
Population in households (%)
Family households (%)
Nonfamily households (%)
Population in families (%)
Family households with own children (%)
Median number of bedrooms in owner occupied houses
Mean number of bedrooms in owner occupied houses
Median number of bedrooms in renter occupied houses
Mean number of bedrooms in renter occupied houses
Median number of vehichles in owner occupied houses
Mean number of vehichles in owner occupied houses
Median number of vehichles in renter occupied houses
Mean number of vehichles in renter occupied houses
Mortgage status - with mortgage (%)
Mortgage status - with second mortgage (%)
Mortgage status - with home equity loan (%)
Mortgage status - with both second mortgage and home equity loan (%)
Mortgage status - without a mortgage (%)
Average family size
Average family size - White
Average family size - Black or African American
Average family size - Asian
Average family size - Hispanic or Latino
Average family size - American Indian and Alaska Native
Average family size - Multirace
Average family size - Other Race
Geographical mobility - Same house 1 year ago (%)
Geographical mobility - Moved within same county (%)
Geographical mobility - Moved from different county within same state (%)
Geographical mobility - Moved from different state (%)
Geographical mobility - Moved from abroad (%)
Place of birth - Born in state of residence (%)
Place of birth - Born in other state (%)
Place of birth - Native, outside of US (%)
Place of birth - Foreign born (%)
Housing units in structures - 1, detached (%)
Housing units in structures - 1, attached (%)
Housing units in structures - 2 (%)
Housing units in structures - 3 or 4 (%)
Housing units in structures - 5 to 9 (%)
Housing units in structures - 10 to 19 (%)
Housing units in structures - 20 to 49 (%)
Housing units in structures - 50 or more (%)
Housing units in structures - Mobile home (%)
Housing units in structures - Boat, RV, van, etc. (%)
House/condo owner moved in on average (years ago)
Renter moved in on average (years ago)
Year householder moved into unit - Moved in 1999 to March 2000 (%)
Year householder moved into unit - Moved in 1995 to 1998 (%)
Year householder moved into unit - Moved in 1990 to 1994 (%)
Year householder moved into unit - Moved in 1980 to 1989 (%)
Year householder moved into unit - Moved in 1970 to 1979 (%)
Year householder moved into unit - Moved in 1969 or earlier (%)
Means of transportation to work - Drove car alone (%)
Means of transportation to work - Carpooled (%)
Means of transportation to work - Public transportation (%)
Means of transportation to work - Bus or trolley bus (%)
Means of transportation to work - Streetcar or trolley car (%)
Means of transportation to work - Subway or elevated (%)
Means of transportation to work - Railroad (%)
Means of transportation to work - Ferryboat (%)
Means of transportation to work - Taxicab (%)
Means of transportation to work - Motorcycle (%)
Means of transportation to work - Bicycle (%)
Means of transportation to work - Walked (%)
Means of transportation to work - Other means (%)
Working at home (%)
Industry diversity
Most Common Industries - Agriculture, forestry, fishing and hunting, and mining (%)
Most Common Industries - Agriculture, forestry, fishing and hunting (%)
Most Common Industries - Mining, quarrying, and oil and gas extraction (%)
Most Common Industries - Construction (%)
Most Common Industries - Manufacturing (%)
Most Common Industries - Wholesale trade (%)
Most Common Industries - Retail trade (%)
Most Common Industries - Transportation and warehousing, and utilities (%)
Most Common Industries - Transportation and warehousing (%)
Most Common Industries - Utilities (%)
Most Common Industries - Information (%)
Most Common Industries - Finance and insurance, and real estate and rental and leasing (%)
Most Common Industries - Finance and insurance (%)
Most Common Industries - Real estate and rental and leasing (%)
Most Common Industries - Professional, scientific, and management, and administrative and waste management services (%)
Most Common Industries - Professional, scientific, and technical services (%)
Most Common Industries - Management of companies and enterprises (%)
Most Common Industries - Administrative and support and waste management services (%)
Most Common Industries - Educational services, and health care and social assistance (%)
Most Common Industries - Educational services (%)
Most Common Industries - Health care and social assistance (%)
Most Common Industries - Arts, entertainment, and recreation, and accommodation and food services (%)
Most Common Industries - Arts, entertainment, and recreation (%)
Most Common Industries - Accommodation and food services (%)
Most Common Industries - Other services, except public administration (%)
Most Common Industries - Public administration (%)
Occupation diversity
Most Common Occupations - Management, business, science, and arts occupations (%)
Most Common Occupations - Management, business, and financial occupations (%)
Most Common Occupations - Management occupations (%)
Most Common Occupations - Business and financial operations occupations (%)
Most Common Occupations - Computer, engineering, and science occupations (%)
Most Common Occupations - Computer and mathematical occupations (%)
Most Common Occupations - Architecture and engineering occupations (%)
Most Common Occupations - Life, physical, and social science occupations (%)
Most Common Occupations - Education, legal, community service, arts, and media occupations (%)
Most Common Occupations - Community and social service occupations (%)
Most Common Occupations - Legal occupations (%)
Most Common Occupations - Education, training, and library occupations (%)
Most Common Occupations - Arts, design, entertainment, sports, and media occupations (%)
Most Common Occupations - Healthcare practitioners and technical occupations (%)
Most Common Occupations - Health diagnosing and treating practitioners and other technical occupations (%)
Most Common Occupations - Health technologists and technicians (%)
Most Common Occupations - Service occupations (%)
Most Common Occupations - Healthcare support occupations (%)
Most Common Occupations - Protective service occupations (%)
Most Common Occupations - Fire fighting and prevention, and other protective service workers including supervisors (%)
Most Common Occupations - Law enforcement workers including supervisors (%)
Most Common Occupations - Food preparation and serving related occupations (%)
Most Common Occupations - Building and grounds cleaning and maintenance occupations (%)
Most Common Occupations - Personal care and service occupations (%)
Most Common Occupations - Sales and office occupations (%)
Most Common Occupations - Sales and related occupations (%)
Most Common Occupations - Office and administrative support occupations (%)
Most Common Occupations - Natural resources, construction, and maintenance occupations (%)
Most Common Occupations - Farming, fishing, and forestry occupations (%)
Most Common Occupations - Construction and extraction occupations (%)
Most Common Occupations - Installation, maintenance, and repair occupations (%)
Most Common Occupations - Production, transportation, and material moving occupations (%)
Most Common Occupations - Production occupations (%)
Most Common Occupations - Transportation occupations (%)
Most Common Occupations - Material moving occupations (%)
People in Group quarters - Institutionalized population (%)
People in Group quarters - Correctional institutions (%)
People in Group quarters - Federal prisons and detention centers (%)
People in Group quarters - Halfway houses (%)
People in Group quarters - Local jails and other confinement facilities (including police lockups) (%)
People in Group quarters - Military disciplinary barracks (%)
People in Group quarters - State prisons (%)
People in Group quarters - Other types of correctional institutions (%)
People in Group quarters - Nursing homes (%)
People in Group quarters - Hospitals/wards, hospices, and schools for the handicapped (%)
People in Group quarters - Hospitals/wards and hospices for chronically ill (%)
People in Group quarters - Hospices or homes for chronically ill (%)
People in Group quarters - Military hospitals or wards for chronically ill (%)
People in Group quarters - Other hospitals or wards for chronically ill (%)
People in Group quarters - Hospitals or wards for drug/alcohol abuse (%)
People in Group quarters - Mental (Psychiatric) hospitals or wards (%)
People in Group quarters - Schools, hospitals, or wards for the mentally retarded (%)
People in Group quarters - Schools, hospitals, or wards for the physically handicapped (%)
People in Group quarters - Institutions for the deaf (%)
People in Group quarters - Institutions for the blind (%)
People in Group quarters - Orthopedic wards and institutions for the physically handicapped (%)
People in Group quarters - Wards in general hospitals for patients who have no usual home elsewhere (%)
People in Group quarters - Wards in military hospitals for patients who have no usual home elsewhere (%)
People in Group quarters - Juvenile institutions (%)
People in Group quarters - Long-term care (%)
People in Group quarters - Homes for abused, dependent, and neglected children (%)
People in Group quarters - Residential treatment centers for emotionally disturbed children (%)
People in Group quarters - Training schools for juvenile delinquents (%)
People in Group quarters - Short-term care, detention or diagnostic centers for delinquent children (%)
People in Group quarters - Type of juvenile institution unknown (%)
People in Group quarters - Noninstitutionalized population (%)
People in Group quarters - College dormitories (includes college quarters off campus) (%)
People in Group quarters - Military quarters (%)
People in Group quarters - On base (%)
People in Group quarters - Barracks, unaccompanied personnel housing (UPH), (Enlisted/Officer), ;and similar group living quarters for military personnel (%)
People in Group quarters - Transient quarters for temporary residents (%)
People in Group quarters - Military ships (%)
People in Group quarters - Group homes (%)
People in Group quarters - Homes or halfway houses for drug/alcohol abuse (%)
People in Group quarters - Homes for the mentally ill (%)
People in Group quarters - Homes for the mentally retarded (%)
People in Group quarters - Homes for the physically handicapped (%)
People in Group quarters - Other group homes (%)
People in Group quarters - Religious group quarters (%)
People in Group quarters - Dormitories (%)
People in Group quarters - Agriculture workers' dormitories on farms (%)
People in Group quarters - Job Corps and vocational training facilities (%)
People in Group quarters - Other workers' dormitories (%)
People in Group quarters - Crews of maritime vessels (%)
People in Group quarters - Other nonhousehold living situations (%)
People in Group quarters - Other noninstitutional group quarters (%)
Residents speaking English at home (%)
Residents speaking English at home - Born in the United States (%)
Residents speaking English at home - Native, born elsewhere (%)
Residents speaking English at home - Foreign born (%)
Residents speaking Spanish at home (%)
Residents speaking Spanish at home - Born in the United States (%)
Residents speaking Spanish at home - Native, born elsewhere (%)
Residents speaking Spanish at home - Foreign born (%)
Residents speaking other language at home (%)
Residents speaking other language at home - Born in the United States (%)
Residents speaking other language at home - Native, born elsewhere (%)
Residents speaking other language at home - Foreign born (%)
Class of Workers - Employee of private company (%)
Class of Workers - Self-employed in own incorporated business (%)
Class of Workers - Private not-for-profit wage and salary workers (%)
Class of Workers - Local government workers (%)
Class of Workers - State government workers (%)
Class of Workers - Federal government workers (%)
Class of Workers - Self-employed workers in own not incorporated business and Unpaid family workers (%)
House heating fuel used in houses and condos - Utility gas (%)
House heating fuel used in houses and condos - Bottled, tank, or LP gas (%)
House heating fuel used in houses and condos - Electricity (%)
House heating fuel used in houses and condos - Fuel oil, kerosene, etc. (%)
House heating fuel used in houses and condos - Coal or coke (%)
House heating fuel used in houses and condos - Wood (%)
House heating fuel used in houses and condos - Solar energy (%)
House heating fuel used in houses and condos - Other fuel (%)
House heating fuel used in houses and condos - No fuel used (%)
House heating fuel used in apartments - Utility gas (%)
House heating fuel used in apartments - Bottled, tank, or LP gas (%)
House heating fuel used in apartments - Electricity (%)
House heating fuel used in apartments - Fuel oil, kerosene, etc. (%)
House heating fuel used in apartments - Coal or coke (%)
House heating fuel used in apartments - Wood (%)
House heating fuel used in apartments - Solar energy (%)
House heating fuel used in apartments - Other fuel (%)
House heating fuel used in apartments - No fuel used (%)
Armed forces status - In Armed Forces (%)
Armed forces status - Civilian (%)
Armed forces status - Civilian - Veteran (%)
Armed forces status - Civilian - Nonveteran (%)
Fatal accidents locations in years 2005-2021
Fatal accidents locations in 2005
Fatal accidents locations in 2006
Fatal accidents locations in 2007
Fatal accidents locations in 2008
Fatal accidents locations in 2009
Fatal accidents locations in 2010
Fatal accidents locations in 2011
Fatal accidents locations in 2012
Fatal accidents locations in 2013
Fatal accidents locations in 2014
Fatal accidents locations in 2015
Fatal accidents locations in 2016
Fatal accidents locations in 2017
Fatal accidents locations in 2018
Fatal accidents locations in 2019
Fatal accidents locations in 2020
Fatal accidents locations in 2021
Alcohol use - People drinking some alcohol every month (%)
Alcohol use - People not drinking at all (%)
Alcohol use - Average days/month drinking alcohol
Alcohol use - Average drinks/week
Alcohol use - Average days/year people drink much
Audiometry - Average condition of hearing (%)
Audiometry - People that can hear a whisper from across a quiet room (%)
Audiometry - People that can hear normal voice from across a quiet room (%)
Audiometry - Ears ringing, roaring, buzzing (%)
Audiometry - Had a job exposure to loud noise (%)
Audiometry - Had off-work exposure to loud noise (%)
Blood Pressure & Cholesterol - Has high blood pressure (%)
Blood Pressure & Cholesterol - Checking blood pressure at home (%)
Blood Pressure & Cholesterol - Frequently checking blood cholesterol (%)
Blood Pressure & Cholesterol - Has high cholesterol level (%)
Consumer Behavior - Money monthly spent on food at supermarket/grocery store
Consumer Behavior - Money monthly spent on food at other stores
Consumer Behavior - Money monthly spent on eating out
Consumer Behavior - Money monthly spent on carryout/delivered foods
Consumer Behavior - Income spent on food at supermarket/grocery store (%)
Consumer Behavior - Income spent on food at other stores (%)
Consumer Behavior - Income spent on eating out (%)
Consumer Behavior - Income spent on carryout/delivered foods (%)
Current Health Status - General health condition (%)
Current Health Status - Blood donors (%)
Current Health Status - Has blood ever tested for HIV virus (%)
Current Health Status - Left-handed people (%)
Dermatology - People using sunscreen (%)
Diabetes - Diabetics (%)
Diabetes - Had a blood test for high blood sugar (%)
Diabetes - People taking insulin (%)
Diet Behavior & Nutrition - Diet health (%)
Diet Behavior & Nutrition - Milk product consumption (# of products/month)
Diet Behavior & Nutrition - Meals not home prepared (#/week)
Diet Behavior & Nutrition - Meals from fast food or pizza place (#/week)
Diet Behavior & Nutrition - Ready-to-eat foods (#/month)
Diet Behavior & Nutrition - Frozen meals/pizza (#/month)
Drug Use - People that ever used marijuana or hashish (%)
Drug Use - Ever used hard drugs (%)
Drug Use - Ever used any form of cocaine (%)
Drug Use - Ever used heroin (%)
Drug Use - Ever used methamphetamine (%)
Health Insurance - People covered by health insurance (%)
Kidney Conditions-Urology - Avg. # of times urinating at night
Medical Conditions - People with asthma (%)
Medical Conditions - People with anemia (%)
Medical Conditions - People with psoriasis (%)
Medical Conditions - People with overweight (%)
Medical Conditions - Elderly people having difficulties in thinking or remembering (%)
Medical Conditions - People who ever received blood transfusion (%)
Medical Conditions - People having trouble seeing even with glass/contacts (%)
Medical Conditions - People with arthritis (%)
Medical Conditions - People with gout (%)
Medical Conditions - People with congestive heart failure (%)
Medical Conditions - People with coronary heart disease (%)
Medical Conditions - People with angina pectoris (%)
Medical Conditions - People who ever had heart attack (%)
Medical Conditions - People who ever had stroke (%)
Medical Conditions - People with emphysema (%)
Medical Conditions - People with thyroid problem (%)
Medical Conditions - People with chronic bronchitis (%)
Medical Conditions - People with any liver condition (%)
Medical Conditions - People who ever had cancer or malignancy (%)
Mental Health - People who have little interest in doing things (%)
Mental Health - People feeling down, depressed, or hopeless (%)
Mental Health - People who have trouble sleeping or sleeping too much (%)
Mental Health - People feeling tired or having little energy (%)
Mental Health - People with poor appetite or overeating (%)
Mental Health - People feeling bad about themself (%)
Mental Health - People who have trouble concentrating on things (%)
Mental Health - People moving or speaking slowly or too fast (%)
Mental Health - People having thoughts they would be better off dead (%)
Oral Health - Average years since last visit a dentist
Oral Health - People embarrassed because of mouth (%)
Oral Health - People with gum disease (%)
Oral Health - General health of teeth and gums (%)
Oral Health - Average days a week using dental floss/device
Oral Health - Average days a week using mouthwash for dental problem
Oral Health - Average number of teeth
Pesticide Use - Households using pesticides to control insects (%)
Pesticide Use - Households using pesticides to kill weeds (%)
Physical Activity - People doing vigorous-intensity work activities (%)
Physical Activity - People doing moderate-intensity work activities (%)
Physical Activity - People walking or bicycling (%)
Physical Activity - People doing vigorous-intensity recreational activities (%)
Physical Activity - People doing moderate-intensity recreational activities (%)
Physical Activity - Average hours a day doing sedentary activities
Physical Activity - Average hours a day watching TV or videos
Physical Activity - Average hours a day using computer
Physical Functioning - People having limitations keeping them from working (%)
Physical Functioning - People limited in amount of work they can do (%)
Physical Functioning - People that need special equipment to walk (%)
Physical Functioning - People experiencing confusion/memory problems (%)
Physical Functioning - People requiring special healthcare equipment (%)
Prescription Medications - Average number of prescription medicines taking
Preventive Aspirin Use - Adults 40+ taking low-dose aspirin (%)
Reproductive Health - Vaginal deliveries (%)
Reproductive Health - Cesarean deliveries (%)
Reproductive Health - Deliveries resulted in a live birth (%)
Reproductive Health - Pregnancies resulted in a delivery (%)
Reproductive Health - Women breastfeeding newborns (%)
Reproductive Health - Women that had a hysterectomy (%)
Reproductive Health - Women that had both ovaries removed (%)
Reproductive Health - Women that have ever taken birth control pills (%)
Reproductive Health - Women taking birth control pills (%)
Reproductive Health - Women that have ever used Depo-Provera or injectables (%)
Reproductive Health - Women that have ever used female hormones (%)
Sexual Behavior - People 18+ that ever had sex (vaginal, anal, or oral) (%)
Sexual Behavior - Males 18+ that ever had vaginal sex with a woman (%)
Sexual Behavior - Males 18+ that ever performed oral sex on a woman (%)
Sexual Behavior - Males 18+ that ever had anal sex with a woman (%)
Sexual Behavior - Males 18+ that ever had any sex with a man (%)
Sexual Behavior - Females 18+ that ever had vaginal sex with a man (%)
Sexual Behavior - Females 18+ that ever performed oral sex on a man (%)
Sexual Behavior - Females 18+ that ever had anal sex with a man (%)
Sexual Behavior - Females 18+ that ever had any kind of sex with a woman (%)
Sexual Behavior - Average age people first had sex
Sexual Behavior - Average number of female sex partners in lifetime (males 18+)
Sexual Behavior - Average number of female vaginal sex partners in lifetime (males 18+)
Sexual Behavior - Average age people first performed oral sex on a woman (18+)
Sexual Behavior - Average number of woman performed oral sex on in lifetime (18+)
Sexual Behavior - Average number of male sex partners in lifetime (males 18+)
Sexual Behavior - Average number of male anal sex partners in lifetime (males 18+)
Sexual Behavior - Average age people first performed oral sex on a man (18+)
Sexual Behavior - Average number of male oral sex partners in lifetime (18+)
Sexual Behavior - People using protection when performing oral sex (%)
Sexual Behavior - Average number of times people have vaginal or anal sex a year
Sexual Behavior - People having sex without condom (%)
Sexual Behavior - Average number of male sex partners in lifetime (females 18+)
Sexual Behavior - Average number of male vaginal sex partners in lifetime (females 18+)
Sexual Behavior - Average number of female sex partners in lifetime (females 18+)
Sexual Behavior - Circumcised males 18+ (%)
Sleep Disorders - Average hours sleeping at night
Sleep Disorders - People that has trouble sleeping (%)
Smoking-Cigarette Use - People smoking cigarettes (%)
Taste & Smell - People 40+ having problems with smell (%)
Taste & Smell - People 40+ having problems with taste (%)
Taste & Smell - People 40+ that ever had wisdom teeth removed (%)
Taste & Smell - People 40+ that ever had tonsils teeth removed (%)
Taste & Smell - People 40+ that ever had a loss of consciousness because of a head injury (%)
Taste & Smell - People 40+ that ever had a broken nose or other serious injury to face or skull (%)
Taste & Smell - People 40+ that ever had two or more sinus infections (%)
Weight - Average height (inches)
Weight - Average weight (pounds)
Weight - Average BMI
Weight - People that are obese (%)
Weight - People that ever were obese (%)
Weight - People trying to lose weight (%)
100%
urban population.
Estimated median house/condo value in 2022: $736,072
33019:
$736,072Florida:
$354,100
According to our research of Florida and other state lists, there was 1 registered sex offender living in 33019 zip code as of April 27, 2024 . The ratio of all residents to sex offenders in zip code 33019 is 15,137 to 1.The ratio of registered sex offenders to all residents in this zip code is much lower than the state average.
Median resident age: This zip code:
54.7 yearsFlorida median age:
42.7 years
Average household size: This zip code:
2.1 peopleFlorida:
2.5 people
Averages for the 2020 tax year for zip code 33019, filed in 2021:
Average Adjusted Gross Income (AGI) in 2020: $182,417 (Individual Income Tax Returns) Here:
$182,417State:
$82,200
Salary/wage: $122,964 (reported on 63.2% of returns )Here:
$122,964State:
$58,347
(% of AGI for various income ranges: 993.2% for AGIs below $25k , 3412.0% for AGIs $25k-50k , 6605.3% for AGIs $50k-75k , 9955.3% for AGIs $75k-100k , 18030.9% for AGIs $100k-200k , 125371.9% for AGIs over 200k ) Taxable interest for individuals: $13,088 (reported on 46.7% of returns )This zip code:
$13,088Florida:
$4,272
(% of AGI for various income ranges: 117.6% for AGIs below $25k , 166.2% for AGIs $25k-50k , 248.2% for AGIs $50k-75k , 401.2% for AGIs $75k-100k , 981.7% for AGIs $100k-200k , 11547.4% for AGIs over 200k ) Ordinary dividends: $22,239 (reported on 39.6% of returns )Here:
$22,239State:
$15,863
(% of AGI for various income ranges: 129.8% for AGIs below $25k , 289.4% for AGIs $25k-50k , 460.0% for AGIs $50k-75k , 783.1% for AGIs $75k-100k , 1753.8% for AGIs $100k-200k , 15674.5% for AGIs over 200k ) Net capital gain/loss in AGI: +$82,956 (reported on 41.0% of returns )Here:
+$82,956State:
+$62,983
(% of AGI for various income ranges: 82.8% for AGIs below $25k , 252.7% for AGIs $25k-50k , 465.9% for AGIs $50k-75k , 641.6% for AGIs $75k-100k , 2389.2% for AGIs $100k-200k , 76291.9% for AGIs over 200k ) Profit/loss from business: +$18,085 (reported on 25.5% of returns )Here:
+$18,085State:
+$9,719
(% of AGI for various income ranges: 454.7% for AGIs below $25k , 506.2% for AGIs $25k-50k , 482.0% for AGIs $50k-75k , 578.4% for AGIs $75k-100k , 893.0% for AGIs $100k-200k , 5452.6% for AGIs over 200k ) Taxable individual retirement arrangement distribution: $37,095 (reported on 12.6% of returns )33019:
$37,095Florida:
$24,823
(% of AGI for various income ranges: 104.2% for AGIs below $25k , 234.9% for AGIs $25k-50k , 407.5% for AGIs $50k-75k , 766.9% for AGIs $75k-100k , 1419.8% for AGIs $100k-200k , 6557.1% for AGIs over 200k ) Self-employed (Keogh) retirement plans: $35,189 (reported on 1.2% of returns )33019:
$35,189Florida:
$29,694
(% of AGI for various income ranges: 96.6% for AGIs $100k-200k , 856.5% for AGIs over 200k ) Total itemized deductions: $51,751 (reported on 18.1% of returns )Here:
$51,751State:
$45,393
(% of AGI for various income ranges: 173.9% for AGIs below $25k , 375.2% for AGIs $25k-50k , 762.5% for AGIs $50k-75k , 1189.4% for AGIs $75k-100k , 2010.2% for AGIs $100k-200k , 15286.1% for AGIs over 200k ) Charity contributions: $18,405 (reported on 15.1% of returns )Here:
$18,405State:
$20,178
(% of AGI for various income ranges: 7.5% for AGIs below $25k , 34.8% for AGIs $25k-50k , 76.3% for AGIs $50k-75k , 195.0% for AGIs $75k-100k , 345.5% for AGIs $100k-200k , 5743.5% for AGIs over 200k ) Taxes paid: $8,552 (reported on 18.1% of returns )(% of AGI for various income ranges: 40.4% for AGIs below $25k , 77.5% for AGIs $25k-50k , 199.6% for AGIs $50k-75k , 320.6% for AGIs $75k-100k , 486.4% for AGIs $100k-200k , 1934.8% for AGIs over 200k ) Earned income credit: $1,569 (reported on 9.8% of returns )(% of AGI for various income ranges: 73.7% for AGIs below $25k , 45.2% for AGIs $25k-50k ) Percentage of individuals using paid preparers for their 2020 taxes: 90.3%(% for various income ranges: 88.6% for AGIs below $25k , 89.2% for AGIs $25k-50k , 88.3% for AGIs $50k-75k , 89.6% for AGIs $75k-100k , 93.0% for AGIs $100k-200k , 93.2% for AGIs over 200k )
Averages for the 2012 tax year for zip code 33019, filed in 2013:
Average Adjusted Gross Income (AGI) in 2012: $110,947 (Individual Income Tax Returns) Here:
$110,947State:
$60,316
Salary/wage: $81,081 (reported on 68.6% of returns )Here:
$81,081State:
$45,277
(% of AGI for various income ranges: 61.0% for AGIs below $25k , 67.4% for AGIs $25k-50k , 63.9% for AGIs $50k-75k , 62.2% for AGIs $75k-100k , 62.6% for AGIs $100k-200k , 40.7% for AGIs over 200k ) Taxable interest for individuals: $9,129 (reported on 45.5% of returns )This zip code:
$9,129Florida:
$3,587
(% of AGI for various income ranges: 5.1% for AGIs below $25k , 3.5% for AGIs $25k-50k , 2.7% for AGIs $50k-75k , 2.5% for AGIs $75k-100k , 1.9% for AGIs $100k-200k , 4.5% for AGIs over 200k ) Ordinary dividends: $23,785 (reported on 35.1% of returns )Here:
$23,785State:
$12,831
(% of AGI for various income ranges: 6.9% for AGIs below $25k , 5.0% for AGIs $25k-50k , 4.6% for AGIs $50k-75k , 4.5% for AGIs $75k-100k , 4.1% for AGIs $100k-200k , 9.6% for AGIs over 200k ) Net capital gain/loss in AGI: +$34,232 (reported on 34.1% of returns )Here:
+$34,232State:
+$33,493
(% of AGI for various income ranges: 0.6% for AGIs $25k-50k , 1.4% for AGIs $50k-75k , 1.3% for AGIs $75k-100k , 1.7% for AGIs $100k-200k , 17.1% for AGIs over 200k ) Profit/loss from business: +$13,486 (reported on 22.3% of returns )Here:
+$13,486State:
+$10,012
(% of AGI for various income ranges: 14.9% for AGIs below $25k , 5.1% for AGIs $25k-50k , 3.4% for AGIs $50k-75k , 2.4% for AGIs $75k-100k , 3.4% for AGIs $100k-200k , 1.5% for AGIs over 200k ) Taxable individual retirement arrangement distribution: $31,198 (reported on 13.8% of returns )33019:
$31,198Florida:
$21,544
(% of AGI for various income ranges: 4.5% for AGIs below $25k , 3.0% for AGIs $25k-50k , 4.4% for AGIs $50k-75k , 4.2% for AGIs $75k-100k , 5.5% for AGIs $100k-200k , 3.4% for AGIs over 200k ) Self-employment retirement plans: $19,557 (reported on 0.9% of returns )33019:
$19,557Florida:
$20,611
Total itemized deductions: $38,997 (19% of AGI, reported on 41.2% of returns )Here:
$38,997State:
$25,533
Here:
19.0% of AGIState:
18.0% of AGI
(% of AGI for various income ranges: 21.9% for AGIs below $25k , 15.7% for AGIs $25k-50k , 15.3% for AGIs $50k-75k , 15.2% for AGIs $75k-100k , 14.8% for AGIs $100k-200k , 13.6% for AGIs over 200k ) Charity contributions: $5,467 (reported on 33.7% of returns )(% of AGI for various income ranges: 0.9% for AGIs below $25k , 1.3% for AGIs $25k-50k , 1.2% for AGIs $50k-75k , 1.7% for AGIs $75k-100k , 1.6% for AGIs $100k-200k , 1.8% for AGIs over 200k ) Taxes paid: $11,312 (reported on 40.5% of returns )33019:
$11,312State:
$6,203
(% of AGI for various income ranges: 5.5% for AGIs below $25k , 4.1% for AGIs $25k-50k , 4.2% for AGIs $50k-75k , 4.4% for AGIs $75k-100k , 4.8% for AGIs $100k-200k , 3.8% for AGIs over 200k ) Earned income credit: $1,462 (reported on 10.1% of returns )(% of AGI for various income ranges: 3.3% for AGIs below $25k , 0.3% for AGIs $25k-50k ) Percentage of individuals using paid preparers for their 2012 taxes: 69.2%(% for various income ranges: 63.2% for AGIs below $25k , 66.4% for AGIs $25k-50k , 68.9% for AGIs $50k-75k , 69.6% for AGIs $75k-100k , 74.8% for AGIs $100k-200k , 85.9% for AGIs over 200k )
Averages for the 2004 tax year for zip code 33019, filed in 2005:
Average Adjusted Gross Income (AGI) in 2004: $92,465 (Individual Income Tax Returns) Here:
$92,465State:
$50,523
Salary/wage: $71,905 (reported on 67.7% of returns )Here:
$71,905State:
$39,563
(% of AGI for various income ranges: 59.1% for AGIs $10k-25k , 68.5% for AGIs $25k-50k , 63.0% for AGIs $50k-75k , 64.7% for AGIs $75k-100k , 46.2% for AGIs over 100k ) Taxable interest for individuals: $6,947 (reported on 61.7% of returns )This zip code:
$6,947Florida:
$3,211
(% of AGI for various income ranges: 9.8% for AGIs $10k-25k , 5.8% for AGIs $25k-50k , 5.4% for AGIs $50k-75k , 4.6% for AGIs $75k-100k , 3.8% for AGIs over 100k ) Taxable dividends: $10,876 (reported on 43.8% of returns )(% of AGI for various income ranges: 6.7% for AGIs $10k-25k , 4.3% for AGIs $25k-50k , 4.0% for AGIs $50k-75k , 3.8% for AGIs $75k-100k , 5.2% for AGIs over 100k ) Net capital gain/loss: +$35,172 (reported on 43.6% of returns )Here:
+$35,172State:
+$27,205
(% of AGI for various income ranges: 0.3% for AGIs $10k-25k , 0.7% for AGIs $25k-50k , 2.3% for AGIs $50k-75k , 4.1% for AGIs $75k-100k , 21.9% for AGIs over 100k ) Profit/loss from business: +$16,660 (reported on 20.2% of returns )Here:
+$16,660State:
+$10,634
(% of AGI for various income ranges: 8.8% for AGIs $10k-25k , 5.0% for AGIs $25k-50k , 5.3% for AGIs $50k-75k , 3.9% for AGIs $75k-100k , 2.7% for AGIs over 100k ) IRA payment deduction: $3,712 (reported on 4.6% of returns )33019:
$3,712Florida:
$3,082
(% of AGI for various income ranges: 0.5% for AGIs $10k-25k , 0.3% for AGIs $25k-50k , 0.3% for AGIs $50k-75k , 0.2% for AGIs $75k-100k , 0.1% for AGIs over 100k ) Self-employed pension: $17,145 (reported on 1.2% of returns )Here:
$17,145Florida:
$15,857
Total itemized deductions: $25,783 (18% of AGI, reported on 48.0% of returns )Here:
$25,783State:
$20,370
Here:
17.9% of AGIState:
20.7% of AGI
(% of AGI for various income ranges: 24.1% for AGIs $10k-25k , 19.9% for AGIs $25k-50k , 20.1% for AGIs $50k-75k , 19.6% for AGIs $75k-100k , 10.1% for AGIs over 100k ) Charity contributions deductions: $4,025 (3% of AGI, reported on 41.6% of returns )Here:
2.6% of AGIState:
3.8% of AGI
(% of AGI for various income ranges: 1.5% for AGIs $10k-25k , 1.6% for AGIs $25k-50k , 1.9% for AGIs $50k-75k , 1.8% for AGIs $75k-100k , 1.8% for AGIs over 100k ) Total tax: $20,705 (reported on 81.4% of returns )33019:
$20,705State:
$9,431
(% of AGI for various income ranges: 4.9% for AGIs $10k-25k , 8.1% for AGIs $25k-50k , 11.0% for AGIs $50k-75k , 12.1% for AGIs $75k-100k , 21.1% for AGIs over 100k ) Earned income credit: $1,090 (reported on 7.3% of returns )Percentage of individuals using paid preparers for their 2004 taxes: 73.2%(% for various income ranges: 70.8% for AGIs below $10k , 71.3% for AGIs $10k-25k , 69.1% for AGIs $25k-50k , 71.3% for AGIs $50k-75k , 75.0% for AGIs $75k-100k , 81.3% for AGIs over 100k )
Estimated median household income in 2022: This zip code:
$92,600Florida:
$69,303
Nearest zip codes: 33020 ,
33004 ,
33009 ,
33021 ,
33315 ,
33316 .
Hollywood Zip Code Map
Percentage of family households: This zip code:
32.6%Florida:
41.2%
Percentage of households with unmarried partners: This zip code:
6.5%Florida:
46.7%
Likely homosexual households (counted as self-reported same-sex unmarried-partner households)
Lesbian couples: 0.6% of all households Gay men: 0.7% of all households
Household received Food Stamps/SNAP in the past 12 months: 290Household did not receive Food Stamps/SNAP in the past 12 months: 6,434
Women who had a birth in the past 12 months: 61 (59 now married , 4 unmarried) Women who did not have a birth in the past 12 months: 2,372 (1,192 now married , 1,180 unmarried)
Housing units in zip code 33019 with a mortgage: 2,841 (425
second mortgage , 364
both second mortgage and home equity loan )
Houses without a mortgage: 116
Median monthly owner costs for units with a mortgage: $3,402
Median monthly owner costs for units without a mortgage: $1,340
Residents with income below the poverty level in 2022:
This zip code:
6.4%Whole state:
12.7%
Residents with income below 50% of the poverty level in 2022:
This zip code:
2.6%Whole state:
6.6%
Median number of rooms in houses and condos: Median number of rooms in apartments: Notable locations in this zip code not listed on our city pages
Click to draw/clear zip code borders Notable locations in zip code 33019: (A) , Hollywood Beach Fire Station (B) , Hollywood Beach Library (C) , Hollywood Beach-Bernice P Oster Reading Center (D) , Hallandale Fire Station (E) , Hollywood Fire Rescue and Beach Safety Department Station 40 (F) . Display/hide their locations on the map
Churches in zip code 33019 include: (A) , First Baptist Church of Hollywood (B) , All American Memorial Church (C) . Display/hide their locations on the map
Lakes: (A) , North Lake (B) , West Lake (C) . Display/hide their locations on the map
Parks in zip code 33019 include: (1) , West Lake Park (2) , Holland Park (3) , Anne Kolb Nature Center (4) , Hollywood North Beach Park (5) . Display/hide their locations on the map
Beach: (A) . Display/hide its location on the map
Tourist attractions (not listed on the city page) :
Year house built (houses)
0 2020 or later288 2010 to 20191,383 2000 to 20091,163 1990 to 19991,575 1980 to 19893,153 1970 to 19792,998 1960 to 19691,306 1950 to 1959208 1940 to 1949210 1939 or earlier
Zip code 33019 household income distribution in 2022 348 Less than $10,000144 $10,000 to $14,999161 $15,000 to $19,999175 $20,000 to $24,999315 $25,000 to $29,999265 $30,000 to $34,999266 $35,000 to $39,999195 $40,000 to $44,999146 $45,000 to $49,999341 $50,000 to $59,999382 $60,000 to $74,999946 $75,000 to $99,999581 $100,000 to $124,999310 $125,000 to $149,999848 $150,000 to $199,9991,332 $200,000 or moreEstimate of home value of owner-occupied houses/condos in 2022 in zip code 33019 18 Less than $10,0009 $50,000 to $59,99911 $70,000 to $79,9996 $80,000 to $89,9999 $90,000 to $99,99947 $100,000 to $124,99912 $125,000 to $149,99917 $150,000 to $174,99949 $175,000 to $199,99944 $200,000 to $249,999118 $250,000 to $299,999957 $300,000 to $399,999848 $400,000 to $499,9991,758 $500,000 to $749,999792 $750,000 to $999,999848 $1,000,000 to $1,499,999231 $1,500,000 to $1,999,999764 $2,000,000 or moreRent paid by renters in 2022 in zip code 33019 9 $150 to $19910 $500 to $54918 $650 to $69985 $900 to $999178 $1,000 to $1,24976 $1,250 to $1,499843 $1,500 to $1,999343 $2,000 to $2,49957 $2,500 to $2,99950 $3,000 to $3,49991 No cash rent
Median gross rent in 2022: $1,850.
Median price asked for vacant for-sale houses and condos in 2022: $880,013.
Estimated median house (or condo) value in 2022 for: White Non-Hispanic householders: $1,058,103Black or African American householders: $1,274,423Asian householders: $1,101,172Native Hawaiian and other Pacific Islander householders: $917,643Two or more races householders: $725,305Hispanic or Latino householders: $993,501Estimated median house or condo value in 2022: $736,072
33019:
$736,072Florida:
$354,100
Lower value quartile - upper value quartile: $481,169 - $1,194,883
Mean price in 2022: Detached houses: $602,527Here:
$602,527State:
$500,941
Townhouses or other attached units: $348,233Here:
$348,233State:
$370,869
In 2-unit structures: $236,443Here:
$236,443State:
$423,188
In 3-to-4-unit structures: $176,214Here:
$176,214State:
$309,944
In 5-or-more-unit structures: $380,345Here:
$380,345State:
$447,145
Mobile homes: $58,483Here:
$58,483State:
$113,202
Housing units in structures:
One, detached: 2,947One, attached: 459Two: 713 or 4: 3085 to 9: 32810 to 19: 65720 to 49: 1,04550 or more: 7,359Unemployment : 7.0%
Means of transportation to work in zip code 33019 68.8% 4,495 Drove a car alone5.1% 332 Carpooled0.3% 20 Bus or trolley bus0.1% 7 Streetcar or trolley car0.3% 22 Subway or elevated0.5% 30 Taxi0.1% 9 Motorcycle0.2% 10 Walked0.6% 42 Other means27.1% 1,769 Worked at homeTravel time to work (commute) in zip code 33019 76 Less than 5 minutes165 5 to 9 minutes533 10 to 14 minutes818 15 to 19 minutes605 20 to 24 minutes165 25 to 29 minutes724 30 to 34 minutes150 35 to 39 minutes496 40 to 44 minutes661 45 to 59 minutes541 60 to 89 minutes44 90 or more minutes
Neighborhoods in zip code 33019: Percentage of zip code residents living and working in this county: 70.1%
Household type by relationship:
Households: 13,883
Male householders: 3,550 (1,093 living alone ), Female householders: 3,134 (1,222 living alone )3,541 spouses (3,436 opposite-sex spouses ), 333 unmarried partners , (302 opposite-sex unmarried partners ), 2,770 children (2,760 natural , 7 adopted , 7 stepchildren ), 28 grandchildren , 48 brothers or sisters , 345 parents , 0 foster children , 108 other relatives , 161 non-relatives In group quarters: 14 (-1 institutionalized population )
Size of family households: 2,663 2-persons , 602 3-persons , 538 4-persons , 228 5-persons , 32 6-persons , 23 7-or-more-persons
Size of nonfamily households: 2,313 1-person , 268 2-persons
1,490 married couples with children. single-parent households (54 men , 98 women ).
54.6% of residents of 33019 zip code speak English at home. of residents speak Spanish at home (64% very well, 21% well, 10% not well, 5% not at all ).of residents speak other Indo-European language at home (54% very well, 30% well, 13% not well, 2% not at all ).of residents speak Asian or Pacific Island language at home (59% very well, 22% well, 18% not well ).of residents speak other language at home (72% very well, 28% well ).
Foreign born population: 5,858 (42.2%)
(58.1%
of them are naturalized citizens )
This zip code:
42.2%Whole state:
21.7%
22% Chile 13% Barbados 10% Uruguay 5% Bolivia 3% Belgium 3% Guyana 3% Romania 8% Italian 6% American 5% English 5% Russian 3% Eastern European 3% German 3% European
Year of entry for the foreign-born population
2,009 2010 or later 1,504 2000 to 2009 777 1990 to 1999 1,813 Before 1990
There are
56 Medical Specialists in Zip Code 33019 .
Facilities with environmental interests located in this zip code:
7-ELEVEN STORE #30002 (4112 S OCEAN DRIVE in HOLLYWOOD, FL)
National Pollutant Discharge Elimination System NON-MAJOR (Tracking pollutant discharge elimination systems) - permit Organizations: WILLO SMITH (CONTACT/OWNER)
Alternative names: HANDYWAY STORE #2292 (IW)
HARBOR ISLANDS - PARCEL 1 (HARBOR ISLANDS DRIVE & MARINA in HOLLYWOOD, FL)
National Pollutant Discharge Elimination System NON-MAJOR (Tracking pollutant discharge elimination systems) - permit Organizations: JOHN GAVENAS (CONTACT/OWNER)
HARBOR ISLANDS PARCEL 9 (HATTERAS LANE in HOLLYWOOD, FL)
National Pollutant Discharge Elimination System NON-MAJOR (Tracking pollutant discharge elimination systems) - permit Organizations: JOHN GAVENAS (CONTACT/OWNER)
HOLLYWOOD GRANDE (342 PIERCE STREET in HOLLYWOOD, FL)
National Pollutant Discharge Elimination System NON-MAJOR (Tracking pollutant discharge elimination systems) - permit Organizations: MATT FLERI (CONTACT/OWNER)
Alternative names: CEDAR POINT ROAD AND SAWPIT RO
1407-1409 N OCEAN DRIVE PARKIN (1407 N OCEAN DR in HOLLYWOOD, FL)
National Pollutant Discharge Elimination System NON-MAJOR (Tracking pollutant discharge elimination systems) - permit Organizations: FRED BARTH (CONTACT/OWNER)
J R OIL (1351 MONROE ST in HOLLYWOOD, FL)
(Resource Conservation and Recovery Act (tracking hazardous waste)) Organizations: ANGELO ABBATE OWNER (CONTACT/OWNER)
OCEAN PALMS CONDOMINIUMS (3101 SOUTH OCEAN DRIVE in HOLLYWOOD, FL)
National Pollutant Discharge Elimination System NON-MAJOR (Tracking pollutant discharge elimination systems) - permit Organizations: SCOTT ROTH (CONTACT/OWNER)
Housing units lacking complete kitchen facilities: 0.3%
88.7% Electricity 7.3% No fuel used 3.5% Utility gas
Population in 1990: 12,115. Population change in the 1990s: +5,317 (+43.9%).
Place of birth for U.S.-born residents:
This state: 2,708Northeast: 2,887Midwest: 1,331South: 721West: 143
48% of the 33019 zip code residents lived in the same house 5 years ago.
Out of people who lived in different houses, 33% lived in this county.
Out of people who lived in different counties, 50% lived in Florida.
91% of the 33019 zip code residents lived in the same house 1 year ago.
Out of people who lived in different houses, 32% moved from this county.
Out of people who lived in different houses, 17% moved from different county within same state.
Out of people who lived in different houses, 32% moved from different state.
Out of people who lived in different houses, 29% moved from abroad.
Private vs. public school enrollment:
Students in private schools in grades 1 to 8 (elementary and middle school): 350
Students in private schools in grades 9 to 12 (high school): 276
Students in private undergraduate colleges: 550
Occupation by median earnings in the past 12 months ($)
196,259 Health diagnosing and treating practitioners and other technical occupations 158,852 Law enforcement workers including supervisors 125,094 Computer and mathematical occupations 101,183 Architecture and engineering occupations 94,856 Management occupations 80,365 Business and financial operations occupations
Companies with federal contracts located in this zip code:
NORTHSTAR TECHNICAL SERVICES, (745 HARRISON STREET in HOLLYWOOD, FL; small business)
$28,742 with Navy for Electrical Control Equipment. Signed on 2004-04-27. Completion date: 2004-04-28.
INOVA TECHNOLOGY INC (1105 SATINLEAF ST in HOLLYWOOD, FL; small business)
$4,274 with Air Force for ADP Software. Signed on 2005-09-20. Completion date: 2005-10-20.
Top industries in this zip code by the number of employees in 2005:
Accommodation and Food Services: Hotels (except Casino Hotels) and Motels (over 1000 employees: 1 establishment, 100-249 employees: 1 establishment, 50-99 employees: 1 establishment, 10-19 employees: 1 establishment, 5-9 employees: 3 establishments, 1-4 employees: 13 establishments)Accommodation and Food Services: Full-Service Restaurants (20-49: 6, 10-19: 5, 5-9: 5, 1-4: 4)Other Services (except Public Administration): Other Similar Organizations (except Business, Professional, Labor, and Political Organizations) (50-99: 1, 20-49: 3, 10-19: 2, 5-9: 6, 1-4: 14)Arts, Entertainment, and Recreation: Casinos (except Casino Hotels) (100-249: 1)Health Care and Social Assistance: Homes for the Elderly (50-99: 1)Information: Motion Picture Theaters (except Drive-Ins) (50-99: 1)Real Estate and Rental and Leasing: Offices of Real Estate Agents and Brokers (5-9: 1, 1-4: 25)Other Services (except Public Administration): Parking Lots and Garages (10-19: 1, 5-9: 4, 1-4: 2)
People in group quarters in 2010:
55 people in nursing facilities/skilled-nursing facilities
People in group quarters in 2000:
158 people in other noninstitutional group quarters
9 people in other nonhousehold living situations
4 people in military barracks, etc.
3 people in nursing homes
3 people in military ships
Fatal accident statistics in 2014:
Fatal accident count: 1Vehicles involved in fatal accidents: 1Fatal accidents caused by drunken drivers: 1Fatalities: 1Persons involved in fatal accidents: 3Pedestrians involved in fatal accidents: 2
Fatal accident statistics in 2013:
Fatal accident count: 3Vehicles involved in fatal accidents: 5Fatal accidents caused by drunken drivers: 0Fatalities: 3Persons involved in fatal accidents: 7Pedestrians involved in fatal accidents: 3
Home Mortgage Disclosure Act Aggregated Statistics For Year 2009(Based on 10 partial tracts) A) FHA, FSA/RHS & VA B) Conventional C) Refinancings D) Home Improvement Loans F) Non-occupant Loans on Number Average Value Number Average Value Number Average Value Number Average Value Number Average Value
LOANS ORIGINATED 42 $286,086 231 $287,251 252 $259,024 9 $61,738 158 $241,910 APPLICATIONS APPROVED, NOT ACCEPTED 3 $245,787 33 $267,603 41 $236,616 0 $0 21 $226,195 APPLICATIONS DENIED 21 $265,907 92 $232,859 229 $277,487 5 $169,600 113 $243,584 APPLICATIONS WITHDRAWN 12 $332,831 36 $249,389 89 $234,137 5 $201,234 40 $226,778 FILES CLOSED FOR INCOMPLETENESS 3 $228,067 16 $284,275 31 $398,141 4 $302,412 16 $292,570
Aggregated Statistics For Year 2008(Based on 10 partial tracts) A) FHA, FSA/RHS & VA B) Conventional C) Refinancings D) Home Improvement Loans F) Non-occupant Loans on Number Average Value Number Average Value Number Average Value Number Average Value Number Average Value
LOANS ORIGINATED 15 $285,341 370 $286,121 233 $295,627 16 $153,359 266 $280,589 APPLICATIONS APPROVED, NOT ACCEPTED 0 $0 81 $300,501 72 $264,733 6 $122,413 55 $271,750 APPLICATIONS DENIED 9 $296,097 164 $332,294 224 $324,661 33 $236,651 171 $313,156 APPLICATIONS WITHDRAWN 0 $0 85 $340,566 81 $339,173 2 $125,685 54 $285,479 FILES CLOSED FOR INCOMPLETENESS 0 $0 34 $379,940 32 $289,262 6 $194,927 25 $334,547
Aggregated Statistics For Year 2007(Based on 10 partial tracts) A) FHA, FSA/RHS & VA B) Conventional C) Refinancings D) Home Improvement Loans E) Loans on Dwellings For 5+ Families F) Non-occupant Loans on G) Loans On Manufactured Number Average Value Number Average Value Number Average Value Number Average Value Number Average Value Number Average Value Number Average Value
LOANS ORIGINATED 1 $279,290 853 $430,335 549 $335,850 53 $259,651 3 $1,718,463 537 $390,287 2 $84,565 APPLICATIONS APPROVED, NOT ACCEPTED 0 $0 192 $407,438 169 $346,388 10 $271,403 0 $0 132 $396,117 0 $0 APPLICATIONS DENIED 2 $171,000 438 $416,777 462 $405,182 46 $228,730 0 $0 251 $374,994 0 $0 APPLICATIONS WITHDRAWN 2 $319,885 143 $453,092 165 $355,046 7 $184,037 0 $0 74 $407,651 0 $0 FILES CLOSED FOR INCOMPLETENESS 0 $0 54 $370,303 45 $365,326 3 $135,560 0 $0 35 $333,996 0 $0
Aggregated Statistics For Year 2006(Based on 10 partial tracts) A) FHA, FSA/RHS & VA B) Conventional C) Refinancings D) Home Improvement Loans E) Loans on Dwellings For 5+ Families F) Non-occupant Loans on G) Loans On Manufactured Number Average Value Number Average Value Number Average Value Number Average Value Number Average Value Number Average Value Number Average Value
LOANS ORIGINATED 1 $183,520 1,412 $383,430 744 $356,827 74 $206,028 4 $963,970 740 $401,122 1 $38,770 APPLICATIONS APPROVED, NOT ACCEPTED 0 $0 215 $378,144 176 $355,380 22 $204,118 1 $1,283,310 110 $372,350 0 $0 APPLICATIONS DENIED 0 $0 577 $367,518 400 $436,284 38 $245,553 0 $0 279 $430,826 0 $0 APPLICATIONS WITHDRAWN 0 $0 243 $345,390 248 $347,259 28 $171,461 0 $0 134 $330,667 0 $0 FILES CLOSED FOR INCOMPLETENESS 0 $0 57 $332,202 88 $492,736 7 $146,737 0 $0 24 $271,121 0 $0
Aggregated Statistics For Year 2005(Based on 10 partial tracts) A) FHA, FSA/RHS & VA B) Conventional C) Refinancings D) Home Improvement Loans E) Loans on Dwellings For 5+ Families F) Non-occupant Loans on G) Loans On Manufactured Number Average Value Number Average Value Number Average Value Number Average Value Number Average Value Number Average Value Number Average Value
LOANS ORIGINATED 0 $0 1,782 $311,050 720 $284,388 59 $170,545 4 $679,360 918 $290,372 0 $0 APPLICATIONS APPROVED, NOT ACCEPTED 0 $0 191 $284,965 141 $274,169 18 $77,963 0 $0 100 $253,469 2 $25,120 APPLICATIONS DENIED 0 $0 566 $340,870 311 $333,116 40 $202,014 0 $0 270 $299,955 1 $127,450 APPLICATIONS WITHDRAWN 1 $184,340 278 $298,869 194 $304,669 12 $94,439 0 $0 119 $280,725 1 $262,420 FILES CLOSED FOR INCOMPLETENESS 0 $0 57 $347,744 125 $283,883 6 $97,592 0 $0 26 $238,363 0 $0
Aggregated Statistics For Year 2004(Based on 10 partial tracts) A) FHA, FSA/RHS & VA B) Conventional C) Refinancings D) Home Improvement Loans E) Loans on Dwellings For 5+ Families F) Non-occupant Loans on G) Loans On Manufactured Number Average Value Number Average Value Number Average Value Number Average Value Number Average Value Number Average Value Number Average Value
LOANS ORIGINATED 0 $0 1,145 $264,317 618 $223,239 38 $136,743 7 $471,153 500 $207,489 0 $0 APPLICATIONS APPROVED, NOT ACCEPTED 0 $0 126 $258,949 102 $258,892 17 $86,696 0 $0 58 $176,899 0 $0 APPLICATIONS DENIED 3 $184,083 289 $266,880 189 $261,969 43 $108,374 2 $247,180 128 $192,655 1 $37,480 APPLICATIONS WITHDRAWN 3 $150,200 162 $295,905 147 $263,934 12 $353,977 2 $602,080 51 $211,722 0 $0 FILES CLOSED FOR INCOMPLETENESS 2 $141,860 46 $270,006 58 $250,304 8 $204,184 0 $0 18 $261,206 0 $0
Aggregated Statistics For Year 2003(Based on 10 partial tracts) A) FHA, FSA/RHS & VA B) Conventional C) Refinancings D) Home Improvement Loans E) Loans on Dwellings For 5+ Families F) Non-occupant Loans on Number Average Value Number Average Value Number Average Value Number Average Value Number Average Value Number Average Value
LOANS ORIGINATED 4 $136,615 955 $245,984 1,415 $197,756 35 $72,218 5 $4,534,272 408 $180,487 APPLICATIONS APPROVED, NOT ACCEPTED 0 $0 105 $282,651 212 $198,706 15 $90,745 0 $0 43 $180,850 APPLICATIONS DENIED 2 $186,775 168 $224,321 342 $216,871 37 $78,389 1 $562,190 67 $184,446 APPLICATIONS WITHDRAWN 0 $0 120 $222,114 216 $198,896 7 $94,676 2 $937,300 42 $170,249 FILES CLOSED FOR INCOMPLETENESS 0 $0 23 $220,038 66 $266,252 0 $0 0 $0 15 $190,992
Aggregated Statistics For Year 2002(Based on 10 partial tracts) A) FHA, FSA/RHS & VA B) Conventional C) Refinancings D) Home Improvement Loans E) Loans on Dwellings For 5+ Families F) Non-occupant Loans on Number Average Value Number Average Value Number Average Value Number Average Value Number Average Value Number Average Value
LOANS ORIGINATED 6 $175,185 1,100 $298,866 1,043 $196,228 42 $99,716 4 $854,590 447 $169,890 APPLICATIONS APPROVED, NOT ACCEPTED 0 $0 145 $227,281 160 $182,240 21 $55,151 0 $0 56 $207,765 APPLICATIONS DENIED 1 $102,100 164 $233,660 245 $204,575 29 $117,178 0 $0 56 $166,220 APPLICATIONS WITHDRAWN 0 $0 95 $208,116 140 $727,951 9 $63,728 0 $0 26 $164,569 FILES CLOSED FOR INCOMPLETENESS 0 $0 32 $231,445 51 $187,160 0 $0 0 $0 13 $155,660
Aggregated Statistics For Year 2001(Based on 10 partial tracts) A) FHA, FSA/RHS & VA B) Conventional C) Refinancings D) Home Improvement Loans E) Loans on Dwellings For 5+ Families F) Non-occupant Loans on Number Average Value Number Average Value Number Average Value Number Average Value Number Average Value Number Average Value
LOANS ORIGINATED 7 $144,319 763 $174,586 782 $175,672 39 $44,539 9 $510,659 226 $139,853 APPLICATIONS APPROVED, NOT ACCEPTED 1 $93,720 95 $170,890 131 $159,488 15 $33,435 0 $0 37 $119,514 APPLICATIONS DENIED 3 $268,250 105 $136,056 234 $141,461 50 $56,189 4 $465,695 43 $97,865 APPLICATIONS WITHDRAWN 0 $0 68 $280,465 150 $133,573 17 $49,634 0 $0 22 $131,303 FILES CLOSED FOR INCOMPLETENESS 0 $0 19 $180,812 30 $145,742 5 $26,914 0 $0 5 $183,534
Aggregated Statistics For Year 2000(Based on 10 partial tracts) A) FHA, FSA/RHS & VA B) Conventional C) Refinancings D) Home Improvement Loans E) Loans on Dwellings For 5+ Families F) Non-occupant Loans on Number Average Value Number Average Value Number Average Value Number Average Value Number Average Value Number Average Value
LOANS ORIGINATED 8 $114,610 891 $160,880 132 $117,465 57 $33,907 2 $300,690 199 $125,882 APPLICATIONS APPROVED, NOT ACCEPTED 0 $0 109 $195,527 52 $118,067 23 $40,910 1 $119,070 23 $178,082 APPLICATIONS DENIED 1 $54,360 140 $157,274 103 $113,418 28 $38,702 0 $0 35 $90,408 APPLICATIONS WITHDRAWN 0 $0 95 $195,555 75 $108,779 7 $119,273 0 $0 20 $182,346 FILES CLOSED FOR INCOMPLETENESS 0 $0 30 $325,978 18 $122,602 3 $91,330 0 $0 5 $150,318
Aggregated Statistics For Year 1999(Based on 5 partial tracts) A) FHA, FSA/RHS & VA B) Conventional C) Refinancings D) Home Improvement Loans E) Loans on Dwellings For 5+ Families F) Non-occupant Loans on Number Average Value Number Average Value Number Average Value Number Average Value Number Average Value Number Average Value
LOANS ORIGINATED 6 $113,260 378 $150,317 158 $140,301 15 $45,944 0 $0 77 $115,547 APPLICATIONS APPROVED, NOT ACCEPTED 1 $63,680 49 $154,213 50 $122,090 10 $38,020 0 $0 10 $131,060 APPLICATIONS DENIED 1 $50,220 61 $150,037 61 $99,063 13 $35,637 1 $121,070 11 $95,950 APPLICATIONS WITHDRAWN 2 $84,085 43 $164,902 58 $121,698 5 $66,480 1 $384,840 10 $100,331 FILES CLOSED FOR INCOMPLETENESS 0 $0 13 $201,358 17 $147,306 0 $0 0 $0 3 $73,083
Detailed HMDA statistics for the following Tracts:
0901.00
,
0902.00 ,
0920.00 ,
1001.02
Private Mortgage Insurance Companies Aggregated Statistics For Year 2009(Based on 10 partial tracts) A) Conventional B) Refinancings Number Average Value Number Average Value
LOANS ORIGINATED 12 $271,650 0 $0 APPLICATIONS APPROVED, NOT ACCEPTED 5 $280,370 0 $0 APPLICATIONS DENIED 2 $181,200 1 $145,270 APPLICATIONS WITHDRAWN 2 $281,870 0 $0 FILES CLOSED FOR INCOMPLETENESS 2 $314,935 0 $0
Aggregated Statistics For Year 2008(Based on 10 partial tracts) A) Conventional B) Refinancings C) Non-occupant Loans on Number Average Value Number Average Value Number Average Value
LOANS ORIGINATED 46 $299,346 13 $282,225 14 $207,108 APPLICATIONS APPROVED, NOT ACCEPTED 39 $334,363 17 $326,304 11 $287,381 APPLICATIONS DENIED 6 $287,748 9 $289,112 5 $303,832 APPLICATIONS WITHDRAWN 8 $289,490 0 $0 3 $276,233 FILES CLOSED FOR INCOMPLETENESS 2 $267,390 2 $355,490 2 $225,395
Aggregated Statistics For Year 2007(Based on 10 partial tracts) A) Conventional B) Refinancings C) Non-occupant Loans on Number Average Value Number Average Value Number Average Value
LOANS ORIGINATED 94 $339,126 28 $352,616 26 $305,247 APPLICATIONS APPROVED, NOT ACCEPTED 21 $325,290 13 $316,590 16 $319,115 APPLICATIONS DENIED 2 $331,120 3 $356,170 2 $422,690 APPLICATIONS WITHDRAWN 6 $525,452 2 $318,625 5 $483,012 FILES CLOSED FOR INCOMPLETENESS 1 $212,740 0 $0 1 $212,740
Aggregated Statistics For Year 2006(Based on 10 partial tracts) A) Conventional B) Refinancings C) Non-occupant Loans on Number Average Value Number Average Value Number Average Value
LOANS ORIGINATED 106 $340,840 16 $323,128 47 $328,589 APPLICATIONS APPROVED, NOT ACCEPTED 30 $329,700 3 $395,743 17 $304,311 APPLICATIONS DENIED 9 $343,263 0 $0 5 $354,596 APPLICATIONS WITHDRAWN 9 $349,564 1 $548,260 1 $475,840 FILES CLOSED FOR INCOMPLETENESS 2 $550,805 0 $0 2 $436,145
Aggregated Statistics For Year 2005(Based on 10 partial tracts) A) Conventional B) Refinancings C) Non-occupant Loans on Number Average Value Number Average Value Number Average Value
LOANS ORIGINATED 193 $291,638 5 $265,016 96 $288,325 APPLICATIONS APPROVED, NOT ACCEPTED 37 $255,124 6 $226,947 22 $252,465 APPLICATIONS DENIED 12 $298,189 1 $401,750 8 $304,120 APPLICATIONS WITHDRAWN 14 $325,896 2 $181,475 4 $275,625 FILES CLOSED FOR INCOMPLETENESS 1 $253,570 5 $409,146 1 $191,840
Aggregated Statistics For Year 2004(Based on 10 partial tracts) A) Conventional B) Refinancings C) Non-occupant Loans on Number Average Value Number Average Value Number Average Value
LOANS ORIGINATED 190 $208,270 16 $233,601 79 $200,101 APPLICATIONS APPROVED, NOT ACCEPTED 41 $208,649 7 $208,061 16 $224,475 APPLICATIONS DENIED 2 $242,500 1 $178,070 2 $227,460 APPLICATIONS WITHDRAWN 12 $221,395 3 $201,567 5 $198,148 FILES CLOSED FOR INCOMPLETENESS 0 $0 0 $0 0 $0
Aggregated Statistics For Year 2003(Based on 10 partial tracts) A) Conventional B) Refinancings C) Non-occupant Loans on Number Average Value Number Average Value Number Average Value
LOANS ORIGINATED 136 $225,019 28 $196,908 23 $160,082 APPLICATIONS APPROVED, NOT ACCEPTED 12 $244,345 12 $229,077 3 $180,077 APPLICATIONS DENIED 0 $0 0 $0 1 $149,500 APPLICATIONS WITHDRAWN 13 $234,655 1 $245,640 3 $192,447 FILES CLOSED FOR INCOMPLETENESS 0 $0 0 $0 0 $0
Aggregated Statistics For Year 2002(Based on 10 partial tracts) A) Conventional B) Refinancings C) Non-occupant Loans on Number Average Value Number Average Value Number Average Value
LOANS ORIGINATED 253 $181,919 34 $160,655 37 $169,372 APPLICATIONS APPROVED, NOT ACCEPTED 22 $193,815 17 $233,623 5 $113,652 APPLICATIONS DENIED 8 $109,572 1 $38,770 4 $149,110 APPLICATIONS WITHDRAWN 9 $178,622 0 $0 2 $166,900 FILES CLOSED FOR INCOMPLETENESS 0 $0 0 $0 0 $0
Aggregated Statistics For Year 2001(Based on 10 partial tracts) A) Conventional B) Refinancings C) Non-occupant Loans on Number Average Value Number Average Value Number Average Value
LOANS ORIGINATED 171 $143,965 43 $183,334 30 $126,048 APPLICATIONS APPROVED, NOT ACCEPTED 41 $151,328 11 $206,273 9 $87,300 APPLICATIONS DENIED 5 $112,978 1 $124,800 3 $134,583 APPLICATIONS WITHDRAWN 4 $194,882 0 $0 0 $0 FILES CLOSED FOR INCOMPLETENESS 2 $35,235 0 $0 0 $0
Aggregated Statistics For Year 2000(Based on 10 partial tracts) A) Conventional B) Refinancings C) Non-occupant Loans on Number Average Value Number Average Value Number Average Value
LOANS ORIGINATED 226 $145,336 8 $158,096 33 $95,502 APPLICATIONS APPROVED, NOT ACCEPTED 42 $153,858 6 $243,185 7 $140,136 APPLICATIONS DENIED 9 $161,646 0 $0 1 $74,980 APPLICATIONS WITHDRAWN 4 $149,090 0 $0 0 $0 FILES CLOSED FOR INCOMPLETENESS 7 $155,843 0 $0 0 $0
Aggregated Statistics For Year 1999(Based on 5 partial tracts) A) Conventional B) Refinancings C) Non-occupant Loans on Number Average Value Number Average Value Number Average Value
LOANS ORIGINATED 108 $138,117 18 $135,464 10 $93,232 APPLICATIONS APPROVED, NOT ACCEPTED 10 $164,195 0 $0 1 $174,430 APPLICATIONS DENIED 7 $157,646 3 $118,693 1 $139,140 APPLICATIONS WITHDRAWN 11 $140,252 2 $115,300 1 $34,870 FILES CLOSED FOR INCOMPLETENESS 2 $232,830 0 $0 0 $0
Detailed PMIC statistics for the following Tracts:
0901.00
,
0902.00 ,
0920.00 ,
1001.02
2002 - 2018 National Fire Incident Reporting System (NFIRS) incidents See full 2006 National Fire Incident Reporting System statistics for zip code 33019, Florida
Most common first names in zip code 33019 among deceased individuals Name Count Lived (average)
Joseph 146 80.3 years Samuel 130 84.0 years Rose 120 84.8 years Louis 110 82.6 years Harry 108 82.5 years William 107 79.9 years John 94 76.4 years Irving 86 82.2 years Ruth 84 81.7 years David 83 80.4 years
Most common last names in zip code 33019 among deceased individuals Last name Count Lived (average)
Cohen 67 82.7 years Miller 39 81.8 years Kaplan 36 83.5 years Goldstein 33 84.8 years Schwartz 31 81.8 years Levine 30 81.2 years Goldberg 25 83.7 years Shapiro 25 79.2 years Rosenthal 25 84.9 years Levy 24 82.3 years
Businesses in zip code 33019
Name Count Name Count
7-Eleven 1 New Balance 1 Ben & Jerry's 1 Nike 1 Holiday Inn 1 Westin 1 Marriott 1

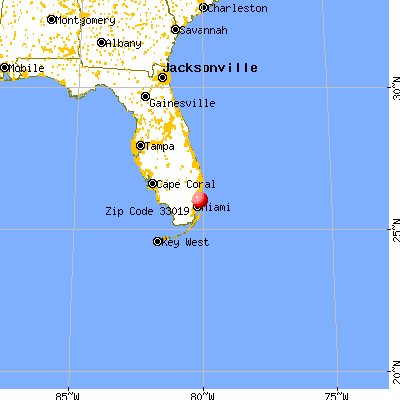


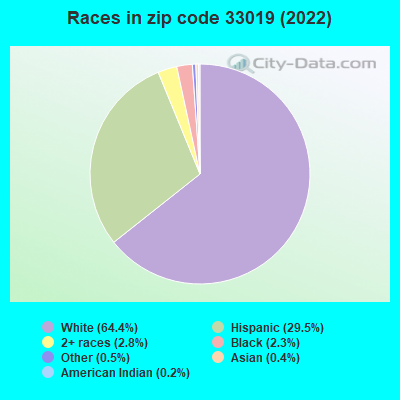


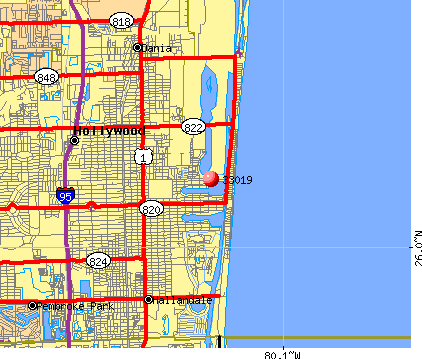 Nearest zip codes: 33020, 33004, 33009, 33021, 33315, 33316.
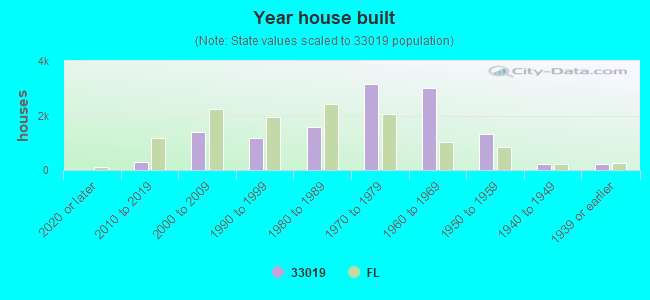
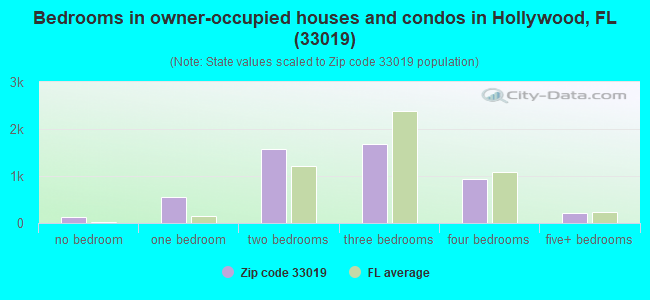
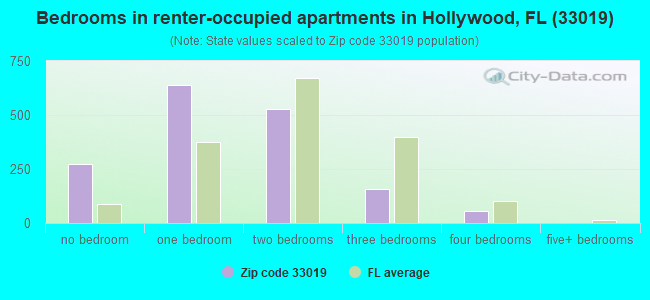
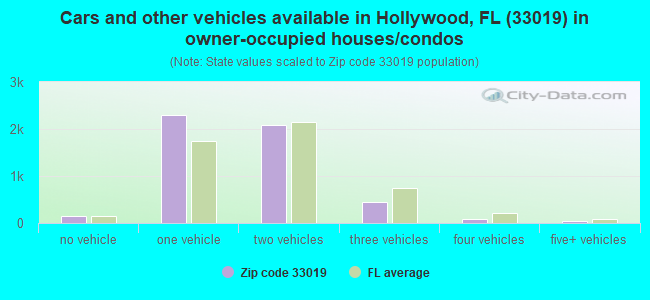
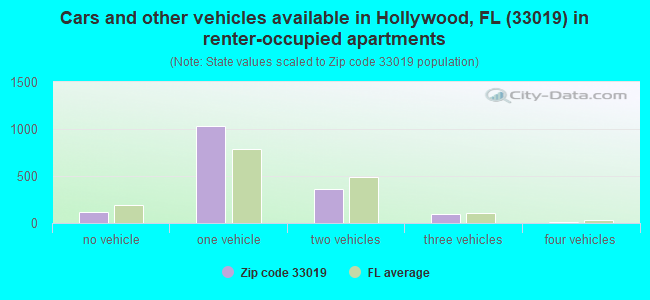


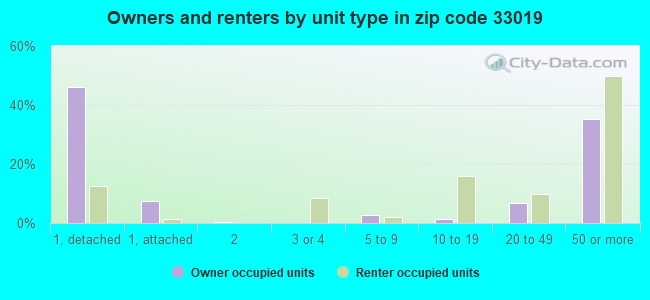
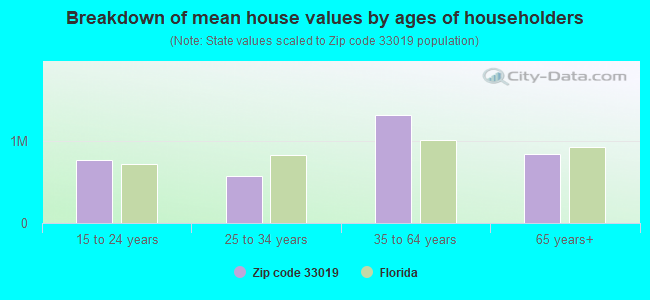


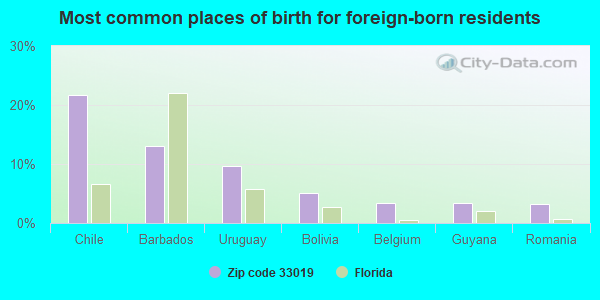
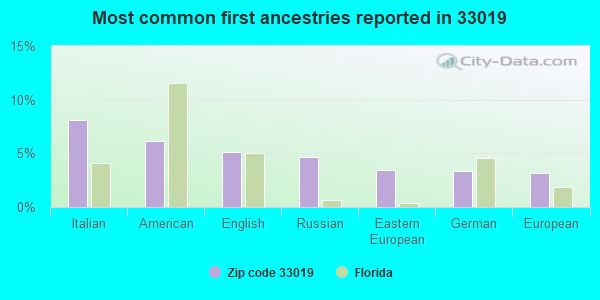
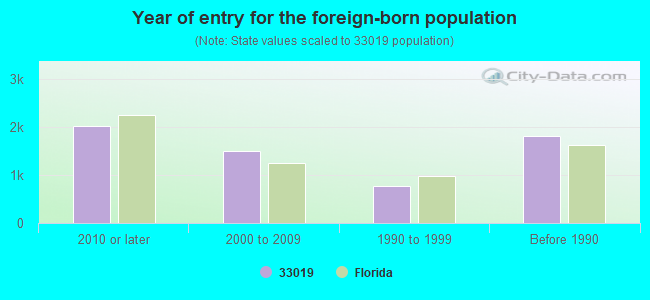


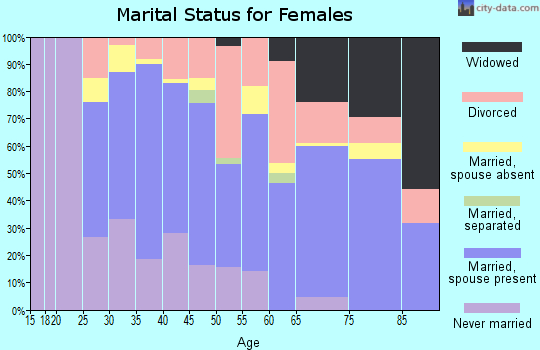
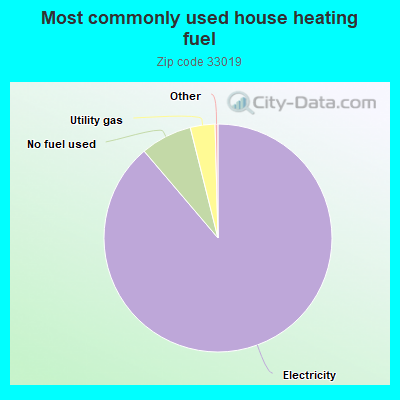
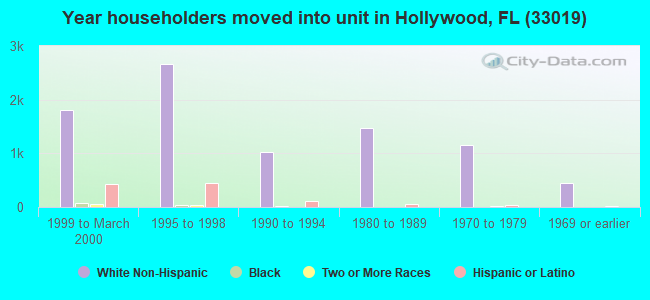
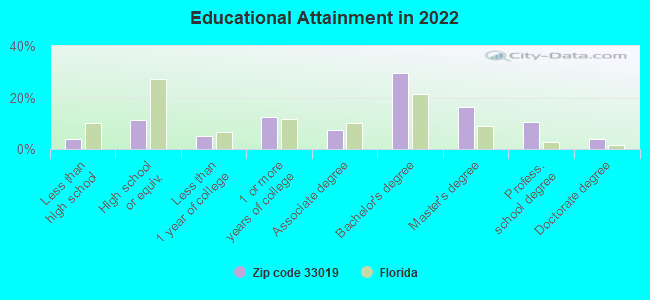
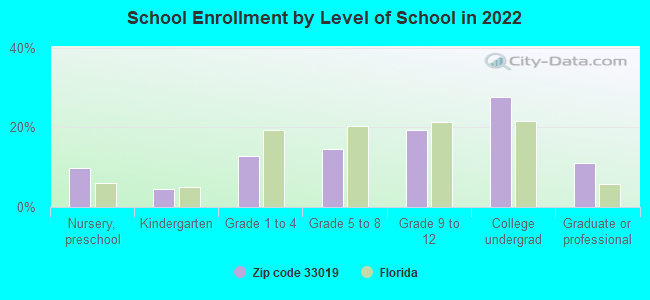
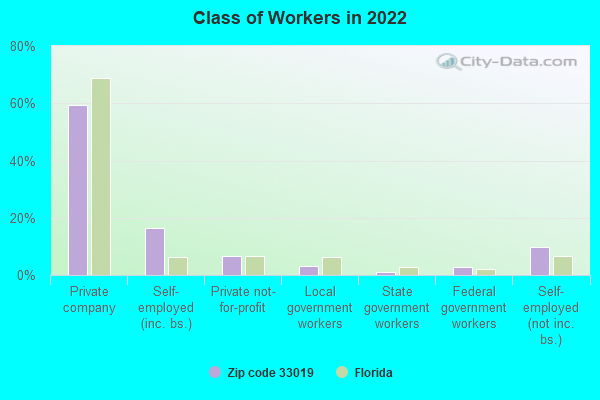
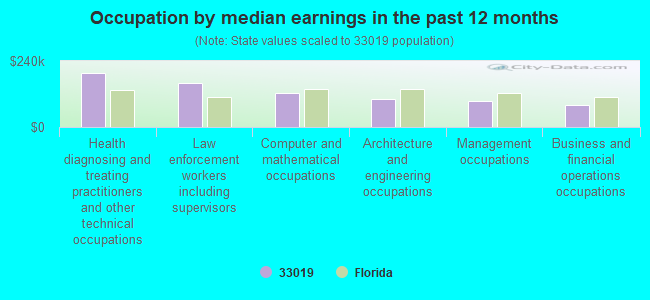
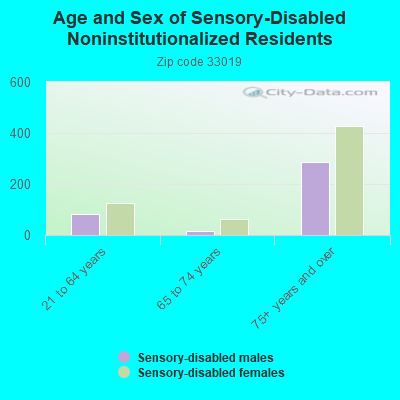
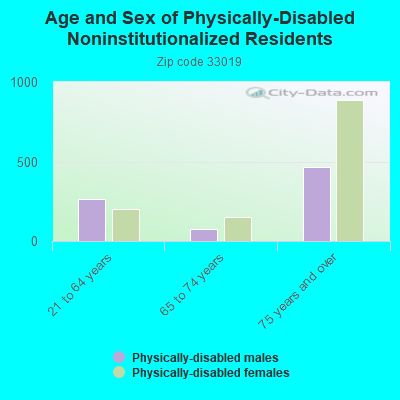
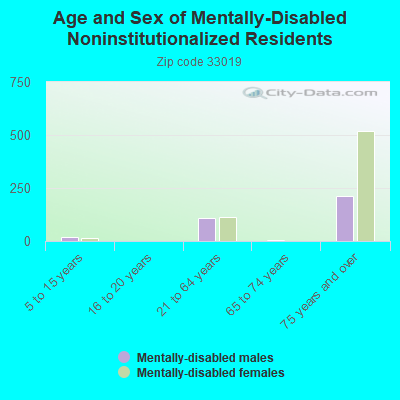
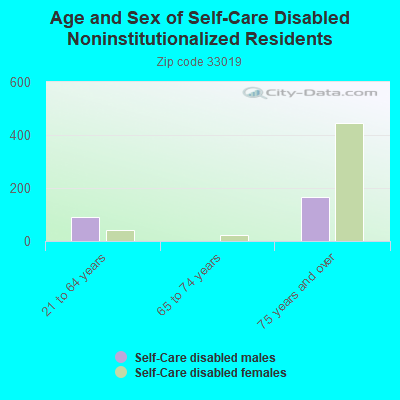
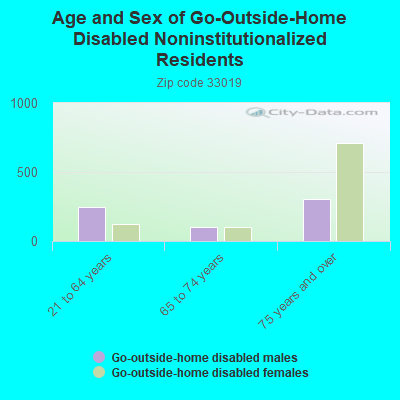

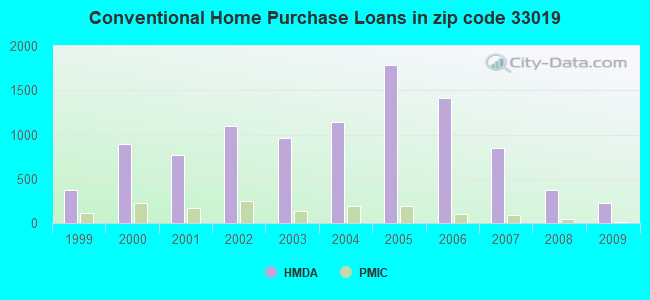
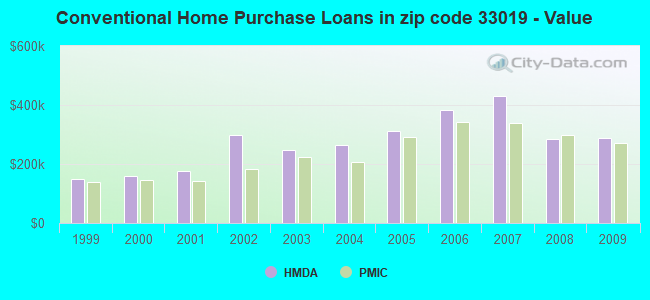
 According to the data from the years 2002 - 2018 the average number of fire incidents per year is 26. The highest number of reported fires - 55 took place in 2009, and the least - 1 in 2005. The data has a growing trend.
 When looking into fire subcategories, the most reports belonged to: Structure Fires (40.9%), and Outside Fires (35.1%).