Estimated zip code population in 2022: 16,913 Zip code population in 2010: 15,588 Zip code population in 2000: 15,161
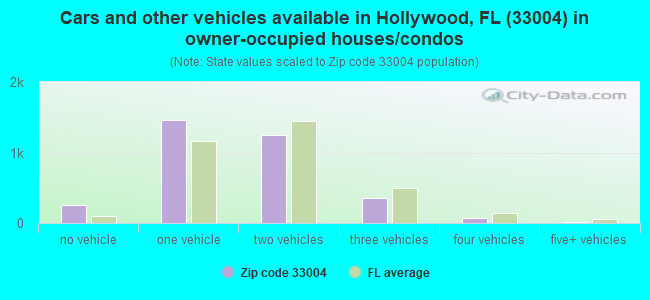
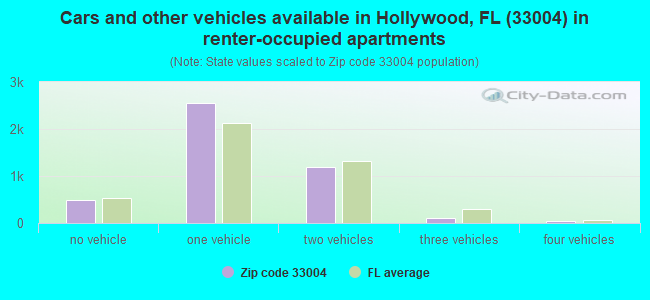
Houses and condos: 9,422 Renter-occupied apartments: 4,381
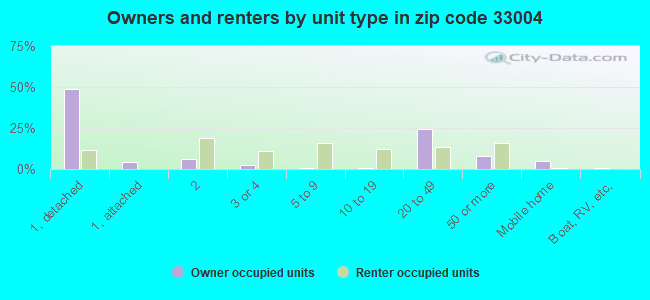
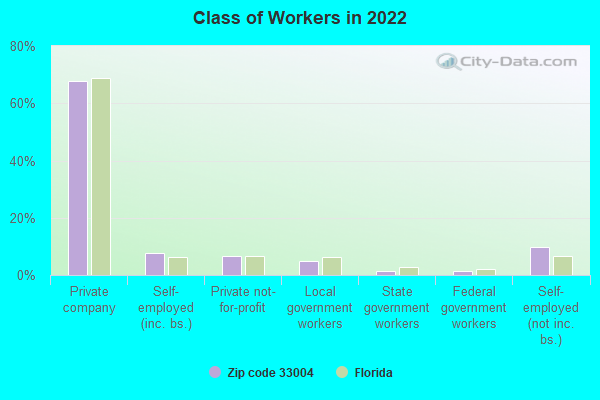
% of renters here:
56%
State:
33%
March 2022 cost of living index in zip code 33004: 110.6 (more than average, U.S. average is 100)
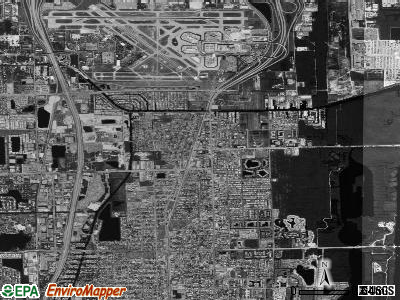
Land area: 5.7 sq. mi. Water area: 0.6 sq. mi.
Population density: 2,969 people per square mile
(average).
OSM Map
General Map
Google Map
MSN Map
OSM Map
General Map
Google Map
MSN Map
OSM Map
General Map
Google Map
MSN Map
OSM Map
General Map
Google Map
MSN Map
Please wait while loading the map...
Real estate property taxes paid for housing units in 2022:
This zip code:
0.8% ($2,744)
Florida:
0.7% ($2,529)
Median real estate property taxes paid for housing units with mortgages in 2022: $3,452 (0.7%) Median real estate property taxes paid for housing units with no mortgage in 2022: $2,353 (0.8%)
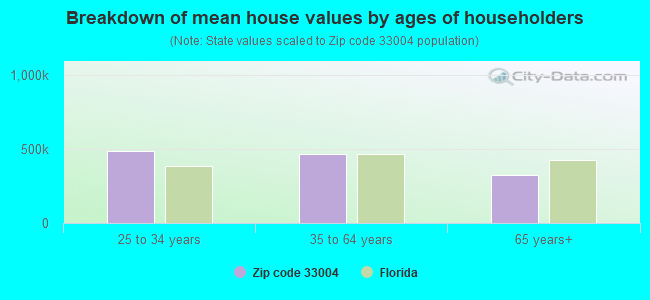
Estimated median house/condo value in 2022: $337,013
33004:
$337,013
Florida:
$354,100
According to our research of Florida and other state lists, there were 18 registered sex offenders living in 33004 zip code as of May 14, 2024. The ratio of all residents to sex offenders in zip code 33004 is 931 to 1. The ratio of registered sex offenders to all residents in this zip code is lower than the state average.
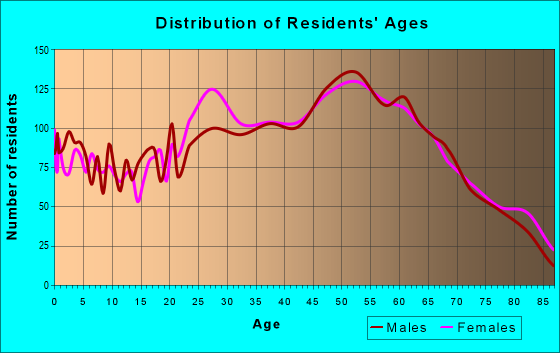
Median resident age:
This zip code:
43.4 years
Florida median age:
42.7 years
Average household size:
This zip code:
2.1 people
Florida:
2.5 people
Averages for the 2020 tax year for zip code 33004, filed in 2021:
Average Adjusted Gross Income (AGI) in 2020: $48,842 (Individual Income Tax Returns)
Here:
$48,842
State:
$82,200
Salary/wage: $43,027 (reported on 77.7% of returns)
Here:
$43,027
State:
$58,347
(% of AGI for various income ranges: 1160.9% for AGIs below $25k, 3572.0% for AGIs $25k-50k, 6673.2% for AGIs $50k-75k, 10309.4% for AGIs $75k-100k, 17874.7% for AGIs $100k-200k, 61136.7% for AGIs over 200k)
Taxable interest for individuals: $2,054 (reported on 18.7% of returns)
This zip code:
$2,054
Florida:
$4,272
(% of AGI for various income ranges: 16.9% for AGIs below $25k, 20.4% for AGIs $25k-50k, 54.0% for AGIs $50k-75k, 93.6% for AGIs $75k-100k, 301.6% for AGIs $100k-200k, 1135.0% for AGIs over 200k)
Ordinary dividends: $6,264 (reported on 12.2% of returns)
Here:
$6,264
State:
$15,863
(% of AGI for various income ranges: 17.3% for AGIs below $25k, 48.0% for AGIs $25k-50k, 80.1% for AGIs $50k-75k, 112.2% for AGIs $75k-100k, 432.2% for AGIs $100k-200k, 4443.3% for AGIs over 200k)
Net capital gain/loss in AGI: +$16,090 (reported on 13.5% of returns)
Here:
+$16,090
State:
+$62,983
(% of AGI for various income ranges: 2.2% for AGIs below $25k, 24.7% for AGIs $25k-50k, 83.0% for AGIs $50k-75k, 267.5% for AGIs $75k-100k, 913.1% for AGIs $100k-200k, 22113.3% for AGIs over 200k)
Profit/loss from business: +$6,475 (reported on 28.4% of returns)
Here:
+$6,475
State:
+$9,719
(% of AGI for various income ranges: 204.7% for AGIs below $25k, 143.3% for AGIs $25k-50k, 122.8% for AGIs $50k-75k, 99.4% for AGIs $75k-100k, 542.8% for AGIs $100k-200k, 7343.3% for AGIs over 200k)
Taxable individual retirement arrangement distribution: $16,830 (reported on 5.2% of returns)
33004:
$16,830
Florida:
$24,823
(% of AGI for various income ranges: 25.2% for AGIs below $25k, 44.3% for AGIs $25k-50k, 142.0% for AGIs $50k-75k, 277.8% for AGIs $75k-100k, 783.4% for AGIs $100k-200k, 2098.3% for AGIs over 200k)
Total itemized deductions: $28,793 (reported on 6.5% of returns)
Here:
$28,793
State:
$45,393
(% of AGI for various income ranges: 45.8% for AGIs below $25k, 135.9% for AGIs $25k-50k, 386.8% for AGIs $50k-75k, 550.6% for AGIs $75k-100k, 1052.8% for AGIs $100k-200k, 6020.0% for AGIs over 200k)
Charity contributions: $6,555 (reported on 5.2% of returns)
Here:
$6,555
State:
$20,178
(% of AGI for various income ranges: 4.0% for AGIs below $25k, 20.5% for AGIs $25k-50k, 66.0% for AGIs $50k-75k, 99.7% for AGIs $75k-100k, 252.2% for AGIs $100k-200k, 1156.7% for AGIs over 200k)
Taxes paid: $5,848 (reported on 6.4% of returns)
33004:
$5,848
State:
$6,967
(% of AGI for various income ranges: 9.2% for AGIs below $25k, 26.4% for AGIs $25k-50k, 77.2% for AGIs $50k-75k, 132.2% for AGIs $75k-100k, 230.6% for AGIs $100k-200k, 975.0% for AGIs over 200k)
Earned income credit: $2,278 (reported on 26.2% of returns)
Here:
$2,278
State:
$2,306
(% of AGI for various income ranges: 139.3% for AGIs below $25k, 74.0% for AGIs $25k-50k)
Percentage of individuals using paid preparers for their 2020 taxes: 91.2%
Here:
91%
State:
92%
(% for various income ranges: 90.1% for AGIs below $25k, 92.4% for AGIs $25k-50k, 92.9% for AGIs $50k-75k, 91.1% for AGIs $75k-100k, 91.9% for AGIs $100k-200k, 85.0% for AGIs over 200k)
Averages for the 2012 tax year for zip code 33004, filed in 2013:
Average Adjusted Gross Income (AGI) in 2012: $39,514 (Individual Income Tax Returns)
Here:
$39,514
State:
$60,316
Salary/wage: $35,329 (reported on 80.7% of returns)
Here:
$35,329
State:
$45,277
(% of AGI for various income ranges: 74.6% for AGIs below $25k, 84.8% for AGIs $25k-50k, 77.7% for AGIs $50k-75k, 77.4% for AGIs $75k-100k, 73.7% for AGIs $100k-200k, 35.4% for AGIs over 200k)
Taxable interest for individuals: $1,781 (reported on 20.2% of returns)
This zip code:
$1,781
Florida:
$3,587
(% of AGI for various income ranges: 1.0% for AGIs below $25k, 0.6% for AGIs $25k-50k, 0.8% for AGIs $50k-75k, 0.7% for AGIs $75k-100k, 1.1% for AGIs $100k-200k, 1.3% for AGIs over 200k)
Ordinary dividends: $5,829 (reported on 13.3% of returns)
Here:
$5,829
State:
$12,831
(% of AGI for various income ranges: 3.8% for AGIs below $25k, 1.3% for AGIs $25k-50k, 1.5% for AGIs $50k-75k, 1.1% for AGIs $75k-100k, 1.7% for AGIs $100k-200k, 2.4% for AGIs over 200k)
Net capital gain/loss in AGI: +$8,696 (reported on 10.3% of returns)
Here:
+$8,696
State:
+$33,493
(% of AGI for various income ranges: 0.2% for AGIs $50k-75k, 0.8% for AGIs $75k-100k, 2.6% for AGIs $100k-200k, 12.5% for AGIs over 200k)
Profit/loss from business: +$7,311 (reported on 19.5% of returns)
Here:
+$7,311
State:
+$10,012
(% of AGI for various income ranges: 10.2% for AGIs below $25k, 2.2% for AGIs $25k-50k, 2.1% for AGIs $50k-75k, 2.0% for AGIs $75k-100k, 2.3% for AGIs $100k-200k, 2.9% for AGIs over 200k)
Taxable individual retirement arrangement distribution: $14,036 (reported on 6.1% of returns)
33004:
$14,036
Florida:
$21,544
(% of AGI for various income ranges: 1.6% for AGIs below $25k, 1.6% for AGIs $25k-50k, 2.3% for AGIs $50k-75k, 2.3% for AGIs $75k-100k, 5.2% for AGIs $100k-200k)
Total itemized deductions: $19,041 (25% of AGI, reported on 21.2% of returns)
Here:
$19,041
State:
$25,533
Here:
24.9% of AGI
State:
18.0% of AGI
(% of AGI for various income ranges: 6.1% for AGIs below $25k, 10.1% for AGIs $25k-50k, 14.7% for AGIs $50k-75k, 11.9% for AGIs $75k-100k, 10.8% for AGIs $100k-200k, 7.5% for AGIs over 200k)
Charity contributions: $2,875 (reported on 16.9% of returns)
Here:
$2,875
State:
$5,698
(% of AGI for various income ranges: 0.5% for AGIs below $25k, 1.1% for AGIs $25k-50k, 1.9% for AGIs $50k-75k, 1.6% for AGIs $75k-100k, 1.4% for AGIs $100k-200k, 0.9% for AGIs over 200k)
Taxes paid: $4,012 (reported on 20.4% of returns)
33004:
$4,012
State:
$6,203
(% of AGI for various income ranges: 0.9% for AGIs below $25k, 1.5% for AGIs $25k-50k, 3.5% for AGIs $50k-75k, 2.4% for AGIs $75k-100k, 2.5% for AGIs $100k-200k, 1.8% for AGIs over 200k)
Earned income credit: $2,308 (reported on 28.2% of returns)
Here:
$2,308
State:
$2,372
(% of AGI for various income ranges: 8.6% for AGIs below $25k, 1.0% for AGIs $25k-50k)
Percentage of individuals using paid preparers for their 2012 taxes: 64.6%
Here:
65%
State:
54%
(% for various income ranges: 65.4% for AGIs below $25k, 59.9% for AGIs $25k-50k, 66.0% for AGIs $50k-75k, 65.9% for AGIs $75k-100k, 69.8% for AGIs $100k-200k, 90.0% for AGIs over 200k)
Averages for the 2004 tax year for zip code 33004, filed in 2005:
Average Adjusted Gross Income (AGI) in 2004: $37,856 (Individual Income Tax Returns)
Here:
$37,856
State:
$50,523
Salary/wage: $33,201 (reported on 83.6% of returns)
Here:
$33,201
State:
$39,563
(% of AGI for various income ranges: 103.0% for AGIs below $10k, 80.0% for AGIs $10k-25k, 86.0% for AGIs $25k-50k, 82.1% for AGIs $50k-75k, 76.9% for AGIs $75k-100k, 50.9% for AGIs over 100k)
Taxable interest for individuals: $2,511 (reported on 33.0% of returns)
This zip code:
$2,511
Florida:
$3,211
(% of AGI for various income ranges: 6.7% for AGIs below $10k, 2.4% for AGIs $10k-25k, 1.4% for AGIs $25k-50k, 1.6% for AGIs $50k-75k, 1.9% for AGIs $75k-100k, 2.9% for AGIs over 100k)
Taxable dividends: $2,687 (reported on 17.6% of returns)
Here:
$2,687
State:
$6,129
(% of AGI for various income ranges: 3.8% for AGIs below $10k, 1.4% for AGIs $10k-25k, 0.9% for AGIs $25k-50k, 1.1% for AGIs $50k-75k, 1.2% for AGIs $75k-100k, 1.3% for AGIs over 100k)
Net capital gain/loss: +$10,549 (reported on 15.8% of returns)
Here:
+$10,549
State:
+$27,205
(% of AGI for various income ranges: -0.6% for AGIs below $10k, -0.2% for AGIs $10k-25k, 0.4% for AGIs $25k-50k, 1.7% for AGIs $50k-75k, 2.6% for AGIs $75k-100k, 12.5% for AGIs over 100k)
Profit/loss from business: +$8,029 (reported on 14.2% of returns)
Here:
+$8,029
State:
+$10,634
(% of AGI for various income ranges: 18.3% for AGIs below $10k, 7.1% for AGIs $10k-25k, 2.0% for AGIs $25k-50k, 1.6% for AGIs $50k-75k, 2.1% for AGIs $75k-100k, 2.1% for AGIs over 100k)
IRA payment deduction: $3,062 (reported on 2.7% of returns)
33004:
$3,062
Florida:
$3,082
(% of AGI for various income ranges: 0.2% for AGIs $10k-25k, 0.3% for AGIs $25k-50k, 0.3% for AGIs $50k-75k, 0.2% for AGIs $75k-100k, 0.2% for AGIs over 100k)
Self-employed pension: $11,357 (reported on 0.2% of returns)
Here:
$11,357
Florida:
$15,857
Total itemized deductions: $16,492 (24% of AGI, reported on 25.8% of returns)
Here:
$16,492
State:
$20,370
Here:
23.6% of AGI
State:
20.7% of AGI
(% of AGI for various income ranges: 8.5% for AGIs below $10k, 8.6% for AGIs $10k-25k, 12.2% for AGIs $25k-50k, 13.6% for AGIs $50k-75k, 11.7% for AGIs $75k-100k, 10.3% for AGIs over 100k)
Charity contributions deductions: $2,374 (3% of AGI, reported on 22.1% of returns)
Here:
$2,374
State:
$4,064
Here:
3.4% of AGI
State:
3.8% of AGI
(% of AGI for various income ranges: 0.7% for AGIs below $10k, 0.9% for AGIs $10k-25k, 1.4% for AGIs $25k-50k, 1.9% for AGIs $50k-75k, 1.8% for AGIs $75k-100k, 1.2% for AGIs over 100k)
Total tax: $6,129 (reported on 71.6% of returns)
33004:
$6,129
State:
$9,431
(% of AGI for various income ranges: 4.2% for AGIs below $10k, 3.9% for AGIs $10k-25k, 7.5% for AGIs $25k-50k, 10.9% for AGIs $50k-75k, 12.8% for AGIs $75k-100k, 19.1% for AGIs over 100k)
Earned income credit: $1,814 (reported on 24.0% of returns)
Here:
$1,814
State:
$1,808
Percentage of individuals using paid preparers for their 2004 taxes: 66.2%
Here:
66%
State:
60%
(% for various income ranges: 64.8% for AGIs below $10k, 69.0% for AGIs $10k-25k, 62.7% for AGIs $25k-50k, 64.0% for AGIs $50k-75k, 68.0% for AGIs $75k-100k, 75.4% for AGIs over 100k)
Likely homosexual households (counted as self-reported same-sex unmarried-partner households)
Lesbian couples: 0.0% of all households
Gay men: 0.2% of all households
Household received Food Stamps/SNAP in the past 12 months: 1,586 Household did not receive Food Stamps/SNAP in the past 12 months: 6,180
Women who had a birth in the past 12 months: 304 (164 now married, 135 unmarried) Women who did not have a birth in the past 12 months: 3,780 (1,376 now married, 2,402 unmarried)
Housing units in zip code 33004 with a mortgage: 1,397 (150 second mortgage, 141 both second mortgage and home equity loan) Houses without a mortgage: 30
Median monthly owner costs for units with a mortgage: $1,939 Median monthly owner costs for units without a mortgage: $621
Residents with income below the poverty level in 2022:
This zip code:
21.5%
Whole state:
12.7%
Residents with income below 50% of the poverty level in 2022:
This zip code:
10.0%
Whole state:
6.6%
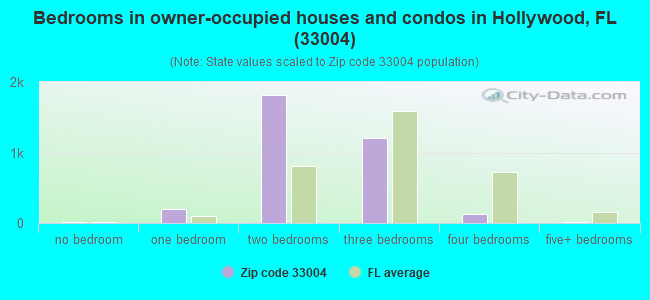
Median number of rooms in houses and condos:
Here:
4.6
State:
5.9
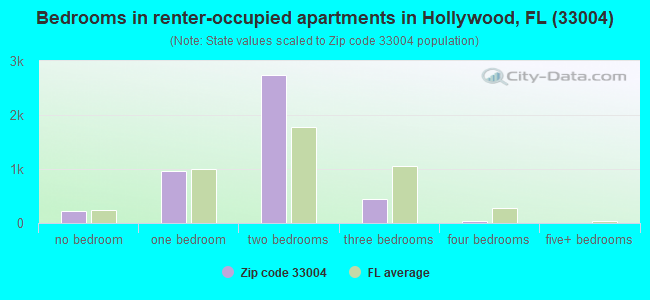
Median number of rooms in apartments:
Here:
3.9
State:
4.2
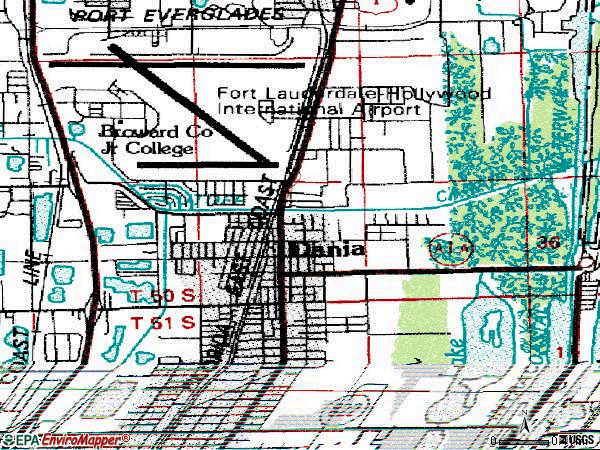
Notable locations in this zip code not listed on our city pages
Notable locations in zip code 33004: Port Everglades Authority Berths 33A 33B and 33C (A), Fort Lauderdale-Hollywood International Airport Station (B), Dania Shopping Plaza (C), Gulf Stream School Library (D), Graves Museum (E), Dania Beach Paul DeMaio Branch Library (F), Dania Chamber of Commerce (G), Dania City Hall (H), Dania Fire Station (I), Dania Jaialai Palace (J), Dania Library (K), Dania Police Station (L), Cross Point Care Center (M), Dania Beach Fire / Rescue (N), Dania Beach Fire / Rescue Station 1 (O), Graves Museum of Archaeology and Natural History (P). Display/hide their locations on the map
Churches in zip code 33004 include: Memorial Church (A), Dania Heights Baptist Church (B), First Baptist Church of Dania (C), Dania Heights Church (D). Display/hide their locations on the map
Tourist attractions (not listed on the city page) : International Game Fish Association (Cultural Attractions- Events- & Facilities; 300 Gulf Stream Way), Broward County - Branch Libraries- Dania Branch Paul Demaio Branch- Libraries Divi (Cultural Attractions- Events- & Facilities; 255 East Dania Beach Boulevard), Igfa Fishing Hall of Fame & Museum (Cultural Attractions- Events- & Facilities; 300 Gulf Stream Way), Dania Beach Hurricane (Amusement & Theme Parks; 1700 Northwest 1st Street), Boomers of Dania (Amusement & Theme Parks; 1700 Northwest 1st Street), Dania Jai-Alai and Simulcast Reservatins & Infrmtn (301 East Dania Beach Boulevard), Festival Fun Park (1801 Northwest 1st Street), Dania Grand PRIX (1700 Northwest 1st Street).
1,188 married couples with children.
1,424 single-parent households (214 men, 1,210 women).
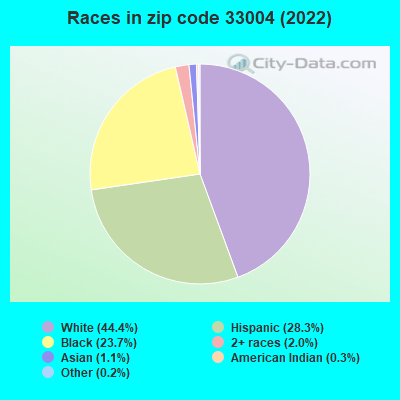
58.1% of residents of 33004 zip code speak English at home.
25.2% of residents speak Spanish at home (68% very well, 16% well, 10% not well, 6% not at all).
13.8% of residents speak other Indo-European language at home (73% very well, 19% well, 3% not well, 6% not at all).
1.0% of residents speak Asian or Pacific Island language at home (100% very well).
2.1% of residents speak other language at home (53% very well, 43% well, 4% not well).
Foreign born population: 4,909 (29.0%) (59.2% of them are naturalized citizens)
This zip code:
29.0%
Whole state:
21.7%
13%Chile
12%Barbados
8%Mexico
7%Grenada
5%Poland
5%Dominica
4%Uruguay
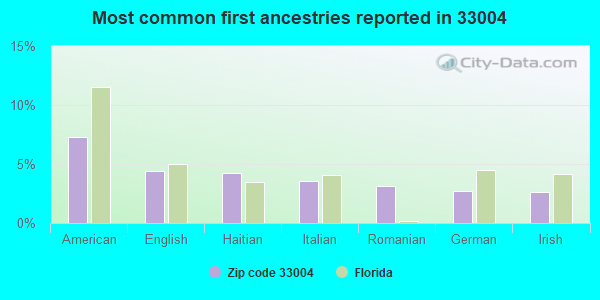
7%American
4%English
4%Haitian
4%Italian
3%Romanian
3%German
3%Irish
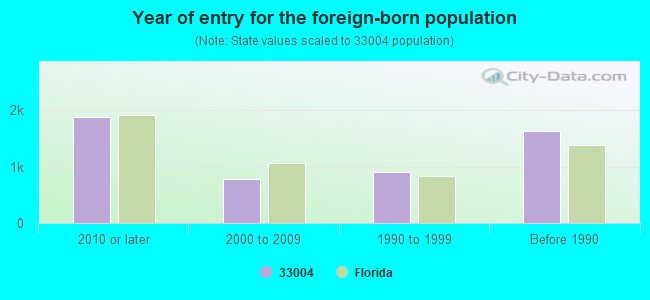
Year of entry for the foreign-born population
1,8832010 or later
7832000 to 2009
9091990 to 1999
1,641Before 1990
Major facilities with environmental interests located in this zip code:
LAGACI SPORT (1210 STIRLING RD BAY 10B in DANIA, FL)
STATE MASTER (FDM) - CHAZ-FLR000028811, HAZARDOUS WASTE REGULATION PROGRAM (Resource Conservation and Recovery Act (tracking hazardous waste)) Business SIC classification: WOMEN'S, MISSES', AND JUNIORS' BLOUSES AND SHIRTS Organizations: GARSIDES AIRCRAFT, ROBERT G GARSIDE (CONTACT/OWNER)
Alternative names: GARSIDES AIRCRAFT
COZY COVE MARINA INC (300 NORTH FEDERAL HIGHWAY in DANIA, FL)
(Integrated Compliance Information System) - ICIS-04-2000-0030, FORMAL ENFORCEMENT ACTION National Pollutant Discharge Elimination System NON-MAJOR (Tracking pollutant discharge elimination systems) - permit Business SIC classification: MARINAS Organizations: JAMES EDMUNDS (CONTACT/OWNER)
CONSOLIDATED YACHT CORPORATION (775 TAYLOR LANE in DANIA, FL)
(Integrated Compliance Information System) - ICIS-04-1998-0231, FORMAL ENFORCEMENT ACTION (Resource Conservation and Recovery Act (tracking hazardous waste)) Business SIC classification: BOAT BUILDING AND REPAIRING Organizations: JAMES GARDINER (CONTACT/OWNER)
HARBOUR TOWNE MARINA (801 NE 3RD ST in DANIA BEACH, FL)
National Pollutant Discharge Elimination System NON-MAJOR (Tracking pollutant discharge elimination systems) - permit National Pollutant Discharge Elimination System NON-MAJOR (Tracking pollutant discharge elimination systems) - permit (Resource Conservation and Recovery Act (tracking hazardous waste)) Business SIC classification: BOAT BUILDING AND REPAIRING Organizations: HARBOR TOWNE ASSOC INC (CONTACT/OWNER)
Alternative names: HARBOR TOWNE MARINA
COOL BREEZE AUTO AIR CONDITIONING (300 S FEDERAL HWY in DANIA, FL)
AIR MINOR (AIRS/AFS) (Integrated Compliance Information System) - ICIS-04-1999-0041, FORMAL ENFORCEMENT ACTION Business SIC classification: GENERAL AUTOMOTIVE REPAIR SHOPS
COLLINS ELEMENTARY SCHOOL (1050 NW 2ND ST in DANIA, FL)
(Geographic Names Information System) (National Center for Education Statistics) - STATE ID-0331 Organizations: BROWARD COUNTY SCHOOL DISTRICT (SCHOOL DISTRICT)
DANIA ELEMENTARY SCHOOL (300 SE 2ND AVE in DANIA, FL)
(Geographic Names Information System) (National Center for Education Statistics) - STATE ID-0101 Organizations: BROWARD COUNTY SCHOOL DISTRICT (SCHOOL DISTRICT)
LINDSLEY LUMBER DISTRIBUTION SITE (1940 GRIFFEN RD in DANIA, FL)
(Integrated Compliance Information System) - ICIS-04-1998-0083, FORMAL ENFORCEMENT ACTION Small Quantity Generators, between 100 kg and 1000 kg of hazardous waste/month (Resource Conservation and Recovery Act (tracking hazardous waste)) - notification Business SIC classification: CUT STONE AND STONE PRODUCTS Organizations: MALLORY MAY, PROJECT MGR (CONTACT/OWNER)
OLSEN MIDDLE SCHOOL (330 SE 11 TER in DANIA, FL)
(National Center for Education Statistics) - STATE ID-0471 Organizations: BROWARD COUNTY SCHOOL DISTRICT (SCHOOL DISTRICT)
ACTION WORLD TRADING (1200 STIRLING RD. SUITE 8B in DANIA, FL)
ASSOCIATED MARINE TECHNOLOGIES (490 TAYLOR LANE in DANIA BEACH, FL)
National Pollutant Discharge Elimination System NON-MAJOR (Tracking pollutant discharge elimination systems) - permit Small Quantity Generators, between 100 kg and 1000 kg of hazardous waste/month (Resource Conservation and Recovery Act (tracking hazardous waste)) - notification Business SIC classification: BOAT BUILDING AND REPAIRING Organizations: MARK HANKE (CONTACT/OWNER)
, MARINEMAX MOTOR YACHT LLC (CONTACT/OWNER)
LIQUID CARBONIC CORP (2910 STERLING RD in DANIA, FL)
SUPERFUND (Superfund database) (Resource Conservation and Recovery Act (tracking hazardous waste)) TRI REPORTER (Tracking of toxic chemicals releasing facilities) Business SIC classification: INDUSTRIAL GASES Organizations: MARK SAMPLE, PLT MGR (CONTACT/OWNER)
Alternative names: LIQUID CABONIC INDUSTRIES CORP, LIQUID CARBONIC IND. CORP.
NAVAL SURFACE WARFARE CENTER CARDEROCK DIVISION DETACHMENT S FL TEST FACILITY (8010 NORTH OCEAN DRIVE in DANIA, FL) . Federal Facility. U.S. NAVY
Small Quantity Generators, between 100 kg and 1000 kg of hazardous waste/month (Resource Conservation and Recovery Act (tracking hazardous waste)) - notification (Resource Conservation and Recovery Act (tracking hazardous waste)) Organizations: ANN SWOPE (CONTACT/OWNER)
, NSWC CARDEROCK DIVISION (CONTACT/OWNER)
Alternative names: SOUTH FLORIDA TESTING FACILITY R, USN NAVAL SURFACE WEAPONS CENTER
Housing units lacking complete plumbing facilities: 2.0% Housing units lacking complete kitchen facilities: 4.2%
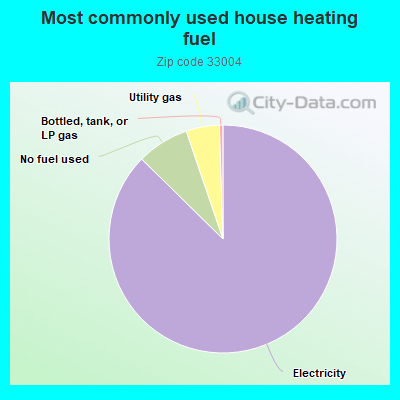
87.2%Electricity
7.4%No fuel used
4.7%Utility gas
0.5%Bottled, tank, or LP gas
Population in 1990: 12,552. Population change in the 1990s: +2,609 (+20.8%).
Place of birth for U.S.-born residents:
This state: 6,624
Northeast: 2,941
Midwest: 1,154
South: 780
West: 186
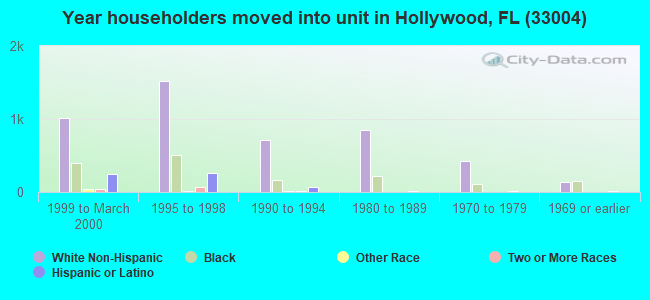
49% of the 33004 zip code residents lived in the same house 5 years ago. Out of people who lived in different houses, 61% lived in this county. Out of people who lived in different counties, 50% lived in Florida.
88% of the 33004 zip code residents lived in the same house 1 year ago. Out of people who lived in different houses, 42% moved from this county. Out of people who lived in different houses, 15% moved from different county within same state. Out of people who lived in different houses, 21% moved from different state. Out of people who lived in different houses, 28% moved from abroad.
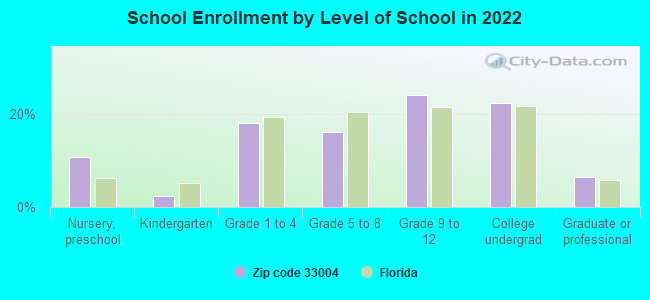
Private vs. public school enrollment:
Students in private schools in grades 1 to 8 (elementary and middle school): 55
Here:
5.3%
Florida:
15.8%
Students in private schools in grades 9 to 12 (high school): 48
Here:
6.7%
Florida:
12.9%
Students in private undergraduate colleges: 186
Here:
27.3%
Florida:
23.6%
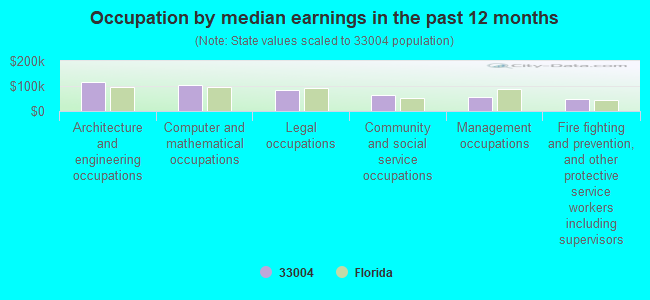
Occupation by median earnings in the past 12 months ($)
114,905Architecture and engineering occupations
102,738Computer and mathematical occupations
83,969Legal occupations
62,523Community and social service occupations
57,464Management occupations
46,151Fire fighting and prevention, and other protective service workers including supervisors
Companies with federal contracts located in this zip code:
SEAWARD SERVICES INC (255 EAST DANIA BEACH BLVD in DANIA BEACH, FL; small business) : $65,785,103 in 310 contractsfrom 1999 to 2006
Contracts for Engineering and Technical Services, Maintenance, Repair and Rebuilding of Equipment -- Ship and Marine Equipment, Other Quality Control, Testing and Inspection Services -- Ship and Marine Equipment, Marine Charter for Things, and moreby Navy, EPA, Air Force, U.S. Coast Guard, and others Signed by year:2000: $9,219,026; 2001: $6,829,800; 2002: $10,413,737; 2003: $9,304,532; 2004: $13,501,571; 2005: $11,130,650; 2006: $3,821,439.
Biggest contracts:
$5,144,201 with Navy for Engineering and Technical Services. Signed on 2000-12-01. Completion date: 2001-11-30.
$1,402,150, same as above.Signed on 2003-10-16. Completion date: 2004-11-30.
$1,391,150 with Navy for Maintenance, Repair and Rebuilding of Equipment -- Ship and Marine Equipment. Signed on 2004-11-12. Completion date: 2004-09-30.
$1,360,000, same as above.Signed on 2005-06-28. Completion date: 2005-11-30.
AMERICAN MARITIME OFFICERS (2 W DIXIE HWY in DANIA BEACH, FL; small business) : $129,900 in 3 contractsin 2000
$46,400 with U.S. Army Corps of Engineers - civil program financing only for Other Professional Services. Taking place in OH. Signed on 2000-10-12. Completion date: 2001-03-31.
$46,400 with U.S. Army Corps of Engineers - civil program financing only for Simulation. Taking place in OH. Signed on 2000-03-09. Completion date: 2000-09-30.
$37,100, same as above.Signed on 2000-01-26. Completion date: 2000-09-29.
RTM STAR CENTER (2 W DIXIE HWY in DANIA, FL)
$114,474 with U.S. Army Corps of Engineers - civil program financing only for Other Special Studies and Analyses. Signed on 2000-04-12. Completion date: 2000-02-28.
MATERIAL HANDLING SYSTEMS, INC (720 S W 4TH COURT in DANIA, FL; small business)
$29,679 with Air Force for Conveyors. Signed on 2005-09-12. Completion date: 2005-09-30.
SLC DANIA LLC (1825 GRIFFIN RD in DANIA, FL; small business) : $2,336 in 3 contractsfrom 2003 to 2004
$1,336 with Equal Employment Opportunity Commission for Lodging - Hotel/Motel. Signed on 2003-10-22. Completion date: 2003-10-22.
$1,000 with Army for Lodging - Hotel/Motel. Signed on 2004-03-11. Completion date: 2004-03-11.
$0 with Equal Employment Opportunity Commission for Lodging - Hotel/Motel. Signed on 2003-10-22. Completion date: 2003-10-22.
Top industries in this zip code by the number of employees in 2005:
2002 - 2018 National Fire Incident Reporting System (NFIRS) incidents
According to the data from the years 2002 - 2018 the average number of fire incidents per year is 55. The highest number of reported fires - 91 took place in 2002, and the least - 3 in 2006. The data has a dropping trend.
When looking into fire subcategories, the most reports belonged to: Outside Fires (34.1%), and Structure Fires (30.6%).
Fire incident types reported to NFIRS in Zip Code 33004


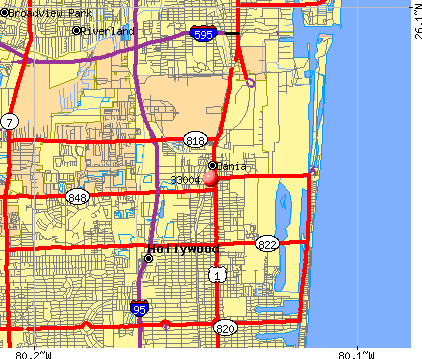 Nearest zip codes: 33315, 33019, 33020, 33316, 33312, 33021.
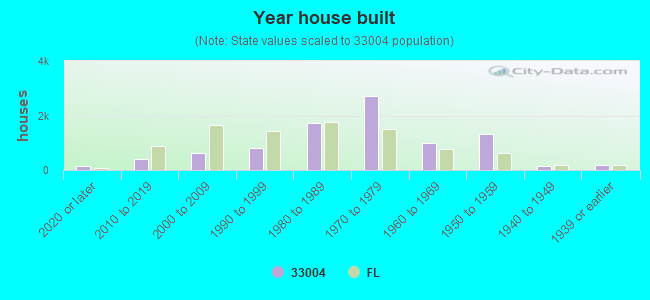


 According to the data from the years 2002 - 2018 the average number of fire incidents per year is 55. The highest number of reported fires - 91 took place in 2002, and the least - 3 in 2006. The data has a dropping trend.
 When looking into fire subcategories, the most reports belonged to: Outside Fires (34.1%), and Structure Fires (30.6%).