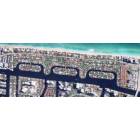
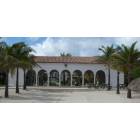
Golden Beach, Florida Submit your own pictures of this town and show them to the world
OSM Map
General Map
Google Map
MSN Map
OSM Map
General Map
Google Map
MSN Map
OSM Map
General Map
Google Map
MSN Map
OSM Map
General Map
Google Map
MSN Map
Please wait while loading the map...
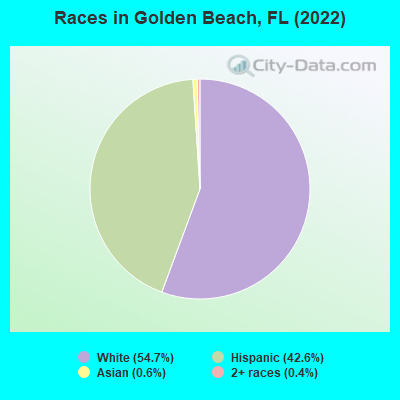
Population in 2022: 955 (100% urban, 0% rural). Population change since 2000: +3.9%Males: 452 Females: 503
March 2022 cost of living index in Golden Beach: 111.1 (more than average, U.S. average is 100) Percentage of residents living in poverty in 2022: 5.8%for White Non-Hispanic residents , 5.2% for Hispanic or Latino residents , 11.6% for two or more races residents )Business Search - 14 Million verified businesses
Data:
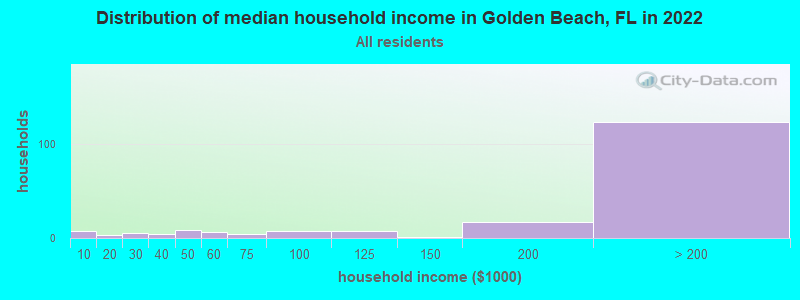
Median household income ($)
Median household income (% change since 2000)
Household income diversity
Ratio of average income to average house value (%)
Ratio of average income to average rent
Median household income ($) - White
Median household income ($) - Black or African American
Median household income ($) - Asian
Median household income ($) - Hispanic or Latino
Median household income ($) - American Indian and Alaska Native
Median household income ($) - Multirace
Median household income ($) - Other Race
Median household income for houses/condos with a mortgage ($)
Median household income for apartments without a mortgage ($)
Races - White alone (%)
Races - White alone (% change since 2000)
Races - Black alone (%)
Races - Black alone (% change since 2000)
Races - American Indian alone (%)
Races - American Indian alone (% change since 2000)
Races - Asian alone (%)
Races - Asian alone (% change since 2000)
Races - Hispanic (%)
Races - Hispanic (% change since 2000)
Races - Native Hawaiian and Other Pacific Islander alone (%)
Races - Native Hawaiian and Other Pacific Islander alone (% change since 2000)
Races - Two or more races (%)
Races - Two or more races (% change since 2000)
Races - Other race alone (%)
Races - Other race alone (% change since 2000)
Racial diversity
Unemployment (%)
Unemployment (% change since 2000)
Unemployment (%) - White
Unemployment (%) - Black or African American
Unemployment (%) - Asian
Unemployment (%) - Hispanic or Latino
Unemployment (%) - American Indian and Alaska Native
Unemployment (%) - Multirace
Unemployment (%) - Other Race
Population density (people per square mile)
Population - Males (%)
Population - Females (%)
Population - Males (%) - White
Population - Males (%) - Black or African American
Population - Males (%) - Asian
Population - Males (%) - Hispanic or Latino
Population - Males (%) - American Indian and Alaska Native
Population - Males (%) - Multirace
Population - Males (%) - Other Race
Population - Females (%) - White
Population - Females (%) - Black or African American
Population - Females (%) - Asian
Population - Females (%) - Hispanic or Latino
Population - Females (%) - American Indian and Alaska Native
Population - Females (%) - Multirace
Population - Females (%) - Other Race
Coronavirus confirmed cases (Apr 28, 2024)
Deaths caused by coronavirus (Apr 28, 2024)
Coronavirus confirmed cases (per 100k population) (Apr 28, 2024)
Deaths caused by coronavirus (per 100k population) (Apr 28, 2024)
Daily increase in number of cases (Apr 28, 2024)
Weekly increase in number of cases (Apr 28, 2024)
Cases doubled (in days) (Apr 28, 2024)
Hospitalized patients (Apr 18, 2022)
Negative test results (Apr 18, 2022)
Total test results (Apr 18, 2022)
COVID Vaccine doses distributed (per 100k population) (Sep 19, 2023)
COVID Vaccine doses administered (per 100k population) (Sep 19, 2023)
COVID Vaccine doses distributed (Sep 19, 2023)
COVID Vaccine doses administered (Sep 19, 2023)
Likely homosexual households (%)
Likely homosexual households (% change since 2000)
Likely homosexual households - Lesbian couples (%)
Likely homosexual households - Lesbian couples (% change since 2000)
Likely homosexual households - Gay men (%)
Likely homosexual households - Gay men (% change since 2000)
Cost of living index
Median gross rent ($)
Median contract rent ($)
Median monthly housing costs ($)
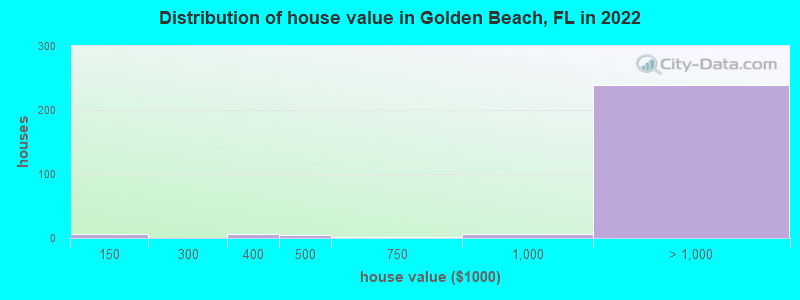
Median house or condo value ($)
Median house or condo value ($ change since 2000)
Mean house or condo value by units in structure - 1, detached ($)
Mean house or condo value by units in structure - 1, attached ($)
Mean house or condo value by units in structure - 2 ($)
Mean house or condo value by units in structure by units in structure - 3 or 4 ($)
Mean house or condo value by units in structure - 5 or more ($)
Mean house or condo value by units in structure - Boat, RV, van, etc. ($)
Mean house or condo value by units in structure - Mobile home ($)
Median house or condo value ($) - White
Median house or condo value ($) - Black or African American
Median house or condo value ($) - Asian
Median house or condo value ($) - Hispanic or Latino
Median house or condo value ($) - American Indian and Alaska Native
Median house or condo value ($) - Multirace
Median house or condo value ($) - Other Race
Median resident age
Resident age diversity
Median resident age - Males
Median resident age - Females
Median resident age - White
Median resident age - Black or African American
Median resident age - Asian
Median resident age - Hispanic or Latino
Median resident age - American Indian and Alaska Native
Median resident age - Multirace
Median resident age - Other Race
Median resident age - Males - White
Median resident age - Males - Black or African American
Median resident age - Males - Asian
Median resident age - Males - Hispanic or Latino
Median resident age - Males - American Indian and Alaska Native
Median resident age - Males - Multirace
Median resident age - Males - Other Race
Median resident age - Females - White
Median resident age - Females - Black or African American
Median resident age - Females - Asian
Median resident age - Females - Hispanic or Latino
Median resident age - Females - American Indian and Alaska Native
Median resident age - Females - Multirace
Median resident age - Females - Other Race
Commute - mean travel time to work (minutes)
Travel time to work - Less than 5 minutes (%)
Travel time to work - Less than 5 minutes (% change since 2000)
Travel time to work - 5 to 9 minutes (%)
Travel time to work - 5 to 9 minutes (% change since 2000)
Travel time to work - 10 to 19 minutes (%)
Travel time to work - 10 to 19 minutes (% change since 2000)
Travel time to work - 20 to 29 minutes (%)
Travel time to work - 20 to 29 minutes (% change since 2000)
Travel time to work - 30 to 39 minutes (%)
Travel time to work - 30 to 39 minutes (% change since 2000)
Travel time to work - 40 to 59 minutes (%)
Travel time to work - 40 to 59 minutes (% change since 2000)
Travel time to work - 60 to 89 minutes (%)
Travel time to work - 60 to 89 minutes (% change since 2000)
Travel time to work - 90 or more minutes (%)
Travel time to work - 90 or more minutes (% change since 2000)
Marital status - Never married (%)
Marital status - Now married (%)
Marital status - Separated (%)
Marital status - Widowed (%)
Marital status - Divorced (%)
Median family income ($)
Median family income (% change since 2000)
Median non-family income ($)
Median non-family income (% change since 2000)
Median per capita income ($)
Median per capita income (% change since 2000)
Median family income ($) - White
Median family income ($) - Black or African American
Median family income ($) - Asian
Median family income ($) - Hispanic or Latino
Median family income ($) - American Indian and Alaska Native
Median family income ($) - Multirace
Median family income ($) - Other Race
Median year house/condo built
Median year apartment built
Year house built - Built 2005 or later (%)
Year house built - Built 2000 to 2004 (%)
Year house built - Built 1990 to 1999 (%)
Year house built - Built 1980 to 1989 (%)
Year house built - Built 1970 to 1979 (%)
Year house built - Built 1960 to 1969 (%)
Year house built - Built 1950 to 1959 (%)
Year house built - Built 1940 to 1949 (%)
Year house built - Built 1939 or earlier (%)
Average household size
Household density (households per square mile)
Average household size - White
Average household size - Black or African American
Average household size - Asian
Average household size - Hispanic or Latino
Average household size - American Indian and Alaska Native
Average household size - Multirace
Average household size - Other Race
Occupied housing units (%)
Vacant housing units (%)
Owner occupied housing units (%)
Renter occupied housing units (%)
Vacancy status - For rent (%)
Vacancy status - For sale only (%)
Vacancy status - Rented or sold, not occupied (%)
Vacancy status - For seasonal, recreational, or occasional use (%)
Vacancy status - For migrant workers (%)
Vacancy status - Other vacant (%)
Residents with income below the poverty level (%)
Residents with income below 50% of the poverty level (%)
Children below poverty level (%)
Poor families by family type - Married-couple family (%)
Poor families by family type - Male, no wife present (%)
Poor families by family type - Female, no husband present (%)
Poverty status for native-born residents (%)
Poverty status for foreign-born residents (%)
Poverty among high school graduates not in families (%)
Poverty among people who did not graduate high school not in families (%)
Residents with income below the poverty level (%) - White
Residents with income below the poverty level (%) - Black or African American
Residents with income below the poverty level (%) - Asian
Residents with income below the poverty level (%) - Hispanic or Latino
Residents with income below the poverty level (%) - American Indian and Alaska Native
Residents with income below the poverty level (%) - Multirace
Residents with income below the poverty level (%) - Other Race
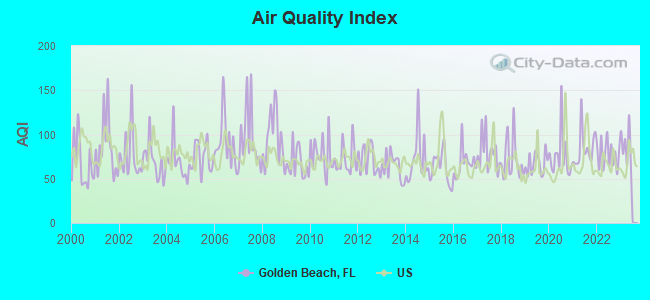
Air pollution - Air Quality Index (AQI)
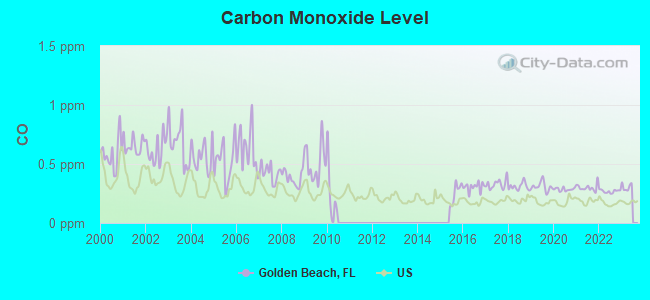
Air pollution - CO
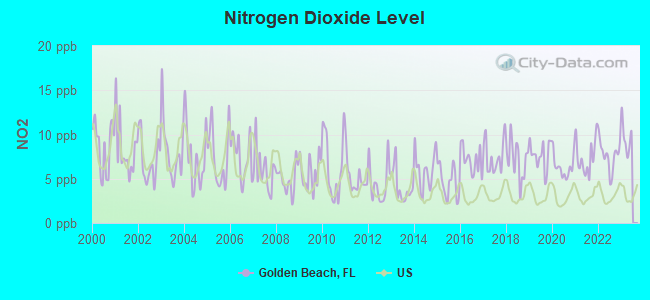
Air pollution - NO2
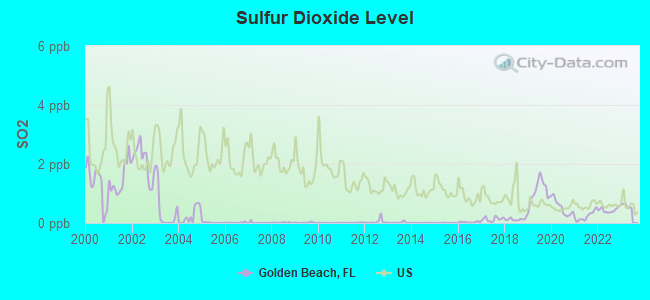
Air pollution - SO2
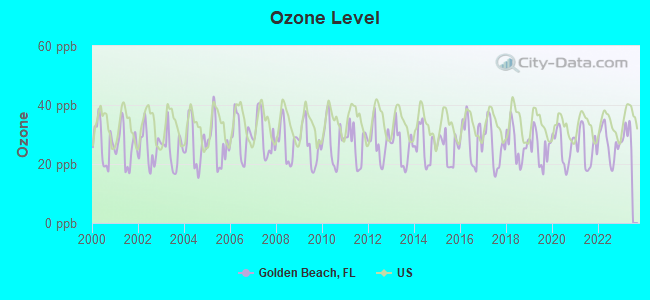
Air pollution - Ozone
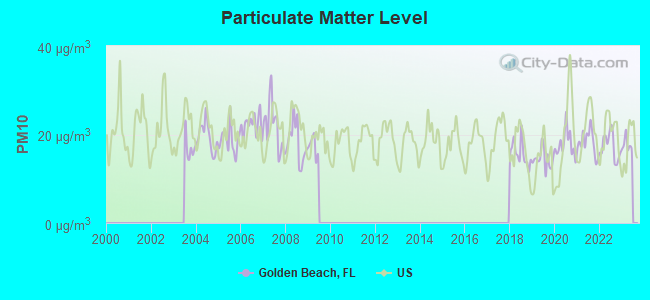
Air pollution - PM10
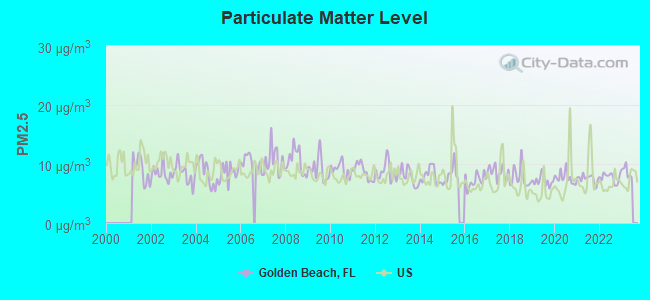
Air pollution - PM25
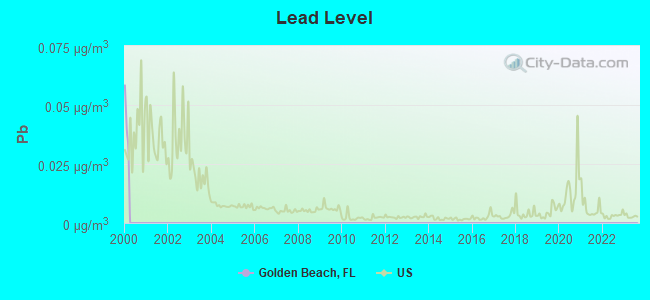
Air pollution - Pb
Crime - Murders per 100,000 population
Crime - Rapes per 100,000 population
Crime - Robberies per 100,000 population
Crime - Assaults per 100,000 population
Crime - Burglaries per 100,000 population
Crime - Thefts per 100,000 population
Crime - Auto thefts per 100,000 population
Crime - Arson per 100,000 population
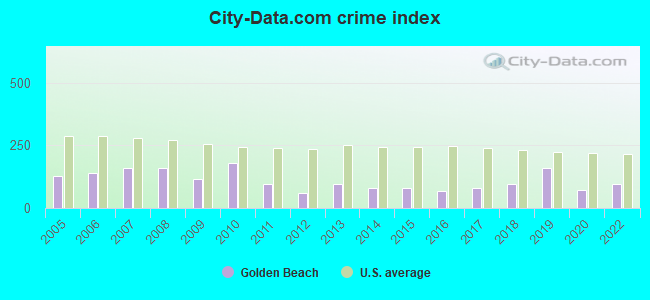
Crime - City-data.com crime index
Crime - Violent crime index
Crime - Property crime index
Crime - Murders per 100,000 population (5 year average)
Crime - Rapes per 100,000 population (5 year average)
Crime - Robberies per 100,000 population (5 year average)
Crime - Assaults per 100,000 population (5 year average)
Crime - Burglaries per 100,000 population (5 year average)
Crime - Thefts per 100,000 population (5 year average)
Crime - Auto thefts per 100,000 population (5 year average)
Crime - Arson per 100,000 population (5 year average)
Crime - City-data.com crime index (5 year average)
Crime - Violent crime index (5 year average)
Crime - Property crime index (5 year average)
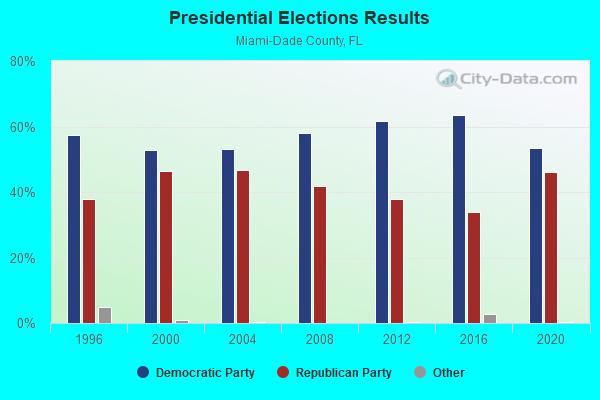
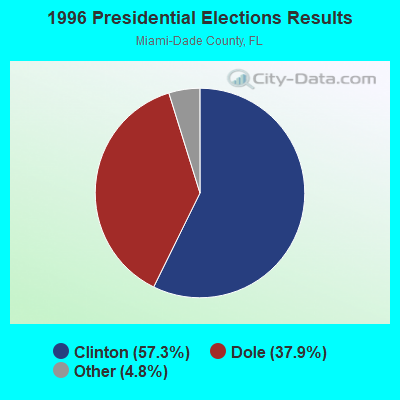
1996 Presidential Elections Results (%) - Democratic Party (Clinton)
1996 Presidential Elections Results (%) - Republican Party (Dole)
1996 Presidential Elections Results (%) - Other
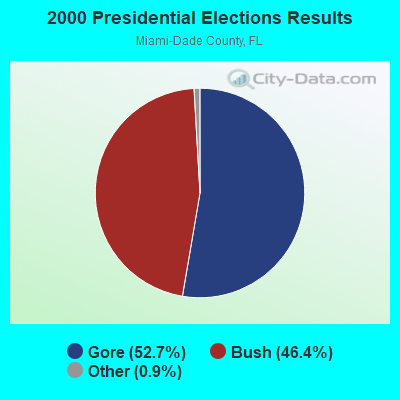
2000 Presidential Elections Results (%) - Democratic Party (Gore)
2000 Presidential Elections Results (%) - Republican Party (Bush)
2000 Presidential Elections Results (%) - Other
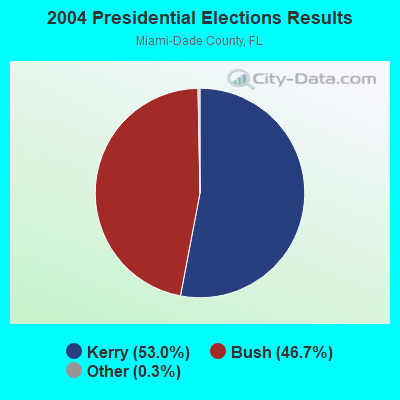
2004 Presidential Elections Results (%) - Democratic Party (Kerry)
2004 Presidential Elections Results (%) - Republican Party (Bush)
2004 Presidential Elections Results (%) - Other
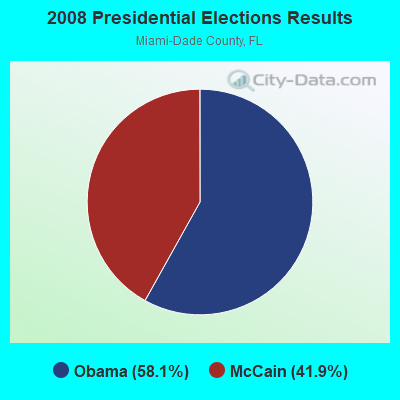
2008 Presidential Elections Results (%) - Democratic Party (Obama)
2008 Presidential Elections Results (%) - Republican Party (McCain)
2008 Presidential Elections Results (%) - Other
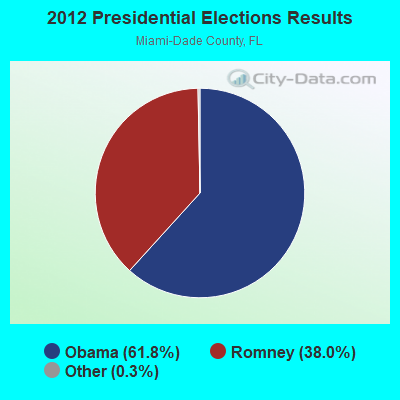
2012 Presidential Elections Results (%) - Democratic Party (Obama)
2012 Presidential Elections Results (%) - Republican Party (Romney)
2012 Presidential Elections Results (%) - Other
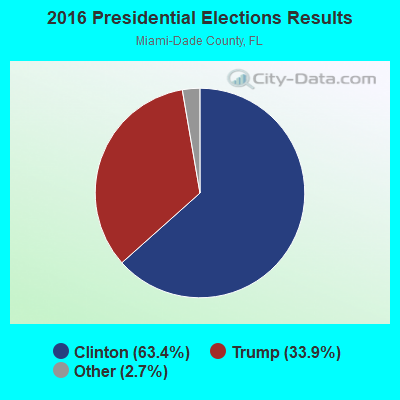
2016 Presidential Elections Results (%) - Democratic Party (Clinton)
2016 Presidential Elections Results (%) - Republican Party (Trump)
2016 Presidential Elections Results (%) - Other
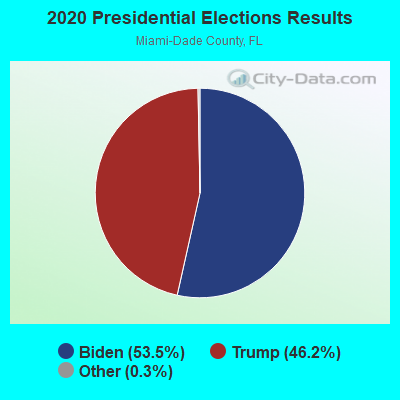
2020 Presidential Elections Results (%) - Democratic Party (Biden)
2020 Presidential Elections Results (%) - Republican Party (Trump)
2020 Presidential Elections Results (%) - Other
Ancestries Reported - Arab (%)
Ancestries Reported - Czech (%)
Ancestries Reported - Danish (%)
Ancestries Reported - Dutch (%)
Ancestries Reported - English (%)
Ancestries Reported - French (%)
Ancestries Reported - French Canadian (%)
Ancestries Reported - German (%)
Ancestries Reported - Greek (%)
Ancestries Reported - Hungarian (%)
Ancestries Reported - Irish (%)
Ancestries Reported - Italian (%)
Ancestries Reported - Lithuanian (%)
Ancestries Reported - Norwegian (%)
Ancestries Reported - Polish (%)
Ancestries Reported - Portuguese (%)
Ancestries Reported - Russian (%)
Ancestries Reported - Scotch-Irish (%)
Ancestries Reported - Scottish (%)
Ancestries Reported - Slovak (%)
Ancestries Reported - Subsaharan African (%)
Ancestries Reported - Swedish (%)
Ancestries Reported - Swiss (%)
Ancestries Reported - Ukrainian (%)
Ancestries Reported - United States (%)
Ancestries Reported - Welsh (%)
Ancestries Reported - West Indian (%)
Ancestries Reported - Other (%)
Educational Attainment - No schooling completed (%)
Educational Attainment - Less than high school (%)
Educational Attainment - High school or equivalent (%)
Educational Attainment - Less than 1 year of college (%)
Educational Attainment - 1 or more years of college (%)
Educational Attainment - Associate degree (%)
Educational Attainment - Bachelor's degree (%)
Educational Attainment - Master's degree (%)
Educational Attainment - Professional school degree (%)
Educational Attainment - Doctorate degree (%)
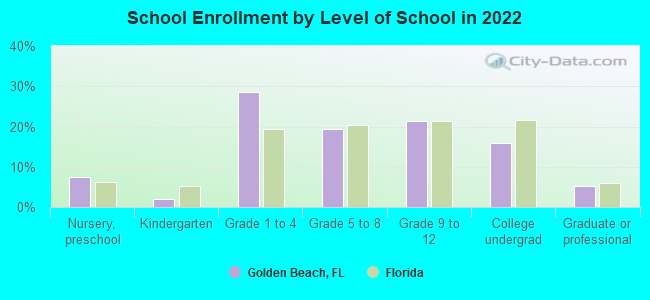
School Enrollment - Nursery, preschool (%)
School Enrollment - Kindergarten (%)
School Enrollment - Grade 1 to 4 (%)
School Enrollment - Grade 5 to 8 (%)
School Enrollment - Grade 9 to 12 (%)
School Enrollment - College undergrad (%)
School Enrollment - Graduate or professional (%)
School Enrollment - Not enrolled in school (%)
School enrollment - Public schools (%)
School enrollment - Private schools (%)
School enrollment - Not enrolled (%)
Median number of rooms in houses and condos
Median number of rooms in apartments
Housing units lacking complete plumbing facilities (%)
Housing units lacking complete kitchen facilities (%)
Density of houses
Urban houses (%)
Rural houses (%)
Households with people 60 years and over (%)
Households with people 65 years and over (%)
Households with people 75 years and over (%)
Households with one or more nonrelatives (%)
Households with no nonrelatives (%)
Population in households (%)
Family households (%)
Nonfamily households (%)
Population in families (%)
Family households with own children (%)
Median number of bedrooms in owner occupied houses
Mean number of bedrooms in owner occupied houses
Median number of bedrooms in renter occupied houses
Mean number of bedrooms in renter occupied houses
Median number of vehichles in owner occupied houses
Mean number of vehichles in owner occupied houses
Median number of vehichles in renter occupied houses
Mean number of vehichles in renter occupied houses
Mortgage status - with mortgage (%)
Mortgage status - with second mortgage (%)
Mortgage status - with home equity loan (%)
Mortgage status - with both second mortgage and home equity loan (%)
Mortgage status - without a mortgage (%)
Average family size
Average family size - White
Average family size - Black or African American
Average family size - Asian
Average family size - Hispanic or Latino
Average family size - American Indian and Alaska Native
Average family size - Multirace
Average family size - Other Race
Geographical mobility - Same house 1 year ago (%)
Geographical mobility - Moved within same county (%)
Geographical mobility - Moved from different county within same state (%)
Geographical mobility - Moved from different state (%)
Geographical mobility - Moved from abroad (%)
Place of birth - Born in state of residence (%)
Place of birth - Born in other state (%)
Place of birth - Native, outside of US (%)
Place of birth - Foreign born (%)
Housing units in structures - 1, detached (%)
Housing units in structures - 1, attached (%)
Housing units in structures - 2 (%)
Housing units in structures - 3 or 4 (%)
Housing units in structures - 5 to 9 (%)
Housing units in structures - 10 to 19 (%)
Housing units in structures - 20 to 49 (%)
Housing units in structures - 50 or more (%)
Housing units in structures - Mobile home (%)
Housing units in structures - Boat, RV, van, etc. (%)
House/condo owner moved in on average (years ago)
Renter moved in on average (years ago)
Year householder moved into unit - Moved in 1999 to March 2000 (%)
Year householder moved into unit - Moved in 1995 to 1998 (%)
Year householder moved into unit - Moved in 1990 to 1994 (%)
Year householder moved into unit - Moved in 1980 to 1989 (%)
Year householder moved into unit - Moved in 1970 to 1979 (%)
Year householder moved into unit - Moved in 1969 or earlier (%)
Means of transportation to work - Drove car alone (%)
Means of transportation to work - Carpooled (%)
Means of transportation to work - Public transportation (%)
Means of transportation to work - Bus or trolley bus (%)
Means of transportation to work - Streetcar or trolley car (%)
Means of transportation to work - Subway or elevated (%)
Means of transportation to work - Railroad (%)
Means of transportation to work - Ferryboat (%)
Means of transportation to work - Taxicab (%)
Means of transportation to work - Motorcycle (%)
Means of transportation to work - Bicycle (%)
Means of transportation to work - Walked (%)
Means of transportation to work - Other means (%)
Working at home (%)
Industry diversity
Most Common Industries - Agriculture, forestry, fishing and hunting, and mining (%)
Most Common Industries - Agriculture, forestry, fishing and hunting (%)
Most Common Industries - Mining, quarrying, and oil and gas extraction (%)
Most Common Industries - Construction (%)
Most Common Industries - Manufacturing (%)
Most Common Industries - Wholesale trade (%)
Most Common Industries - Retail trade (%)
Most Common Industries - Transportation and warehousing, and utilities (%)
Most Common Industries - Transportation and warehousing (%)
Most Common Industries - Utilities (%)
Most Common Industries - Information (%)
Most Common Industries - Finance and insurance, and real estate and rental and leasing (%)
Most Common Industries - Finance and insurance (%)
Most Common Industries - Real estate and rental and leasing (%)
Most Common Industries - Professional, scientific, and management, and administrative and waste management services (%)
Most Common Industries - Professional, scientific, and technical services (%)
Most Common Industries - Management of companies and enterprises (%)
Most Common Industries - Administrative and support and waste management services (%)
Most Common Industries - Educational services, and health care and social assistance (%)
Most Common Industries - Educational services (%)
Most Common Industries - Health care and social assistance (%)
Most Common Industries - Arts, entertainment, and recreation, and accommodation and food services (%)
Most Common Industries - Arts, entertainment, and recreation (%)
Most Common Industries - Accommodation and food services (%)
Most Common Industries - Other services, except public administration (%)
Most Common Industries - Public administration (%)
Occupation diversity
Most Common Occupations - Management, business, science, and arts occupations (%)
Most Common Occupations - Management, business, and financial occupations (%)
Most Common Occupations - Management occupations (%)
Most Common Occupations - Business and financial operations occupations (%)
Most Common Occupations - Computer, engineering, and science occupations (%)
Most Common Occupations - Computer and mathematical occupations (%)
Most Common Occupations - Architecture and engineering occupations (%)
Most Common Occupations - Life, physical, and social science occupations (%)
Most Common Occupations - Education, legal, community service, arts, and media occupations (%)
Most Common Occupations - Community and social service occupations (%)
Most Common Occupations - Legal occupations (%)
Most Common Occupations - Education, training, and library occupations (%)
Most Common Occupations - Arts, design, entertainment, sports, and media occupations (%)
Most Common Occupations - Healthcare practitioners and technical occupations (%)
Most Common Occupations - Health diagnosing and treating practitioners and other technical occupations (%)
Most Common Occupations - Health technologists and technicians (%)
Most Common Occupations - Service occupations (%)
Most Common Occupations - Healthcare support occupations (%)
Most Common Occupations - Protective service occupations (%)
Most Common Occupations - Fire fighting and prevention, and other protective service workers including supervisors (%)
Most Common Occupations - Law enforcement workers including supervisors (%)
Most Common Occupations - Food preparation and serving related occupations (%)
Most Common Occupations - Building and grounds cleaning and maintenance occupations (%)
Most Common Occupations - Personal care and service occupations (%)
Most Common Occupations - Sales and office occupations (%)
Most Common Occupations - Sales and related occupations (%)
Most Common Occupations - Office and administrative support occupations (%)
Most Common Occupations - Natural resources, construction, and maintenance occupations (%)
Most Common Occupations - Farming, fishing, and forestry occupations (%)
Most Common Occupations - Construction and extraction occupations (%)
Most Common Occupations - Installation, maintenance, and repair occupations (%)
Most Common Occupations - Production, transportation, and material moving occupations (%)
Most Common Occupations - Production occupations (%)
Most Common Occupations - Transportation occupations (%)
Most Common Occupations - Material moving occupations (%)
People in Group quarters - Institutionalized population (%)
People in Group quarters - Correctional institutions (%)
People in Group quarters - Federal prisons and detention centers (%)
People in Group quarters - Halfway houses (%)
People in Group quarters - Local jails and other confinement facilities (including police lockups) (%)
People in Group quarters - Military disciplinary barracks (%)
People in Group quarters - State prisons (%)
People in Group quarters - Other types of correctional institutions (%)
People in Group quarters - Nursing homes (%)
People in Group quarters - Hospitals/wards, hospices, and schools for the handicapped (%)
People in Group quarters - Hospitals/wards and hospices for chronically ill (%)
People in Group quarters - Hospices or homes for chronically ill (%)
People in Group quarters - Military hospitals or wards for chronically ill (%)
People in Group quarters - Other hospitals or wards for chronically ill (%)
People in Group quarters - Hospitals or wards for drug/alcohol abuse (%)
People in Group quarters - Mental (Psychiatric) hospitals or wards (%)
People in Group quarters - Schools, hospitals, or wards for the mentally retarded (%)
People in Group quarters - Schools, hospitals, or wards for the physically handicapped (%)
People in Group quarters - Institutions for the deaf (%)
People in Group quarters - Institutions for the blind (%)
People in Group quarters - Orthopedic wards and institutions for the physically handicapped (%)
People in Group quarters - Wards in general hospitals for patients who have no usual home elsewhere (%)
People in Group quarters - Wards in military hospitals for patients who have no usual home elsewhere (%)
People in Group quarters - Juvenile institutions (%)
People in Group quarters - Long-term care (%)
People in Group quarters - Homes for abused, dependent, and neglected children (%)
People in Group quarters - Residential treatment centers for emotionally disturbed children (%)
People in Group quarters - Training schools for juvenile delinquents (%)
People in Group quarters - Short-term care, detention or diagnostic centers for delinquent children (%)
People in Group quarters - Type of juvenile institution unknown (%)
People in Group quarters - Noninstitutionalized population (%)
People in Group quarters - College dormitories (includes college quarters off campus) (%)
People in Group quarters - Military quarters (%)
People in Group quarters - On base (%)
People in Group quarters - Barracks, unaccompanied personnel housing (UPH), (Enlisted/Officer), ;and similar group living quarters for military personnel (%)
People in Group quarters - Transient quarters for temporary residents (%)
People in Group quarters - Military ships (%)
People in Group quarters - Group homes (%)
People in Group quarters - Homes or halfway houses for drug/alcohol abuse (%)
People in Group quarters - Homes for the mentally ill (%)
People in Group quarters - Homes for the mentally retarded (%)
People in Group quarters - Homes for the physically handicapped (%)
People in Group quarters - Other group homes (%)
People in Group quarters - Religious group quarters (%)
People in Group quarters - Dormitories (%)
People in Group quarters - Agriculture workers' dormitories on farms (%)
People in Group quarters - Job Corps and vocational training facilities (%)
People in Group quarters - Other workers' dormitories (%)
People in Group quarters - Crews of maritime vessels (%)
People in Group quarters - Other nonhousehold living situations (%)
People in Group quarters - Other noninstitutional group quarters (%)
Residents speaking English at home (%)
Residents speaking English at home - Born in the United States (%)
Residents speaking English at home - Native, born elsewhere (%)
Residents speaking English at home - Foreign born (%)
Residents speaking Spanish at home (%)
Residents speaking Spanish at home - Born in the United States (%)
Residents speaking Spanish at home - Native, born elsewhere (%)
Residents speaking Spanish at home - Foreign born (%)
Residents speaking other language at home (%)
Residents speaking other language at home - Born in the United States (%)
Residents speaking other language at home - Native, born elsewhere (%)
Residents speaking other language at home - Foreign born (%)
Class of Workers - Employee of private company (%)
Class of Workers - Self-employed in own incorporated business (%)
Class of Workers - Private not-for-profit wage and salary workers (%)
Class of Workers - Local government workers (%)
Class of Workers - State government workers (%)
Class of Workers - Federal government workers (%)
Class of Workers - Self-employed workers in own not incorporated business and Unpaid family workers (%)
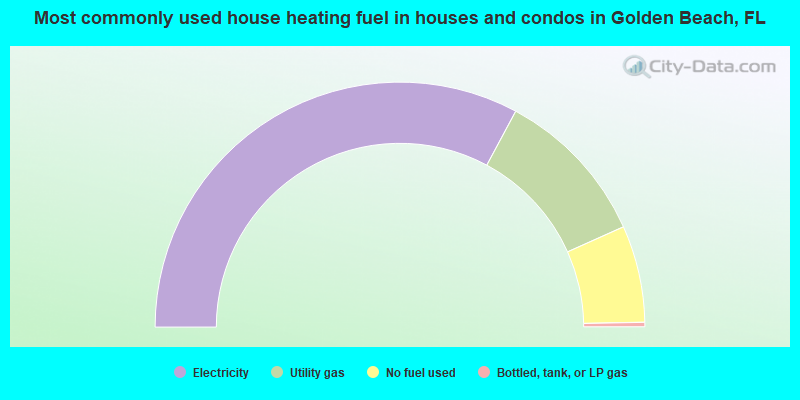
House heating fuel used in houses and condos - Utility gas (%)
House heating fuel used in houses and condos - Bottled, tank, or LP gas (%)
House heating fuel used in houses and condos - Electricity (%)
House heating fuel used in houses and condos - Fuel oil, kerosene, etc. (%)
House heating fuel used in houses and condos - Coal or coke (%)
House heating fuel used in houses and condos - Wood (%)
House heating fuel used in houses and condos - Solar energy (%)
House heating fuel used in houses and condos - Other fuel (%)
House heating fuel used in houses and condos - No fuel used (%)
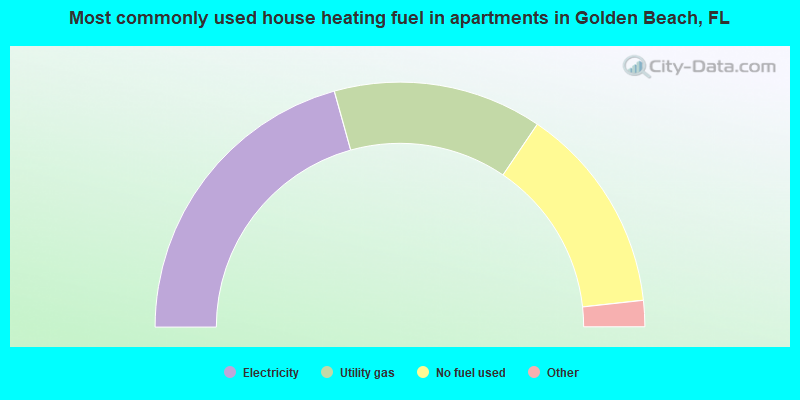
House heating fuel used in apartments - Utility gas (%)
House heating fuel used in apartments - Bottled, tank, or LP gas (%)
House heating fuel used in apartments - Electricity (%)
House heating fuel used in apartments - Fuel oil, kerosene, etc. (%)
House heating fuel used in apartments - Coal or coke (%)
House heating fuel used in apartments - Wood (%)
House heating fuel used in apartments - Solar energy (%)
House heating fuel used in apartments - Other fuel (%)
House heating fuel used in apartments - No fuel used (%)
Armed forces status - In Armed Forces (%)
Armed forces status - Civilian (%)
Armed forces status - Civilian - Veteran (%)
Armed forces status - Civilian - Nonveteran (%)
Fatal accidents locations in years 2005-2021
Fatal accidents locations in 2005
Fatal accidents locations in 2006
Fatal accidents locations in 2007
Fatal accidents locations in 2008
Fatal accidents locations in 2009
Fatal accidents locations in 2010
Fatal accidents locations in 2011
Fatal accidents locations in 2012
Fatal accidents locations in 2013
Fatal accidents locations in 2014
Fatal accidents locations in 2015
Fatal accidents locations in 2016
Fatal accidents locations in 2017
Fatal accidents locations in 2018
Fatal accidents locations in 2019
Fatal accidents locations in 2020
Fatal accidents locations in 2021
Alcohol use - People drinking some alcohol every month (%)
Alcohol use - People not drinking at all (%)
Alcohol use - Average days/month drinking alcohol
Alcohol use - Average drinks/week
Alcohol use - Average days/year people drink much
Audiometry - Average condition of hearing (%)
Audiometry - People that can hear a whisper from across a quiet room (%)
Audiometry - People that can hear normal voice from across a quiet room (%)
Audiometry - Ears ringing, roaring, buzzing (%)
Audiometry - Had a job exposure to loud noise (%)
Audiometry - Had off-work exposure to loud noise (%)
Blood Pressure & Cholesterol - Has high blood pressure (%)
Blood Pressure & Cholesterol - Checking blood pressure at home (%)
Blood Pressure & Cholesterol - Frequently checking blood cholesterol (%)
Blood Pressure & Cholesterol - Has high cholesterol level (%)
Consumer Behavior - Money monthly spent on food at supermarket/grocery store
Consumer Behavior - Money monthly spent on food at other stores
Consumer Behavior - Money monthly spent on eating out
Consumer Behavior - Money monthly spent on carryout/delivered foods
Consumer Behavior - Income spent on food at supermarket/grocery store (%)
Consumer Behavior - Income spent on food at other stores (%)
Consumer Behavior - Income spent on eating out (%)
Consumer Behavior - Income spent on carryout/delivered foods (%)
Current Health Status - General health condition (%)
Current Health Status - Blood donors (%)
Current Health Status - Has blood ever tested for HIV virus (%)
Current Health Status - Left-handed people (%)
Dermatology - People using sunscreen (%)
Diabetes - Diabetics (%)
Diabetes - Had a blood test for high blood sugar (%)
Diabetes - People taking insulin (%)
Diet Behavior & Nutrition - Diet health (%)
Diet Behavior & Nutrition - Milk product consumption (# of products/month)
Diet Behavior & Nutrition - Meals not home prepared (#/week)
Diet Behavior & Nutrition - Meals from fast food or pizza place (#/week)
Diet Behavior & Nutrition - Ready-to-eat foods (#/month)
Diet Behavior & Nutrition - Frozen meals/pizza (#/month)
Drug Use - People that ever used marijuana or hashish (%)
Drug Use - Ever used hard drugs (%)
Drug Use - Ever used any form of cocaine (%)
Drug Use - Ever used heroin (%)
Drug Use - Ever used methamphetamine (%)
Health Insurance - People covered by health insurance (%)
Kidney Conditions-Urology - Avg. # of times urinating at night
Medical Conditions - People with asthma (%)
Medical Conditions - People with anemia (%)
Medical Conditions - People with psoriasis (%)
Medical Conditions - People with overweight (%)
Medical Conditions - Elderly people having difficulties in thinking or remembering (%)
Medical Conditions - People who ever received blood transfusion (%)
Medical Conditions - People having trouble seeing even with glass/contacts (%)
Medical Conditions - People with arthritis (%)
Medical Conditions - People with gout (%)
Medical Conditions - People with congestive heart failure (%)
Medical Conditions - People with coronary heart disease (%)
Medical Conditions - People with angina pectoris (%)
Medical Conditions - People who ever had heart attack (%)
Medical Conditions - People who ever had stroke (%)
Medical Conditions - People with emphysema (%)
Medical Conditions - People with thyroid problem (%)
Medical Conditions - People with chronic bronchitis (%)
Medical Conditions - People with any liver condition (%)
Medical Conditions - People who ever had cancer or malignancy (%)
Mental Health - People who have little interest in doing things (%)
Mental Health - People feeling down, depressed, or hopeless (%)
Mental Health - People who have trouble sleeping or sleeping too much (%)
Mental Health - People feeling tired or having little energy (%)
Mental Health - People with poor appetite or overeating (%)
Mental Health - People feeling bad about themself (%)
Mental Health - People who have trouble concentrating on things (%)
Mental Health - People moving or speaking slowly or too fast (%)
Mental Health - People having thoughts they would be better off dead (%)
Oral Health - Average years since last visit a dentist
Oral Health - People embarrassed because of mouth (%)
Oral Health - People with gum disease (%)
Oral Health - General health of teeth and gums (%)
Oral Health - Average days a week using dental floss/device
Oral Health - Average days a week using mouthwash for dental problem
Oral Health - Average number of teeth
Pesticide Use - Households using pesticides to control insects (%)
Pesticide Use - Households using pesticides to kill weeds (%)
Physical Activity - People doing vigorous-intensity work activities (%)
Physical Activity - People doing moderate-intensity work activities (%)
Physical Activity - People walking or bicycling (%)
Physical Activity - People doing vigorous-intensity recreational activities (%)
Physical Activity - People doing moderate-intensity recreational activities (%)
Physical Activity - Average hours a day doing sedentary activities
Physical Activity - Average hours a day watching TV or videos
Physical Activity - Average hours a day using computer
Physical Functioning - People having limitations keeping them from working (%)
Physical Functioning - People limited in amount of work they can do (%)
Physical Functioning - People that need special equipment to walk (%)
Physical Functioning - People experiencing confusion/memory problems (%)
Physical Functioning - People requiring special healthcare equipment (%)
Prescription Medications - Average number of prescription medicines taking
Preventive Aspirin Use - Adults 40+ taking low-dose aspirin (%)
Reproductive Health - Vaginal deliveries (%)
Reproductive Health - Cesarean deliveries (%)
Reproductive Health - Deliveries resulted in a live birth (%)
Reproductive Health - Pregnancies resulted in a delivery (%)
Reproductive Health - Women breastfeeding newborns (%)
Reproductive Health - Women that had a hysterectomy (%)
Reproductive Health - Women that had both ovaries removed (%)
Reproductive Health - Women that have ever taken birth control pills (%)
Reproductive Health - Women taking birth control pills (%)
Reproductive Health - Women that have ever used Depo-Provera or injectables (%)
Reproductive Health - Women that have ever used female hormones (%)
Sexual Behavior - People 18+ that ever had sex (vaginal, anal, or oral) (%)
Sexual Behavior - Males 18+ that ever had vaginal sex with a woman (%)
Sexual Behavior - Males 18+ that ever performed oral sex on a woman (%)
Sexual Behavior - Males 18+ that ever had anal sex with a woman (%)
Sexual Behavior - Males 18+ that ever had any sex with a man (%)
Sexual Behavior - Females 18+ that ever had vaginal sex with a man (%)
Sexual Behavior - Females 18+ that ever performed oral sex on a man (%)
Sexual Behavior - Females 18+ that ever had anal sex with a man (%)
Sexual Behavior - Females 18+ that ever had any kind of sex with a woman (%)
Sexual Behavior - Average age people first had sex
Sexual Behavior - Average number of female sex partners in lifetime (males 18+)
Sexual Behavior - Average number of female vaginal sex partners in lifetime (males 18+)
Sexual Behavior - Average age people first performed oral sex on a woman (18+)
Sexual Behavior - Average number of woman performed oral sex on in lifetime (18+)
Sexual Behavior - Average number of male sex partners in lifetime (males 18+)
Sexual Behavior - Average number of male anal sex partners in lifetime (males 18+)
Sexual Behavior - Average age people first performed oral sex on a man (18+)
Sexual Behavior - Average number of male oral sex partners in lifetime (18+)
Sexual Behavior - People using protection when performing oral sex (%)
Sexual Behavior - Average number of times people have vaginal or anal sex a year
Sexual Behavior - People having sex without condom (%)
Sexual Behavior - Average number of male sex partners in lifetime (females 18+)
Sexual Behavior - Average number of male vaginal sex partners in lifetime (females 18+)
Sexual Behavior - Average number of female sex partners in lifetime (females 18+)
Sexual Behavior - Circumcised males 18+ (%)
Sleep Disorders - Average hours sleeping at night
Sleep Disorders - People that has trouble sleeping (%)
Smoking-Cigarette Use - People smoking cigarettes (%)
Taste & Smell - People 40+ having problems with smell (%)
Taste & Smell - People 40+ having problems with taste (%)
Taste & Smell - People 40+ that ever had wisdom teeth removed (%)
Taste & Smell - People 40+ that ever had tonsils teeth removed (%)
Taste & Smell - People 40+ that ever had a loss of consciousness because of a head injury (%)
Taste & Smell - People 40+ that ever had a broken nose or other serious injury to face or skull (%)
Taste & Smell - People 40+ that ever had two or more sinus infections (%)
Weight - Average height (inches)
Weight - Average weight (pounds)
Weight - Average BMI
Weight - People that are obese (%)
Weight - People that ever were obese (%)
Weight - People trying to lose weight (%)
Officers per 1,000 residents here:
18.24Florida average:
2.33
Latest news from Golden Beach, FL collected exclusively by city-data.com from local newspapers, TV, and radio stations
Ancestries: European (13.0%), Romanian (5.7%), Italian (5.1%), Eastern European (4.3%), Russian (4.3%), Moroccan (3.5%).
Current Local Time:
Land area: 0.34 square miles.
Population density: 2,798 people per square mile (average).
263 residents are foreign born (34.3% Latin America , 5.1% Africa ).
This town:
48.3%Florida:
21.1%
Median real estate property taxes paid for housing units with mortgages in 2022: $11,129 (0.5%)Median real estate property taxes paid for housing units with no mortgage in 2022: $10,966 (0.5%)
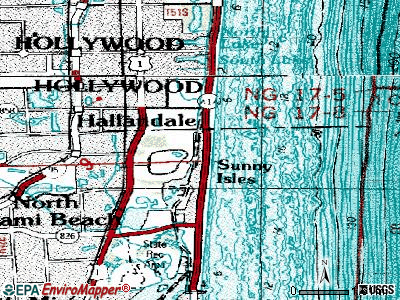
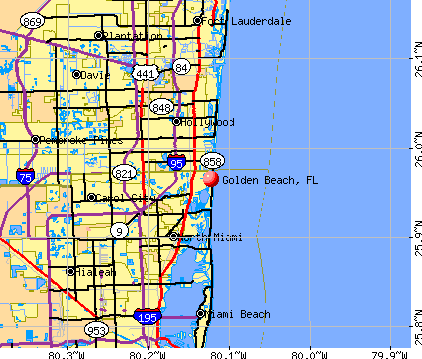
Nearest city with pop. 50,000+: Hollywood, FL
Nearest city with pop. 200,000+: Hialeah, FL
Nearest city with pop. 1,000,000+: Houston, TX
Nearest cities:
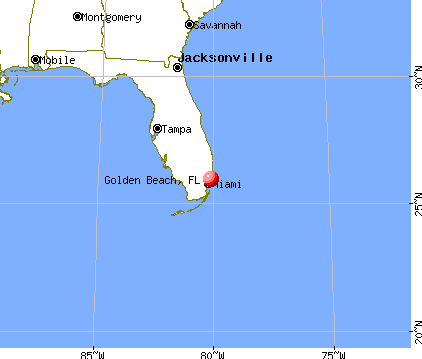
Latitude: 25.96 N, Longitude: 80.12 W
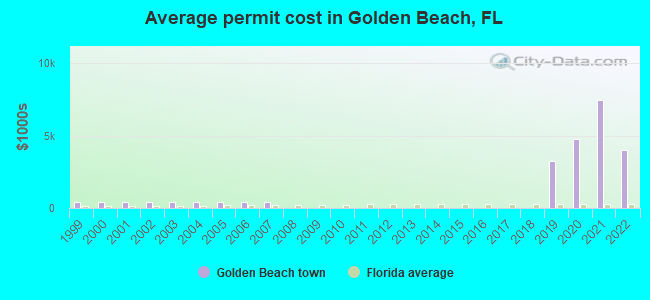
Property values in Golden Beach, FL
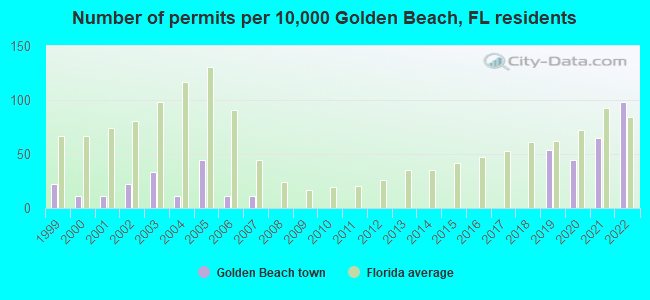
Single-family new house construction building permits:
2022: 9 buildings , average cost: $4,035,8002021: 6 buildings , average cost: $7,462,2002020: 4 buildings , average cost: $4,780,2002019: 5 buildings , average cost: $3,263,7002007: 1 building , cost: $382,6002006: 1 building , cost: $382,6002005: 4 buildings , average cost: $382,6002004: 1 building , cost: $382,6002003: 3 buildings , average cost: $382,6002002: 2 buildings , average cost: $382,6002001: 1 building , cost: $382,6002000: 1 building , cost: $382,6001999: 2 buildings , average cost: $382,600Unemployment in December 2023: Population change in the 1990s: +143 (+18.4%).
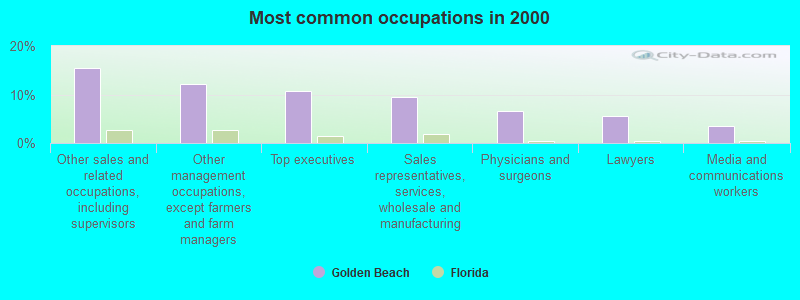
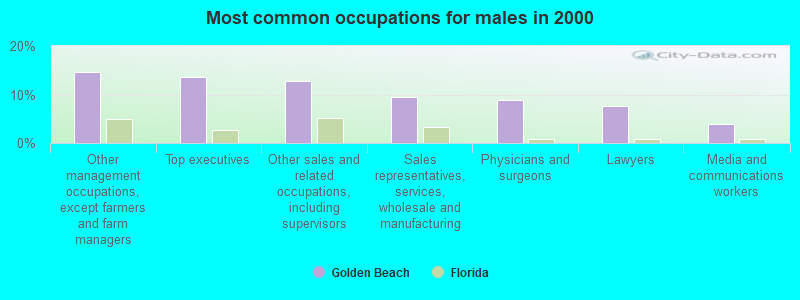
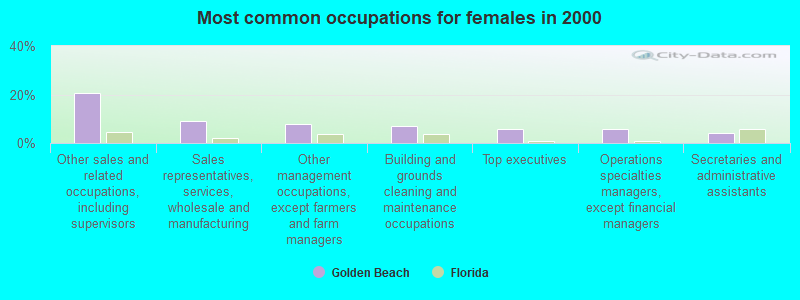
Most common occupations in Golden Beach, FL (%)
Both Males Females
Other sales and related occupations, including supervisors (15.5%)
Other management occupations, except farmers and farm managers (12.2%)
Top executives (10.7%)
Sales representatives, services, wholesale and manufacturing (9.4%)
Physicians and surgeons (6.6%)
Lawyers (5.6%)
Media and communications workers (3.6%)
Other management occupations, except farmers and farm managers (14.7%)
Top executives (13.5%)
Other sales and related occupations, including supervisors (12.7%)
Sales representatives, services, wholesale and manufacturing (9.6%)
Physicians and surgeons (8.8%)
Lawyers (7.6%)
Media and communications workers (4.0%)
Other sales and related occupations, including supervisors (20.4%)
Sales representatives, services, wholesale and manufacturing (9.2%)
Other management occupations, except farmers and farm managers (7.7%)
Building and grounds cleaning and maintenance occupations (7.0%)
Top executives (5.6%)
Operations specialties managers, except financial managers (5.6%)
Secretaries and administrative assistants (4.2%)
Tornado activity:
Golden Beach-area historical tornado activity is below Florida state average. It is 32% smaller than the overall U.S. average.
On 6/17/1959, a category F3 (max. wind speeds 158-206 mph) tornado 6.6 miles away from the Golden Beach town center injured 77 people and caused between $500,000 and $5,000,000 in damages.
On 4/10/1956, a category F3 tornado 7.1 miles away from the town center injured 20 people and caused between $500,000 and $5,000,000 in damages.
Earthquake activity:
Golden Beach-area historical earthquake activity is significantly below Florida state average. It is 99% smaller than the overall U.S. average. On 9/10/2006 at 14:56:08, a magnitude 5.9 (5.9 MB, 5.5 MS, 5.8 MW, Class: Moderate, Intensity: VI - VII) earthquake occurred 404.6 miles away from the city center On 2/22/1992 at 04:21:34, a magnitude 3.2 (3.2 MB, Depth: 6.2 mi, Class: Light, Intensity: II - III) earthquake occurred 81.3 miles away from Golden Beach center On 6/23/2016 at 17:20:29, a magnitude 3.8 (3.8 ML) earthquake occurred 281.8 miles away from the city center On 7/16/2016 at 20:00:10, a magnitude 3.7 (3.7 MB) earthquake occurred 266.2 miles away from the city center On 9/21/2016 at 16:30:52, a magnitude 3.8 (3.8 ML) earthquake occurred 286.7 miles away from the city center On 9/4/2016 at 18:29:29, a magnitude 3.8 (3.8 ML) earthquake occurred 287.9 miles away from the city center Magnitude types: body-wave magnitude (MB), local magnitude (ML), surface-wave magnitude (MS), moment magnitude (MW) Natural disasters: The number of natural disasters in Miami-Dade County (10) is smaller than the US average (15).Major Disasters (Presidential) Declared: 5Emergencies Declared: 3Hurricanes: 7, Tropical Storms: 2, Tornado: 1, Other: 1 (Note: some incidents may be assigned to more than one category). Hospitals and medical centers near Golden Beach: VI AT AVENTURA (Nursing Home, about 2 miles away; AVENTURA, FL)
AVENTURA HOSPITAL AND MEDICAL CENTER (about 2 miles away; AVENTURA, FL)
HALLANDALE REHABILITATION CTR (Nursing Home, about 2 miles away; HALLANDALE, FL)
CONFIDENT CARE OF FLORIDA CORP (Home Health Center, about 2 miles away; SUNNY ISLES, FL)
WORLD FIRST CLASS HOME HEALTH INC (Home Health Center, about 2 miles away; AVENTURA, FL)
PALM GARDEN OF AVENTURA (Nursing Home, about 2 miles away; NORTH MIAMI BEACH, FL)
AVENTURA DIALYSIS CENTER (Dialysis Facility, about 2 miles away; AVENTURA, FL)
Amtrak stations near Golden Beach: 5 miles: HOLLYWOOD (3001 HOLLYWOOD BLVD.) Services: ticket office, partially wheelchair accessible, enclosed waiting area, public restrooms, public payphones, vending machines, free short-term parking, free long-term parking, taxi stand, public transit connection.
12 miles: FORT LAUDERDALE (200 SW 21ST TERRACE) Services: ticket office, partially wheelchair accessible, enclosed waiting area, public restrooms, public payphones, vending machines, free short-term parking, free long-term parking, call for car rental service, call for taxi service, public transit connection.
12 miles: MIAMI (8303 N.W. 37TH AVE.) Services: ticket office, fully wheelchair accessible, enclosed waiting area, public restrooms, public payphones, vending machines, free short-term parking, call for car rental service, taxi stand, public transit connection.
Colleges/universities with over 2000 students nearest to Golden Beach:
Johnson & Wales University-North Miami (about 6 miles; North Miami, FL ; Full-time enrollment: 2,051)
Barry University (about 8 miles; Miami, FL ; FT enrollment: 7,181)
St Thomas University (about 9 miles; Miami Gardens, FL ; FT enrollment: 2,096)
Broward College (about 11 miles; Fort Lauderdale, FL ; FT enrollment: 30,322)
Nova Southeastern University (about 11 miles; Fort Lauderdale, FL ; FT enrollment: 25,621)
AI Miami International University of Art and Design (about 13 miles; Miami, FL ; FT enrollment: 3,578)
DeVry University-Florida (about 14 miles; Miramar, FL ; FT enrollment: 3,674)
User-submitted facts and corrections:
WFOR-TV (Ch.4) is missing from the list of TV stations in the vicinity, as are the -DT flavours of the other stations as well... added by Brandy
Miami-Dade County has a predicted average indoor radon screening level between 2 and 4 pCi/L (pico curies per liter) - Moderate Potential Average household size: This town:
3.2 peopleFlorida:
2.5 people
Percentage of family households: This town:
82.2%Whole state:
65.2%
Percentage of households with unmarried partners: This town:
3.5%Whole state:
7.3%
No gay or lesbian households reported
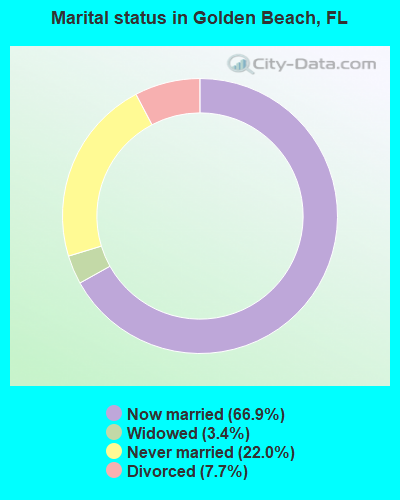
For population 15 years and over in Golden Beach:
Never married: 22.0%Now married: 66.9%Separated: 0.0%Widowed: 3.4%Divorced: 7.7% For population 25 years and over in Golden Beach:
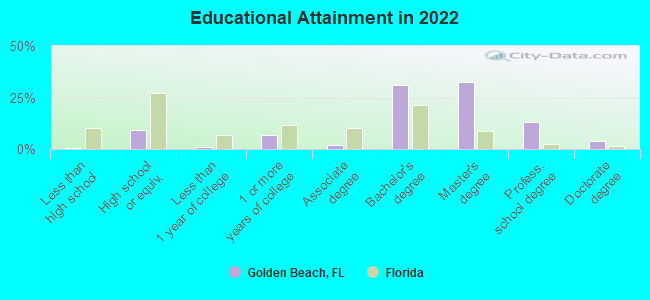
High school or higher: 99.2%Bachelor's degree or higher: 77.2%Graduate or professional degree: 46.7%Unemployed: 1.3%Mean travel time to work (commute): 19.5 minutes
Education Gini index (Inequality in education) Here:
8.4Florida average:
12.2
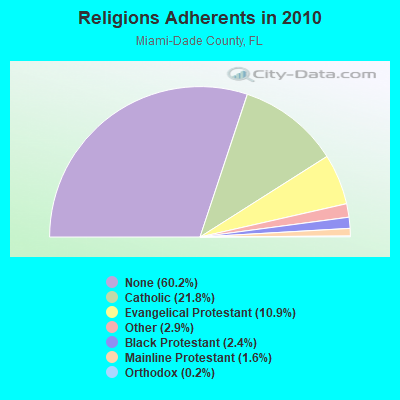
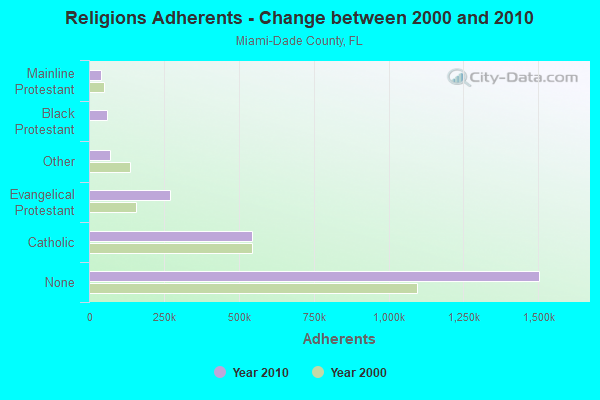
Religion statistics for Golden Beach, FL (based on Miami-Dade County data)
Religion Adherents Congregations Catholic 544,449 65 Evangelical Protestant 271,814 922 Other 71,458 200 Black Protestant 60,074 94 Mainline Protestant 40,287 146 Orthodox 4,440 10 None 1,503,913 -
Source: Clifford Grammich, Kirk Hadaway, Richard Houseal, Dale E.Jones, Alexei Krindatch, Richie Stanley and Richard H.Taylor. 2012. 2010 U.S.Religion Census: Religious Congregations & Membership Study. Association of Statisticians of American Religious Bodies. Jones, Dale E., et al. 2002. Congregations and Membership in the United States 2000. Nashville, TN: Glenmary Research Center. Graphs represent county-level data
Food Environment Statistics: Number of grocery stores : 597Miami-Dade County :
2.51 / 10,000 pop.State :
2.04 / 10,000 pop.
Number of supercenters and club stores : 15This county :
0.06 / 10,000 pop.Florida :
0.11 / 10,000 pop.
Number of convenience stores (no gas) : 285Miami-Dade County :
1.20 / 10,000 pop.Florida :
1.28 / 10,000 pop.
Number of convenience stores (with gas) : 473This county :
1.98 / 10,000 pop.Florida :
3.04 / 10,000 pop.
Number of full-service restaurants : 1,610Miami-Dade County :
6.76 / 10,000 pop.State :
7.45 / 10,000 pop.
Adult diabetes rate : Miami-Dade County :
7.9%Florida :
9.2%
Adult obesity rate : This county :
20.5%Florida :
23.7%
Low-income preschool obesity rate : Miami-Dade County :
15.8%State :
14.0%
Health and Nutrition:
Average overall health of teeth and gums : Golden Beach:
59.1%Florida:
49.4%
Average BMI : Golden Beach:
27.7State:
28.6
People feeling badly about themselves : Golden Beach:
17.1%Florida:
19.5%
People not drinking alcohol at all : Golden Beach:
7.9%Florida:
10.7%
Average hours sleeping at night : Golden Beach:
7.0Florida:
6.9
Overweight people : Golden Beach:
35.7%State:
34.7%
General health condition : Golden Beach:
62.8%Florida:
57.0%
Average condition of hearing : Golden Beach:
81.5%State:
79.2%
More about Health and Nutrition of Golden Beach, FL Residents
Local government employment and payroll (March 2022)
Function
Full-time employees
Monthly full-time payroll
Average yearly full-time wage
Part-time employees
Monthly part-time payroll
Police Protection - Officers
22 $141,688 $77,284 0 $0 Sewerage
10 $46,177 $55,412 0 $0 Other Government Administration
8 $42,073 $63,110 0 $0 Streets and Highways
4 $19,285 $57,855 0 $0 Solid Waste Management
3 $14,232 $56,928 0 $0 Parks and Recreation
2 $13,061 $78,366 1 $1,829 Financial Administration
2 $13,414 $80,484 0 $0 Police - Other
1 $4,726 $56,712 0 $0 Other and Unallocable
1 $4,813 $57,756 1 $2,327
Totals for Government
53 $299,469 $67,804 2 $4,156
Golden Beach government finances - Expenditure in 2017 (per resident):
Construction - Regular Highways: $136,000 ($142.41)
Current Operations - Police Protection: $2,548,000 ($2668.06)
Natural Resources - Other: $1,617,000 ($1693.19)Central Staff Services: $1,543,000 ($1615.71)Parks and Recreation: $722,000 ($756.02)Protective Inspection and Regulation - Other: $476,000 ($498.43)Regular Highways: $416,000 ($435.60)Financial Administration: $270,000 ($282.72)Judicial and Legal Services: $79,000 ($82.72)General - Other: $31,000 ($32.46)General - Interest on Debt: $608,000 ($636.65)
Other Capital Outlay - Natural Resources - Other: $306,000 ($320.42)
Parks and Recreation: $194,000 ($203.14)General - Other: $85,000 ($89.01)Central Staff Services: $17,000 ($17.80)Police Protection: $10,000 ($10.47)Financial Administration: $2,000 ($2.09)
Golden Beach government finances - Revenue in 2017 (per resident):
Charges - Sewerage: $282,000 ($295.29)
Parks and Recreation: $6,000 ($6.28)Miscellaneous - Fines and Forfeits: $425,000 ($445.03)
General Revenue - Other: $252,000 ($263.87)Interest Earnings: $3,000 ($3.14)State Intergovernmental - General Local Government Support: $101,000 ($105.76)
Tax - Property: $6,764,000 ($7082.72)
Other License: $1,435,000 ($1502.62)Occupation and Business License - Other: $263,000 ($275.39)General Sales and Gross Receipts: $37,000 ($38.74)Other Selective Sales: $26,000 ($27.23)Motor Fuels Sales: $18,000 ($18.85)Public Utilities Sales: $7,000 ($7.33)
Golden Beach government finances - Debt in 2017 (per resident):
Long Term Debt - Beginning Outstanding - Unspecified Public Purpose: $14,369,000 ($15046.07)
Outstanding Unspecified Public Purpose: $13,444,000 ($14077.49)Retired Unspecified Public Purpose: $1,207,000 ($1263.87)Issue, Unspecified Public Purpose: $282,000 ($295.29)
Golden Beach government finances - Cash and Securities in 2017 (per resident):
Other Funds - Cash and Securities: $2,427,000 ($2541.36)
4.04% of this county's 2021 resident taxpayers lived in other counties in 2020 ($229,296 average adjusted gross income )
Here:
4.04%Florida average:
8.80%
0.03% of residents moved from foreign countries ($357 average AGI )Miami-Dade County:
0.03%Florida average:
0.05%
Top counties from which taxpayers relocated into this county between 2020 and 2021:
5.24% of this county's 2020 resident taxpayers moved to other counties in 2021 ($66,399 average adjusted gross income )
Here:
5.24%Florida average:
7.45%
0.03% of residents moved to foreign countries ($505 average AGI )Miami-Dade County:
0.03%Florida average:
0.04%
Top counties to which taxpayers relocated from this county between 2020 and 2021: Strongest AM radio stations in Golden Beach:
WRFX (940 AM; 50 kW; MIAMI, FL; Owner: CLEAR CHANNEL BROADCASTING LICENSES, INC.)
WAQI (710 AM; 50 kW; MIAMI, FL; Owner: LICENSE CORPORATION #1)
WNMA (1210 AM; 49 kW; MIAMI SPRINGS, FL; Owner: RADIO UNICA OF MIAMI LICENSE CORP.)
WWNN (1470 AM; 50 kW; POMPANO BEACH, FL; Owner: WWNN LICENSE, LLC)
WWFE (670 AM; 50 kW; MIAMI, FL; Owner: FENIX BROADCASTING CORP.)
WIOD (610 AM; 5 kW; MIAMI, FL; Owner: CLEAR CHANNEL BROADCASTING LICENSES, INC.)
WSUA (1260 AM; 50 kW; MIAMI, FL; Owner: WSUA BROADCASTING CORPORATION)
WQBA (1140 AM; 50 kW; MIAMI, FL; Owner: WQBA-AM LICENSE CORP.)
WSRF (1580 AM; 10 kW; FORT LAUDERDALE, FL; Owner: URBAN RADIO OF FLORIDA, LLC)
WRHC (1550 AM; 45 kW; CORAL GABLES, FL; Owner: WRHC BROADCASTING CORP.)
WVCG (1080 AM; 50 kW; CORAL GABLES, FL; Owner: RADIO ONE LICENSES, LLC)
WAVS (1170 AM; 5 kW; DAVIE, FL; Owner: RADIO WAVS, INC.)
WQAM (560 AM; 5 kW; MIAMI, FL; Owner: WQAM LICENSE LIMITED PARTNERSHIP)
Strongest FM radio stations in Golden Beach:
WBGG-FM (105.9 FM; FORT LAUDERDALE, FL; Owner: CLEAR CHANNEL BROADCASTING LICENSES, INC.)
WHYI-FM (100.7 FM; FORT LAUDERDALE, FL; Owner: CLEAR CHANNEL BROADCASTING LICENSES, INC.)
WKIS (99.9 FM; BOCA RATON, FL; Owner: WKIS LICENSE LIMITED PARTNERSHIP)
WRMA (106.7 FM; FORT LAUDERDALE, FL; Owner: WRMA LICENSING, INC.)
WLRN-FM (91.3 FM; MIAMI, FL; Owner: THE SCHOOL BOARD OF MIAMI - DADE COUNTY, FL)
WHQT (105.1 FM; CORAL GABLES, FL; Owner: COX RADIO, INC.)
WLVE (93.9 FM; MIAMI BEACH, FL; Owner: CLEAR CHANNEL BROADCASTING LICENSES, INC.)
WMIB (103.5 FM; FORT LAUDERDALE, FL; Owner: CLEAR CHANNEL BROADCASTING LICENSES, INC.)
WMXJ (102.7 FM; POMPANO BEACH, FL; Owner: JEFFERSON-PILOT COMMUNICATIONS CO. OF FLORIDA)
WPOW (96.5 FM; MIAMI, FL; Owner: WPOW LICENSE LIMITED PARTNERSHIP)
WZTA (94.9 FM; MIAMI BEACH, FL; Owner: CLEAR CHANNEL BROADCASTING LICENSES, INC.)
WFLC (97.3 FM; MIAMI, FL; Owner: COX RADIO, INC.)
WPYM (93.1 FM; MIAMI, FL; Owner: COX RADIO-MIAMI, LLC)
WLYF (101.5 FM; MIAMI, FL; Owner: JEFFERSON-PILOT COMMUNICATIONS CO. OF FLORIDA)
WXDJ (95.7 FM; NORTH MIAMI BEACH, FL; Owner: WXDJ LICENSING, INC.)
WAMR-FM (107.5 FM; MIAMI, FL; Owner: WQBA-FM LICENSE CORP.)
WEDR (99.1 FM; MIAMI, FL; Owner: COX RADIO, INC.)
WCMQ-FM (92.3 FM; HIALEAH, FL; Owner: WCMQ LICENSING, INC.)
WDNA (88.9 FM; MIAMI, FL; Owner: BASCOMB MEMORIAL BROADCASTING FOUNDATION)
WRTO (98.3 FM; GOULDS, FL; Owner: LICENSE CORPORATION #2)
TV broadcast stations around Golden Beach:
W58BU (Channel 58; HALLANDALE, FL; Owner: NBC STATIONS MANAGEMENT,INC.)
WPPB-TV (Channel 63; BOCA RATON, FL; Owner: THE SCHOOL BOARD OF BROWARD COUNTY, FLORIDA)
WHFT-TV (Channel 45; MIAMI, FL; Owner: TRINITY BROADCASTING OF FLORIDA, INC.)
W24CA (Channel 24; MARATHON, FL; Owner: KEY COMMUNICATIONS OF TEXAS)
WPBT (Channel 2; MIAMI, FL; Owner: COMMUNITY TV FOUNDATION OF S. FLORIDA, INC.)
WAMI-TV (Channel 69; HOLLYWOOD, FL; Owner: TELEFUTURA MIAMI LLC)
WLRN-TV (Channel 17; MIAMI, FL; Owner: THE SCHOOL BOARD OF MIAMI - DADE COUNTY, FL)
WSCV (Channel 51; FORT LAUDERDALE, FL; Owner: TELEMUNDO OF FLORIDA LICENSE CORP.)
WSVN (Channel 7; MIAMI, FL; Owner: SUNBEAM TELEVISION CORP.)
WPLG (Channel 10; MIAMI, FL; Owner: POST-NEWSWEEK STATIONS, FLORIDA, INC.)
WBFS-TV (Channel 33; MIAMI, FL; Owner: VIACOM STATIONS GROUP OF MIAMI INC.)
WPXM (Channel 35; MIAMI, FL; Owner: PAXSON COMMUNICATIONS LICENSE COMPANY, LLC)
WLMF-LP (Channel 53; MIAMI, FL; Owner: PAGING SYSTEMS, INC.)
WLTV (Channel 23; MIAMI, FL; Owner: WLTV LICENSE PARTNERSHIP, G.P.)
WBZL (Channel 39; MIAMI, FL; Owner: CHANNEL 39, INC.)
WFUN-CA (Channel 48; MIAMI, ETC., FL; Owner: LOCALONE TEXAS, LTD.)
WTVJ (Channel 6; MIAMI, FL; Owner: NBC STATIONS MANAGEMENT, INC.)
WHDT-LP (Channel 44; MIAMI, FL; Owner: GUENTER MARKSTEINER)
WGEN-LP (Channel 55; MIAMI, FL; Owner: WDLP BROADCASTING COMPANY, LLC)
WIMP-CA (Channel 25; MIAMI, FL; Owner: SUNSHINE BROADCASTING COMPANY, INC.)
WPTV (Channel 5; WEST PALM BEACH, FL; Owner: SCRIPPS HOWARD BROADCASTING COMPANY)
WFLX (Channel 29; WEST PALM BEACH, FL; Owner: RAYCOM NATIONAL, INC.)
WXEL-TV (Channel 42; WEST PALM BEACH, FL; Owner: BARRY TELECOMMUNICATIONS, INC.)
WJAN-CA (Channel 41; MIAMI, FL; Owner: SHERJAN BROADCASTING COMPANY, INC.)
WVEB-CA (Channel 21; MIAMI, ETC., FL; Owner: HISPANIC KEYS BROADCASTING CORPORATION)
National Bridge Inventory (NBI) Statistics 3 Number of bridges30ft / 8.9m Total length690 Total average daily traffic6 Total average daily truck traffic1,062 Total future (year 2037) average daily traffic
FCC Registered Amateur Radio Licenses: 2
Call Sign: WA2HKN, Licensee ID: L00258924, Grant Date: 12/18/2017, Expiration Date: 02/02/2028, Certifier: Alfred A Herrick, Registrant: Alfred A Herrick, 625 Ocean Blvd, Golden Beach, FL 33160-2217Call Sign: WB2HYX, Licensee ID: L00258927, Grant Date: 12/18/2017, Expiration Date: 02/02/2028, Certifier: Sydell Herrick, Registrant: Sydell Herrick, 625 Ocean Blvd, Golden Beach, FL 33160FAA Registered Aircraft: 1
Aircraft: PIPER PA-28-181 (Category: Land, Seats: 4, Weight: Up to 12,499 Pounds, Speed: 105 mph), Engine: LYCOMING 0-360-A1D (180 HP) (Reciprocating)N-Number: 8055V, N8055V, N-8055V, Serial Number: 288290078, Year manufactured: 1981, Airworthiness Date: 07/10/1997, Certificate Issue Date: 08/29/2017Registrant (Individual): Sergey Sandler, 550 Ocean Blvd, Golden Beach, FL 33160
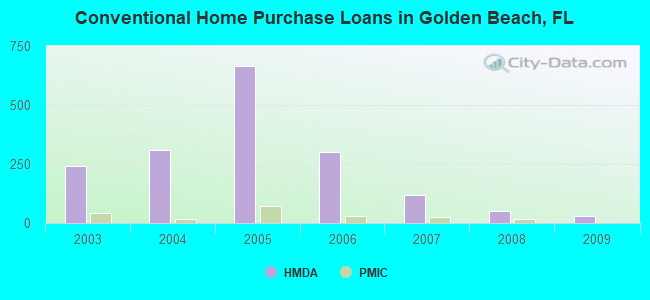
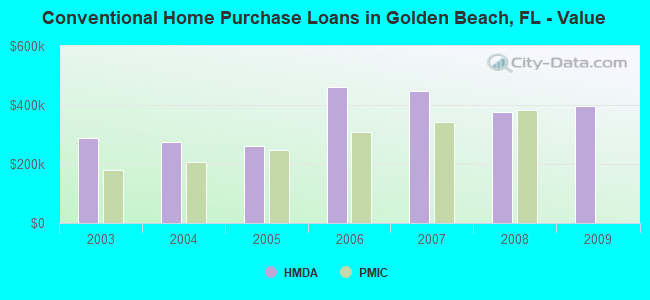
Home Mortgage Disclosure Act Aggregated Statistics For Year 2009(Based on 1 partial tract) A) FHA, FSA/RHS & VA B) Conventional C) Refinancings D) Home Improvement Loans F) Non-occupant Loans on Number Average Value Number Average Value Number Average Value Number Average Value Number Average Value
LOANS ORIGINATED 0 $0 31 $396,752 19 $346,739 0 $0 29 $327,755 APPLICATIONS APPROVED, NOT ACCEPTED 0 $0 6 $293,493 3 $786,110 0 $0 6 $569,203 APPLICATIONS DENIED 1 $178,260 22 $397,612 33 $355,436 1 $144,950 29 $332,232 APPLICATIONS WITHDRAWN 0 $0 10 $338,438 12 $356,613 0 $0 11 $370,192 FILES CLOSED FOR INCOMPLETENESS 0 $0 4 $350,882 2 $307,785 0 $0 3 $363,500
Aggregated Statistics For Year 2008(Based on 1 partial tract) A) FHA, FSA/RHS & VA B) Conventional C) Refinancings D) Home Improvement Loans F) Non-occupant Loans on Number Average Value Number Average Value Number Average Value Number Average Value Number Average Value
LOANS ORIGINATED 0 $0 52 $374,718 31 $398,085 2 $67,540 44 $422,971 APPLICATIONS APPROVED, NOT ACCEPTED 0 $0 16 $372,875 12 $323,126 1 $84,810 10 $353,889 APPLICATIONS DENIED 1 $212,180 53 $413,925 46 $380,901 6 $239,832 45 $405,430 APPLICATIONS WITHDRAWN 0 $0 16 $397,759 16 $360,674 1 $120,280 15 $359,697 FILES CLOSED FOR INCOMPLETENESS 0 $0 7 $391,580 7 $403,520 0 $0 6 $411,252
Aggregated Statistics For Year 2007(Based on 1 partial tract) B) Conventional C) Refinancings D) Home Improvement Loans F) Non-occupant Loans on G) Loans On Manufactured Number Average Value Number Average Value Number Average Value Number Average Value Number Average Value
LOANS ORIGINATED 120 $449,038 101 $414,780 10 $283,265 91 $461,482 0 $0 APPLICATIONS APPROVED, NOT ACCEPTED 35 $373,913 34 $519,917 3 $366,173 30 $445,114 0 $0 APPLICATIONS DENIED 127 $399,363 108 $469,562 12 $253,273 88 $395,400 1 $256,590 APPLICATIONS WITHDRAWN 29 $489,229 30 $449,760 4 $304,930 19 $406,958 0 $0 FILES CLOSED FOR INCOMPLETENESS 13 $404,099 14 $535,382 1 $184,730 9 $416,169 0 $0
Aggregated Statistics For Year 2006(Based on 1 partial tract) B) Conventional C) Refinancings D) Home Improvement Loans E) Loans on Dwellings For 5+ Families F) Non-occupant Loans on Number Average Value Number Average Value Number Average Value Number Average Value Number Average Value
LOANS ORIGINATED 300 $462,043 139 $427,130 14 $447,532 1 $30,901,370 208 $484,857 APPLICATIONS APPROVED, NOT ACCEPTED 56 $453,425 36 $347,498 3 $149,780 0 $0 35 $457,066 APPLICATIONS DENIED 164 $463,320 103 $457,740 9 $202,584 0 $0 102 $440,317 APPLICATIONS WITHDRAWN 61 $487,919 56 $414,258 3 $326,287 0 $0 45 $426,394 FILES CLOSED FOR INCOMPLETENESS 17 $461,838 21 $368,435 1 $243,640 0 $0 16 $371,564
Aggregated Statistics For Year 2005(Based on 1 partial tract) B) Conventional C) Refinancings D) Home Improvement Loans F) Non-occupant Loans on G) Loans On Manufactured Number Average Value Number Average Value Number Average Value Number Average Value Number Average Value
LOANS ORIGINATED 666 $260,448 120 $341,558 7 $266,149 390 $269,519 2 $56,590 APPLICATIONS APPROVED, NOT ACCEPTED 73 $272,338 20 $316,742 2 $175,790 44 $277,896 0 $0 APPLICATIONS DENIED 194 $307,554 66 $381,467 10 $295,170 112 $325,764 0 $0 APPLICATIONS WITHDRAWN 104 $294,427 32 $453,406 2 $229,605 55 $285,349 0 $0 FILES CLOSED FOR INCOMPLETENESS 20 $344,745 20 $278,022 1 $1,826,340 13 $348,231 0 $0
Aggregated Statistics For Year 2004(Based on 1 partial tract) B) Conventional C) Refinancings D) Home Improvement Loans E) Loans on Dwellings For 5+ Families F) Non-occupant Loans on G) Loans On Manufactured Number Average Value Number Average Value Number Average Value Number Average Value Number Average Value Number Average Value
LOANS ORIGINATED 309 $274,497 122 $278,460 8 $173,282 1 $4,684,600 218 $252,747 0 $0 APPLICATIONS APPROVED, NOT ACCEPTED 45 $259,508 30 $225,338 2 $269,235 0 $0 31 $221,183 1 $13,260 APPLICATIONS DENIED 84 $304,673 56 $243,509 14 $169,796 0 $0 60 $224,906 0 $0 APPLICATIONS WITHDRAWN 37 $307,383 31 $213,582 2 $299,610 0 $0 19 $250,031 0 $0 FILES CLOSED FOR INCOMPLETENESS 11 $371,594 16 $270,178 1 $80,180 0 $0 7 $339,813 0 $0
Aggregated Statistics For Year 2003(Based on 1 partial tract) B) Conventional C) Refinancings D) Home Improvement Loans F) Non-occupant Loans on Number Average Value Number Average Value Number Average Value Number Average Value
LOANS ORIGINATED 241 $289,763 178 $263,043 6 $88,820 187 $249,563 APPLICATIONS APPROVED, NOT ACCEPTED 33 $300,288 29 $220,272 1 $104,240 25 $221,283 APPLICATIONS DENIED 55 $232,724 66 $263,103 6 $124,233 46 $231,857 APPLICATIONS WITHDRAWN 39 $323,828 32 $227,291 1 $5,860 28 $284,146 FILES CLOSED FOR INCOMPLETENESS 10 $234,477 11 $357,632 0 $0 4 $233,228
Detailed HMDA statistics for the following Tracts:
0001.15
Private Mortgage Insurance Companies Aggregated Statistics For Year 2008(Based on 1 partial tract) A) Conventional B) Refinancings C) Non-occupant Loans on Number Average Value Number Average Value Number Average Value
LOANS ORIGINATED 16 $383,091 2 $244,405 1 $177,950 APPLICATIONS APPROVED, NOT ACCEPTED 27 $378,852 3 $263,887 4 $266,920 APPLICATIONS DENIED 5 $306,796 1 $171,160 2 $165,610 APPLICATIONS WITHDRAWN 5 $373,904 1 $395,370 1 $266,770 FILES CLOSED FOR INCOMPLETENESS 2 $333,380 0 $0 0 $0
Aggregated Statistics For Year 2007(Based on 1 partial tract) A) Conventional B) Refinancings C) Non-occupant Loans on Number Average Value Number Average Value Number Average Value
LOANS ORIGINATED 27 $343,615 7 $361,666 6 $313,540 APPLICATIONS APPROVED, NOT ACCEPTED 4 $361,522 4 $372,392 3 $330,707 APPLICATIONS DENIED 2 $344,020 1 $421,270 1 $189,360 APPLICATIONS WITHDRAWN 2 $374,705 1 $477,710 2 $299,455 FILES CLOSED FOR INCOMPLETENESS 0 $0 0 $0 0 $0
Aggregated Statistics For Year 2006(Based on 1 partial tract) A) Conventional B) Refinancings C) Non-occupant Loans on Number Average Value Number Average Value Number Average Value
LOANS ORIGINATED 31 $307,266 3 $257,513 14 $304,611 APPLICATIONS APPROVED, NOT ACCEPTED 10 $328,847 1 $315,180 4 $340,935 APPLICATIONS DENIED 1 $225,440 2 $419,885 2 $399,995 APPLICATIONS WITHDRAWN 2 $294,060 2 $245,330 2 $273,550 FILES CLOSED FOR INCOMPLETENESS 0 $0 0 $0 0 $0
Aggregated Statistics For Year 2005(Based on 1 partial tract) A) Conventional B) Refinancings C) Non-occupant Loans on Number Average Value Number Average Value Number Average Value
LOANS ORIGINATED 70 $248,998 2 $199,225 28 $249,815 APPLICATIONS APPROVED, NOT ACCEPTED 14 $233,151 1 $120,890 6 $197,478 APPLICATIONS DENIED 3 $194,393 1 $783,340 2 $189,975 APPLICATIONS WITHDRAWN 4 $252,425 0 $0 2 $273,395 FILES CLOSED FOR INCOMPLETENESS 0 $0 0 $0 0 $0
Aggregated Statistics For Year 2004(Based on 1 partial tract) A) Conventional B) Refinancings C) Non-occupant Loans on Number Average Value Number Average Value Number Average Value
LOANS ORIGINATED 19 $206,953 1 $259,980 7 $211,783 APPLICATIONS APPROVED, NOT ACCEPTED 5 $187,692 1 $148,650 2 $197,375 APPLICATIONS DENIED 2 $223,590 0 $0 1 $255,360 APPLICATIONS WITHDRAWN 2 $239,475 1 $161,910 1 $297,610 FILES CLOSED FOR INCOMPLETENESS 1 $151,420 0 $0 0 $0
Aggregated Statistics For Year 2003(Based on 1 partial tract) A) Conventional B) Refinancings C) Non-occupant Loans on Number Average Value Number Average Value Number Average Value
LOANS ORIGINATED 43 $179,367 6 $138,575 14 $192,530 APPLICATIONS APPROVED, NOT ACCEPTED 9 $172,636 1 $229,140 3 $196,247 APPLICATIONS DENIED 4 $211,870 1 $183,190 2 $260,135 APPLICATIONS WITHDRAWN 6 $143,765 1 $191,210 2 $152,810 FILES CLOSED FOR INCOMPLETENESS 1 $199,840 0 $0 0 $0
Detailed PMIC statistics for the following Tracts:
0001.15
Golden Beach compared to Florida state average:
Median household income significantly above state average. Median house value significantly above state average. Unemployed percentage significantly below state average. Black race population percentage significantly below state average. Renting percentage significantly below state average. Length of stay since moving in above state average. Number of rooms per house significantly above state average. Percentage of population with a bachelor's degree or higher significantly above state average. Golden Beach on our top lists :
#11 on the list of "Top 101 cities with the most residents born in Hungary (population 500+)"
#18 on the list of "Top 101 cities with the most residents born in Argentina (population 500+)"
#19 on the list of "Top 101 cities with the most residents born in Southern Africa (population 500+)"
#20 on the list of "Top 101 cities with the most residents born in South Africa (population 500+)"
#26 on the list of "Top 101 cities with the most residents born in Italy (population 500+)"
#29 on the list of "Top 101 cities with the most people having professional degrees (population 500+)"
#47 on the list of "Top 101 cities with the most residents born in Colombia (population 500+)"
#57 on the list of "Top 101 cities with the most residents born in South America (population 500+)"
#60 on the list of "Top 101 cities with the most residents born in Venezuela (population 500+)"
#80 (33160) on the list of "Top 101 zip codes with the largest percentage of Russian first ancestries"
#2 on the list of "Top 101 counties with the highest ground withdrawal of fresh water for public supply"
#8 on the list of "Top 101 counties with the most Evangelical Protestant congregations"
#9 on the list of "Top 101 counties with the most Black Protestant adherents"
#11 on the list of "Top 101 counties with the highest total withdrawal of fresh water for public supply (pop. 50,000+)"
#12 on the list of "Top 101 counties with the most Evangelical Protestant adherents (pop. 50,000+)"
There are 8 pilots and no other airmen in this city.
Top Patent Applicants
Jean-Marc Girardin (8)
Robert I. Goldfarb (4)
Rolando Garcia (4)
Bradley I. Meier (2)
Spencer Grabois (2)
Richard Lasry (2)
John Lee (2)
John Lasry (2)
Grayson Hugh Bourne (2)
Edward Lee Wiener (1)
Total of 29 patent applications in 2008-2024.


 Recent articles from our blog. Our writers, many of them Ph.D. graduates or candidates, create easy-to-read articles on a wide variety of topics.

 (5.1 miles