Estimated zip code population in 2022: 24,119 Zip code population in 2010: 25,792 Zip code population in 2000: 25,151
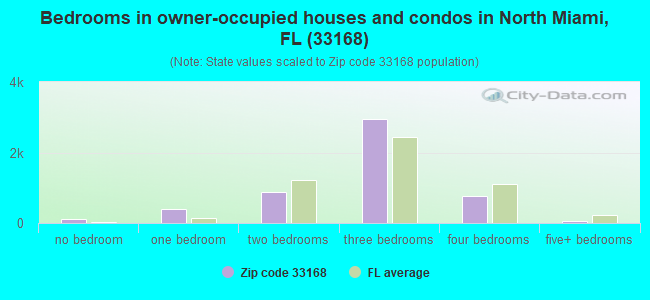
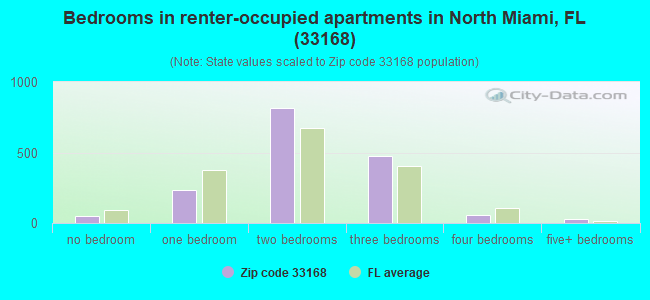
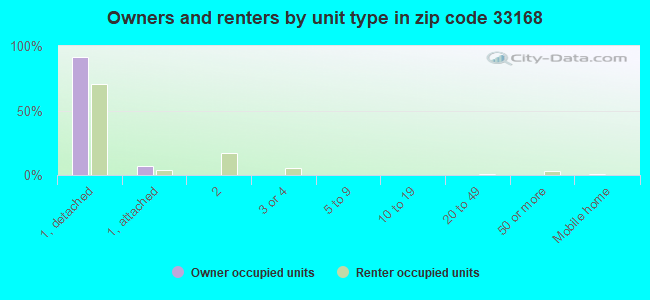
Houses and condos: 7,024 Renter-occupied apartments: 1,668
% of renters here:
24%
State:
33%
March 2022 cost of living index in zip code 33168: 104.1 (near average, U.S. average is 100)
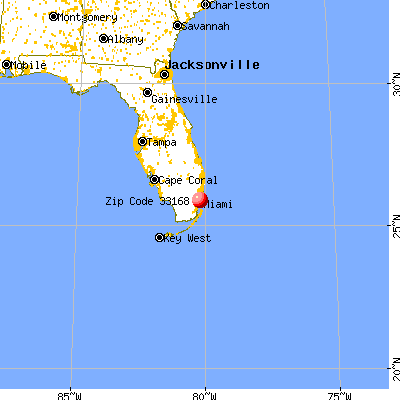
Land area: 3.7 sq. mi. Water area: 0.0 sq. mi.
Population density: 6,553 people per square mile
(high).
OSM Map
General Map
Google Map
MSN Map
OSM Map
General Map
Google Map
MSN Map
OSM Map
General Map
Google Map
MSN Map
OSM Map
General Map
Google Map
MSN Map
Please wait while loading the map...
Real estate property taxes paid for housing units in 2022:
This zip code:
0.6% ($2,083)
Florida:
0.7% ($2,529)
Median real estate property taxes paid for housing units with mortgages in 2022: $2,340 (0.6%) Median real estate property taxes paid for housing units with no mortgage in 2022: $1,715 (0.5%)
Business Search- 14 Million verified businesses
Males: 12,590
(52.2%)
Females: 11,530
(47.8%)
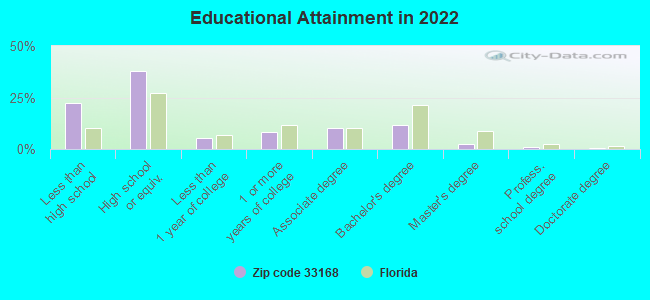
For population 25 years and over in 33168:
High school or higher: 76.9%
Bachelor's degree or higher: 15.8%
Graduate or professional degree: 4.4%
Unemployed: 4.7%
Mean travel time to work (commute): 29.3 minutes
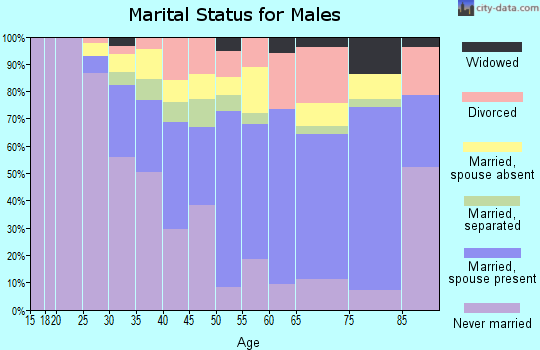
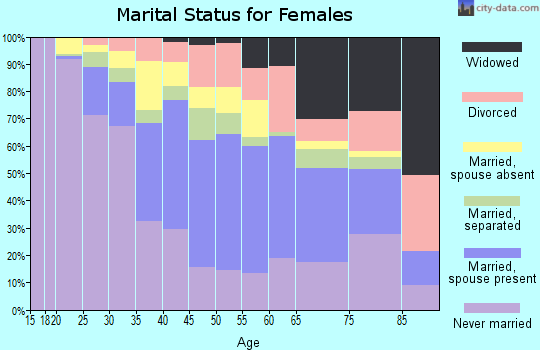
For population 15 years and over in 33168:
Never married: 43.0%
Now married: 41.1%
Separated: 2.7%
Widowed: 4.7%
Divorced: 8.6%
Zip code 33168 compared to state average:
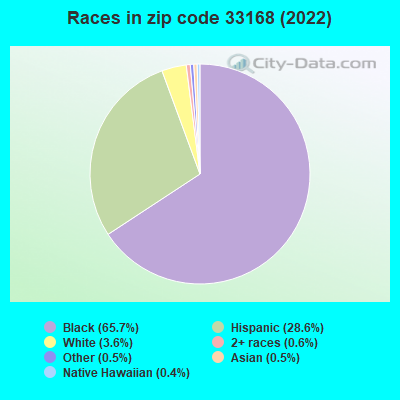
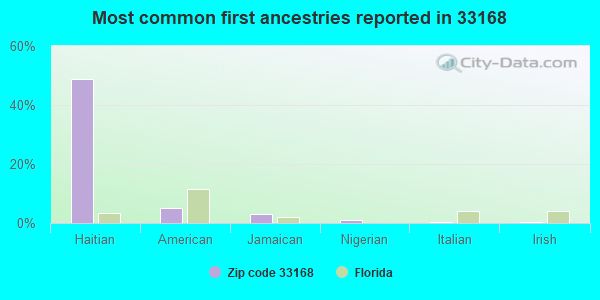
Black race population percentage significantly above state average.
Median age below state average.
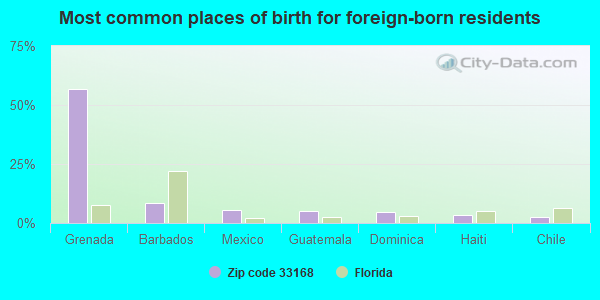
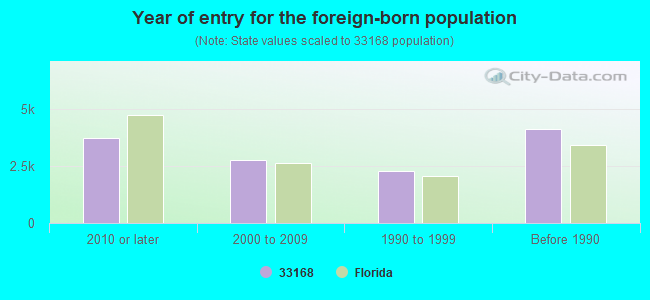
Foreign-born population percentage significantly above state average.
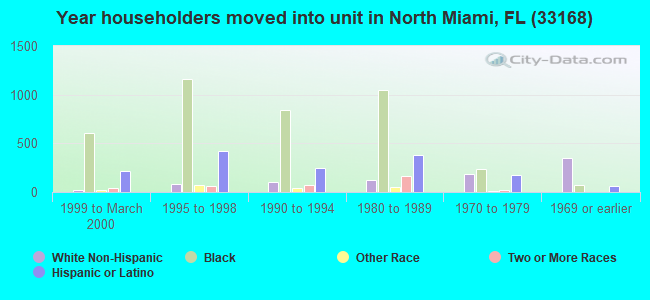
Length of stay since moving in significantly above state average.
House age significantly above state average.
Percentage of population with a bachelor's degree or higher significantly below state average.
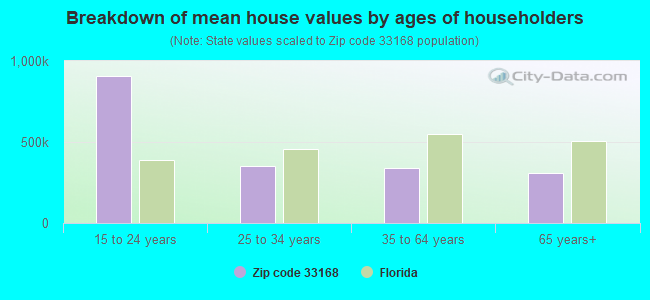
Estimated median house/condo value in 2022: $356,039
33168:
$356,039
Florida:
$354,100
According to our research of Florida and other state lists, there were 11 registered sex offenders living in 33168 zip code as of April 27, 2024. The ratio of all residents to sex offenders in zip code 33168 is 2,701 to 1. The ratio of registered sex offenders to all residents in this zip code is much lower than the state average.
Median resident age:
This zip code:
38.7 years
Florida median age:
42.7 years
Average household size:
This zip code:
3.5 people
Florida:
2.5 people
Averages for the 2020 tax year for zip code 33168, filed in 2021:
Average Adjusted Gross Income (AGI) in 2020: $32,636 (Individual Income Tax Returns)
Here:
$32,636
State:
$82,200
Salary/wage: $32,377 (reported on 84.0% of returns)
Here:
$32,377
State:
$58,347
(% of AGI for various income ranges: 1358.4% for AGIs below $25k, 3681.2% for AGIs $25k-50k, 6815.3% for AGIs $50k-75k, 10018.4% for AGIs $75k-100k, 15645.4% for AGIs $100k-200k, 55896.7% for AGIs over 200k)
Taxable interest for individuals: $353 (reported on 8.7% of returns)
This zip code:
$353
Florida:
$4,272
(% of AGI for various income ranges: 1.8% for AGIs below $25k, 2.5% for AGIs $25k-50k, 8.5% for AGIs $50k-75k, 16.1% for AGIs $75k-100k, 22.9% for AGIs $100k-200k, 76.7% for AGIs over 200k)
Ordinary dividends: $1,302 (reported on 3.6% of returns)
Here:
$1,302
State:
$15,863
(% of AGI for various income ranges: 2.1% for AGIs below $25k, 2.2% for AGIs $25k-50k, 5.0% for AGIs $50k-75k, 13.2% for AGIs $75k-100k, 65.4% for AGIs $100k-200k, 603.3% for AGIs over 200k)
Net capital gain/loss in AGI: +$12,389 (reported on 4.8% of returns)
Here:
+$12,389
State:
+$62,983
(% of AGI for various income ranges: 10.3% for AGIs $50k-75k, 42.1% for AGIs $75k-100k, 323.2% for AGIs $100k-200k, 26040.0% for AGIs over 200k)
Profit/loss from business: +$821 (reported on 35.2% of returns)
Here:
+$821
State:
+$9,719
(% of AGI for various income ranges: 93.7% for AGIs below $25k, 48.4% for AGIs $50k-75k, 85.3% for AGIs $75k-100k, 840.0% for AGIs over 200k)
Taxable individual retirement arrangement distribution: $13,948 (reported on 1.7% of returns)
33168:
$13,948
Florida:
$24,823
(% of AGI for various income ranges: 6.9% for AGIs below $25k, 13.7% for AGIs $25k-50k, 50.1% for AGIs $50k-75k, 134.2% for AGIs $75k-100k, 519.6% for AGIs $100k-200k)
Total itemized deductions: $27,161 (reported on 5.4% of returns)
Here:
$27,161
State:
$45,393
(% of AGI for various income ranges: 25.2% for AGIs below $25k, 180.3% for AGIs $25k-50k, 475.9% for AGIs $50k-75k, 738.2% for AGIs $75k-100k, 1207.9% for AGIs $100k-200k, 5896.7% for AGIs over 200k)
Charity contributions: $6,979 (reported on 4.1% of returns)
Here:
$6,979
State:
$20,178
(% of AGI for various income ranges: 2.7% for AGIs below $25k, 28.0% for AGIs $25k-50k, 97.6% for AGIs $50k-75k, 158.2% for AGIs $75k-100k, 375.4% for AGIs $100k-200k, 933.3% for AGIs over 200k)
Taxes paid: $7,018 (reported on 4.9% of returns)
33168:
$7,018
State:
$6,967
(% of AGI for various income ranges: 5.5% for AGIs below $25k, 45.4% for AGIs $25k-50k, 112.3% for AGIs $50k-75k, 194.5% for AGIs $75k-100k, 268.2% for AGIs $100k-200k, 783.3% for AGIs over 200k)
Earned income credit: $2,497 (reported on 38.9% of returns)
Here:
$2,497
State:
$2,306
(% of AGI for various income ranges: 164.0% for AGIs below $25k, 97.4% for AGIs $25k-50k, 1.0% for AGIs $50k-75k)
Percentage of individuals using paid preparers for their 2020 taxes: 90.9%
Here:
91%
State:
92%
(% for various income ranges: 90.4% for AGIs below $25k, 92.1% for AGIs $25k-50k, 90.8% for AGIs $50k-75k, 90.6% for AGIs $75k-100k, 88.6% for AGIs $100k-200k, 87.5% for AGIs over 200k)
Averages for the 2012 tax year for zip code 33168, filed in 2013:
Average Adjusted Gross Income (AGI) in 2012: $23,017 (Individual Income Tax Returns)
Here:
$23,017
State:
$60,316
Salary/wage: $22,801 (reported on 85.8% of returns)
Here:
$22,801
State:
$45,277
(% of AGI for various income ranges: 83.2% for AGIs below $25k, 91.5% for AGIs $25k-50k, 83.0% for AGIs $50k-75k, 85.2% for AGIs $75k-100k, 88.0% for AGIs $100k-200k)
Taxable interest for individuals: $1,446 (reported on 8.5% of returns)
This zip code:
$1,446
Florida:
$3,587
(% of AGI for various income ranges: 0.6% for AGIs below $25k, 0.6% for AGIs $25k-50k, 0.5% for AGIs $50k-75k, 0.2% for AGIs $75k-100k, 0.2% for AGIs $100k-200k)
Ordinary dividends: $12,611 (reported on 5.2% of returns)
Here:
$12,611
State:
$12,831
(% of AGI for various income ranges: 3.5% for AGIs below $25k, 2.5% for AGIs $25k-50k, 3.2% for AGIs $50k-75k, 1.0% for AGIs $75k-100k, 2.5% for AGIs $100k-200k)
Net capital gain/loss in AGI: +$719 (reported on 2.1% of returns)
Here:
+$719
State:
+$33,493
(% of AGI for various income ranges: 0.2% for AGIs $50k-75k, 0.2% for AGIs $75k-100k)
Profit/loss from business: +$3,821 (reported on 18.8% of returns)
Here:
+$3,821
State:
+$10,012
(% of AGI for various income ranges: 8.0% for AGIs below $25k, 1.2% for AGIs $100k-200k)
Taxable individual retirement arrangement distribution: $10,522 (reported on 1.3% of returns)
33168:
$10,522
Florida:
$21,544
(% of AGI for various income ranges: 0.2% for AGIs below $25k, 0.4% for AGIs $25k-50k, 1.7% for AGIs $50k-75k, 1.7% for AGIs $100k-200k)
Total itemized deductions: $17,494 (38% of AGI, reported on 15.7% of returns)
Here:
$17,494
State:
$25,533
Here:
37.8% of AGI
State:
18.0% of AGI
(% of AGI for various income ranges: 5.4% for AGIs below $25k, 16.7% for AGIs $25k-50k, 16.7% for AGIs $50k-75k, 16.0% for AGIs $75k-100k, 14.2% for AGIs $100k-200k)
Charity contributions: $3,467 (reported on 12.2% of returns)
Here:
$3,467
State:
$5,698
(% of AGI for various income ranges: 0.5% for AGIs below $25k, 2.3% for AGIs $25k-50k, 3.0% for AGIs $50k-75k, 3.5% for AGIs $75k-100k, 3.3% for AGIs $100k-200k)
Taxes paid: $2,497 (reported on 14.6% of returns)
33168:
$2,497
State:
$6,203
(% of AGI for various income ranges: 0.7% for AGIs below $25k, 2.0% for AGIs $25k-50k, 2.4% for AGIs $50k-75k, 2.2% for AGIs $75k-100k, 2.7% for AGIs $100k-200k)
Earned income credit: $2,459 (reported on 39.5% of returns)
Here:
$2,459
State:
$2,372
(% of AGI for various income ranges: 9.7% for AGIs below $25k, 1.7% for AGIs $25k-50k)
Percentage of individuals using paid preparers for their 2012 taxes: 65.5%
Here:
65%
State:
54%
(% for various income ranges: 62.4% for AGIs below $25k, 73.3% for AGIs $25k-50k, 70.4% for AGIs $50k-75k, 72.4% for AGIs $75k-100k, 73.9% for AGIs $100k-200k)
Averages for the 2004 tax year for zip code 33168, filed in 2005:
Average Adjusted Gross Income (AGI) in 2004: $23,377 (Individual Income Tax Returns)
Here:
$23,377
State:
$50,523
Salary/wage: $23,382 (reported on 88.5% of returns)
Here:
$23,382
State:
$39,563
(% of AGI for various income ranges: 74.9% for AGIs below $10k, 89.3% for AGIs $10k-25k, 95.5% for AGIs $25k-50k, 91.2% for AGIs $50k-75k, 89.7% for AGIs $75k-100k, 54.7% for AGIs over 100k)
Taxable interest for individuals: $662 (reported on 14.4% of returns)
This zip code:
$662
Florida:
$3,211
(% of AGI for various income ranges: 0.7% for AGIs below $10k, 0.2% for AGIs $10k-25k, 0.4% for AGIs $25k-50k, 0.9% for AGIs $50k-75k, 0.3% for AGIs $75k-100k, 0.4% for AGIs over 100k)
Taxable dividends: $844 (reported on 3.5% of returns)
Here:
$844
State:
$6,129
(% of AGI for various income ranges: 0.2% for AGIs below $10k, 0.1% for AGIs $10k-25k, 0.1% for AGIs $25k-50k, 0.2% for AGIs $50k-75k, 0.2% for AGIs $75k-100k, 0.1% for AGIs over 100k)
Net capital gain/loss: +$13,111 (reported on 2.6% of returns)
Here:
+$13,111
State:
+$27,205
(% of AGI for various income ranges: -0.1% for AGIs below $10k, 0.0% for AGIs $10k-25k, 0.1% for AGIs $25k-50k, 0.5% for AGIs $50k-75k, 0.9% for AGIs $75k-100k, 18.1% for AGIs over 100k)
Profit/loss from business: +$6,270 (reported on 18.3% of returns)
Here:
+$6,270
State:
+$10,634
(% of AGI for various income ranges: 28.4% for AGIs below $10k, 8.5% for AGIs $10k-25k, 1.1% for AGIs $25k-50k, 1.2% for AGIs $50k-75k, 1.0% for AGIs $75k-100k, 0.7% for AGIs over 100k)
IRA payment deduction: $2,352 (reported on 0.8% of returns)
33168:
$2,352
Florida:
$3,082
Total itemized deductions: $15,156 (39% of AGI, reported on 27.1% of returns)
Here:
$15,156
State:
$20,370
Here:
38.6% of AGI
State:
20.7% of AGI
(% of AGI for various income ranges: 5.0% for AGIs below $10k, 13.8% for AGIs $10k-25k, 23.5% for AGIs $25k-50k, 19.7% for AGIs $50k-75k, 17.0% for AGIs $75k-100k, 10.8% for AGIs over 100k)
Charity contributions deductions: $2,853 (7% of AGI, reported on 23.3% of returns)
Here:
$2,853
State:
$4,064
Here:
7.0% of AGI
State:
3.8% of AGI
(% of AGI for various income ranges: 0.4% for AGIs below $10k, 1.7% for AGIs $10k-25k, 3.7% for AGIs $25k-50k, 3.9% for AGIs $50k-75k, 4.0% for AGIs $75k-100k, 2.5% for AGIs over 100k)
Total tax: $2,416 (reported on 54.4% of returns)
33168:
$2,416
State:
$9,431
(% of AGI for various income ranges: 5.0% for AGIs below $10k, 2.5% for AGIs $10k-25k, 4.0% for AGIs $25k-50k, 8.2% for AGIs $50k-75k, 10.2% for AGIs $75k-100k, 18.1% for AGIs over 100k)
Earned income credit: $2,105 (reported on 44.6% of returns)
Here:
$2,105
State:
$1,808
Percentage of individuals using paid preparers for their 2004 taxes: 66.5%
Here:
67%
State:
60%
(% for various income ranges: 63.2% for AGIs below $10k, 68.4% for AGIs $10k-25k, 66.6% for AGIs $25k-50k, 65.5% for AGIs $50k-75k, 64.2% for AGIs $75k-100k, 75.7% for AGIs over 100k)
Likely homosexual households (counted as self-reported same-sex unmarried-partner households)
Lesbian couples: 0.2% of all households
Gay men: 0.0% of all households
Household received Food Stamps/SNAP in the past 12 months: 1,904 Household did not receive Food Stamps/SNAP in the past 12 months: 4,877
Women who had a birth in the past 12 months: 346 (219 now married, 125 unmarried) Women who did not have a birth in the past 12 months: 4,729 (1,668 now married, 3,060 unmarried)
Housing units in zip code 33168 with a mortgage: 3,235 (264 second mortgage, 7 home equity loan, 166 both second mortgage and home equity loan) Houses without a mortgage: 48
Median monthly owner costs for units with a mortgage: $1,735 Median monthly owner costs for units without a mortgage: $539
Residents with income below the poverty level in 2022:
This zip code:
16.7%
Whole state:
12.7%
Residents with income below 50% of the poverty level in 2022:
This zip code:
12.2%
Whole state:
6.6%
Median number of rooms in houses and condos:
Here:
5.6
State:
5.9
Median number of rooms in apartments:
Here:
4.6
State:
4.2
Notable locations in this zip code not listed on our city pages
Notable locations in zip code 33168: Biscayne Kennel Club (A), Skipper Chuck's Child Care Number 4 (B), Northwood Baptist Church Day Care Center (C), North Miami Health Center (D), Margie's House Day Care Center (E), Christine Curry Child Development Center (F), Miami - Dade County Fire Rescue Station 19 (G). Display/hide their locations on the map
Churches in zip code 33168 include: Saint James Church (A), Good Shepherd Church (B), Church of Christ Written in Heaven (C), North Miami Avenue Church of God (D). Display/hide their locations on the map
Parks in zip code 33168 include: North Miami Tot Lot (1), Sasso Park (2), Oak Park (3), Gratigny Plateau Park (4), Ben Franklin Park (5). Display/hide their locations on the map
2,145 married couples with children.
1,091 single-parent households (256 men, 835 women).
28.6% of residents of 33168 zip code speak English at home.
27.6% of residents speak Spanish at home (52% very well, 22% well, 18% not well, 9% not at all).
44.8% of residents speak other Indo-European language at home (64% very well, 20% well, 15% not well, 2% not at all).
0.3% of residents speak Asian or Pacific Island language at home (31% very well, 69% well).
0.1% of residents speak other language at home (44% very well, 56% well).
Foreign born population: 12,108 (50.2%) (68.4% of them are naturalized citizens)
Major facilities with environmental interests located in this zip code:
GRATIGNY ELEMENTARY SCHOOL (11905 NORTH MIAMI AVENUE in MIAMI, FL)
(National Center for Education Statistics) - STATE ID-2241 Small Quantity Generators, between 100 kg and 1000 kg of hazardous waste/month (Resource Conservation and Recovery Act (tracking hazardous waste)) - notification Organizations: MARIA ORTH, PRINCIPAL (CONTACT/OWNER)
, DADE COUNTY SCHOOL DISTRICT (SCHOOL DISTRICT)
Alternative names: DADE CO GRATIGNY ELEMENTARY
HUBERT O. SIBLEY SCHOOL (255 NW 115TH STREET in MIAMI, FL)
(National Center for Education Statistics) - STATE ID-5141 Organizations: DADE COUNTY SCHOOL DISTRICT (SCHOOL DISTRICT)
MIAMI SHORES/BARRY UNIV. CHARTER (FORMERLY CONNECT (11441 NW 2ND AVENUE in MIAMI SHORES, FL)
(National Center for Education Statistics) - STATE ID-6040 Organizations: DADE COUNTY SCHOOL DISTRICT (SCHOOL DISTRICT)
HAPPINESS CLEANERS (12932 NW 7TH AVE in NORTH MIAMI, FL)
AMOCO SERVICE STATION #675 (11899 NW 7TH AVE in MIAMI, FL)
Small Quantity Generators, between 100 kg and 1000 kg of hazardous waste/month (Resource Conservation and Recovery Act (tracking hazardous waste)) - notification Organizations: BERNARDO GONZALEZ, DEALER (CONTACT/OWNER)
HILL YORK SALES & SERVICE (10750 NW 6TH CT in MIAMI, FL)
Small Quantity Generators, between 100 kg and 1000 kg of hazardous waste/month (Resource Conservation and Recovery Act (tracking hazardous waste)) - notification Organizations: NEALE CARD, PURCHASING (CONTACT/OWNER)
J T ATKINS AUTO SALES INC (14120 NW 7TH AVE in MIAMI, FL)
Small Quantity Generators, between 100 kg and 1000 kg of hazardous waste/month (Resource Conservation and Recovery Act (tracking hazardous waste)) - notification Organizations: JIM MORRIS (CONTACT/OWNER)
MOBIL OIL CORP SS# A12 (650 OPA LOCKA BOULEVARD in NORTH MIAMI, FL)
Small Quantity Generators, between 100 kg and 1000 kg of hazardous waste/month (Resource Conservation and Recovery Act (tracking hazardous waste)) - notification Organizations: DAN HORTON (CONTACT/OWNER)
DADE CO FRANKLIN BENJAMIN ELEMENTAR (13100 NW 12TH AVE in MIAMI, FL)
Small Quantity Generators, between 100 kg and 1000 kg of hazardous waste/month (Resource Conservation and Recovery Act (tracking hazardous waste)) - notification Organizations: DOROTHY BLAKE, PRINCIPAL (CONTACT/OWNER)
DADE CO JEFFERSON JR HIGH (525 NW 147 STREET in MIAMI, FL)
Small Quantity Generators, between 100 kg and 1000 kg of hazardous waste/month (Resource Conservation and Recovery Act (tracking hazardous waste)) - notification Organizations: BURKE JOSEPH P , PRINCIPAL (CONTACT/OWNER)
SPEC POOL SERVICE & EQUIP CO (14855 NW 7TH AVENUE in MIAMI, FL)
COMPLIANCE ACTIVITY (Tracking inspections of insecticide, fungicide, and rodenticide, and toxic substances)
Housing units lacking complete plumbing facilities: 0.9% Housing units lacking complete kitchen facilities: 0.8%
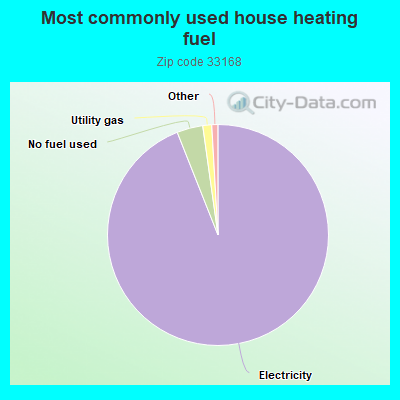
94.0%Electricity
3.8%No fuel used
1.3%Utility gas
Population in 1990: 21,629. Population change in the 1990s: +3,522 (+16.3%).
Place of birth for U.S.-born residents:
This state: 9,454
Northeast: 550
Midwest: 262
South: 721
West: 56
65% of the 33168 zip code residents lived in the same house 5 years ago. Out of people who lived in different houses, 86% lived in this county. Out of people who lived in different counties, 50% lived in Florida.
95% of the 33168 zip code residents lived in the same house 1 year ago. Out of people who lived in different houses, 73% moved from this county. Out of people who lived in different houses, 21% moved from different county within same state. Out of people who lived in different houses, 5% moved from different state.
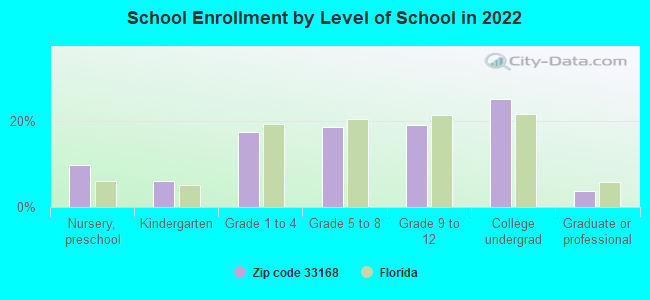
Private vs. public school enrollment:
Students in private schools in grades 1 to 8 (elementary and middle school): 215
Here:
9.5%
Florida:
15.8%
Students in private schools in grades 9 to 12 (high school): 38
Here:
3.2%
Florida:
12.9%
Students in private undergraduate colleges: 271
Here:
17.3%
Florida:
23.6%
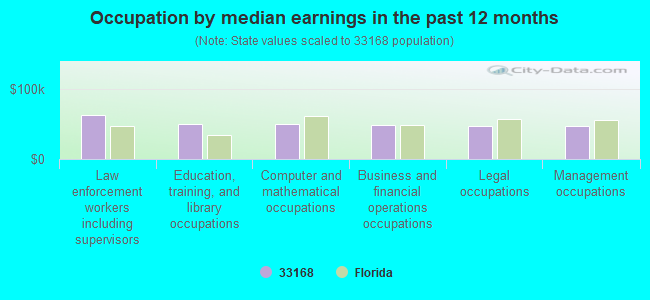
Occupation by median earnings in the past 12 months ($)
62,404Law enforcement workers including supervisors
50,059Education, training, and library occupations
49,464Computer and mathematical occupations
48,320Business and financial operations occupations
47,747Legal occupations
47,504Management occupations
Companies with federal contracts located in this zip code (MIAMI, FL):
SHIP SUPPLY OF FLORIDA INC (15065 NW 7TH AVE; small business) : $831,440 in 32 contractsfrom 2003 to 2005
Contracts for Logistics Support Services, Miscellaneous Items, Miscellaneous Ship and Marine Equipment, Non-nuclear Ship Repair (East) Ship repair (including overhauls and conversions) performed on non-nuclear propelled and nonpropelled ships east of the 108th meridian, and moreby Navy Signed by year:2000: $0; 2001: $0; 2002: $0; 2003: $78,312; 2004: $153,263; 2005: $599,865; 2006: $0.
Biggest contracts:
$151,679 with Navy for Logistics Support Services. Signed on 2005-09-01. Completion date: 2005-11-30.
$142,103, same as above.Signed on 2005-03-17. Completion date: 2005-05-31.
$122,500 with Navy for Miscellaneous Items. Signed on 2005-09-07. Completion date: 2005-09-05.
$78,312 with Navy for Miscellaneous Ship and Marine Equipment. Signed on 2003-05-02. Completion date: 2003-05-05.
INTERNATIONAL AIRCRAFT ASSOCIA (14040 NW 7TH AVE; small business) : $40,210 in 6 contractsfrom 2004 to 2006
Contracts for Miscellaneous Engine Accessories, Aircraft, Gas Turbines and Jet Engines, Aircraft; Prime Moving, and Components, Engine Fuel System Components, Aircraft and Missile Prime Movers, Airframe Structural Components, and moreby Air Force, Defense Logistics Agency Signed by year:2000: $0; 2001: $0; 2002: $0; 2003: $0; 2004: $4,500; 2005: $19,210; 2006: $16,500.
Biggest contracts:
$16,500 with Air Force for Miscellaneous Engine Accessories, Aircraft. Signed on 2006-03-08. Completion date: 2006-03-22.
$15,810 with Defense Logistics Agency for Gas Turbines and Jet Engines, Aircraft; Prime Moving, and Components. Signed on 2005-04-13. Completion date: 2005-05-05.
$4,500 with Air Force for Engine Fuel System Components, Aircraft and Missile Prime Movers. Signed on 2004-12-29. Completion date: 2005-01-12.
$3,400 with Air Force for Airframe Structural Components. Signed on 2005-08-02. Completion date: 2005-08-16.
CENTURY CLEANING INC (672 NW 118TH STREET; small business)
$27,248 with Navy for Custodial Janitorial Services. Signed on 2005-04-29. Completion date: 2006-05-06.
global restaurant equipment & suppl (650 nw 123rd st) : $6,120 in 2 contractsin 2005
$3,100 with Bureau of Prisoners/Federal Prison System for Kitchen Equipment and Appliances. Taking place in CA. Signed on 2005-02-22. Completion date: 2005-03-04.
$3,020 with Bureau of Prisoners/Federal Prison System for Refrigeration Equipment. Taking place in CA. Signed on 2005-08-17. Completion date: 2005-09-17.
Top industries in this zip code by the number of employees in 2005:
Administrative and Support and Waste Management and Remediation Services: Janitorial Services (over 1000 employees: 1 establishment, 1-4 employees: 3 establishments)
2008 - 2018 National Fire Incident Reporting System (NFIRS) incidents
Based on the data from the years 2008 - 2018 the average number of fires per year is 66. The highest number of fire incidents - 83 took place in 2013, and the least - 37 in 2015. The data has an increasing trend.
When looking into fire subcategories, the most incidents belonged to: Mobile Property/Vehicle Fires (43.1%), and Structure Fires (30.4%).
Fire incident types reported to NFIRS in Zip Code 33168


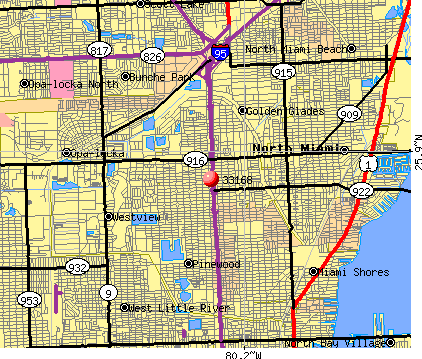 Nearest zip codes: 33161, 33167, 33150, 33162, 33138, 33169.
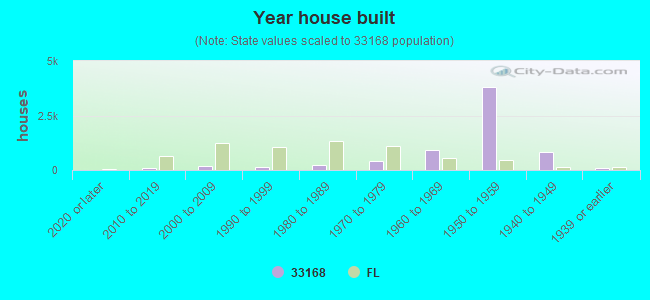


 Based on the data from the years 2008 - 2018 the average number of fires per year is 66. The highest number of fire incidents - 83 took place in 2013, and the least - 37 in 2015. The data has an increasing trend.
 When looking into fire subcategories, the most incidents belonged to: Mobile Property/Vehicle Fires (43.1%), and Structure Fires (30.4%).