Estimated zip code population in 2022: 36,981 Zip code population in 2010: 35,249 Zip code population in 2000: 36,545
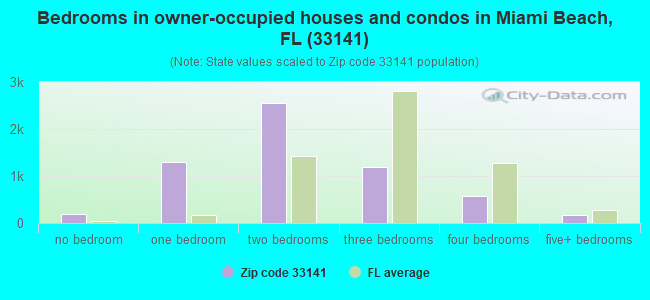
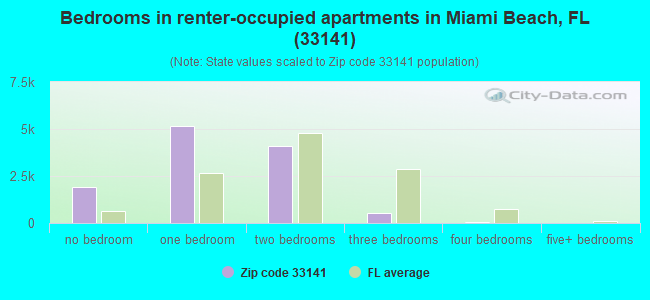
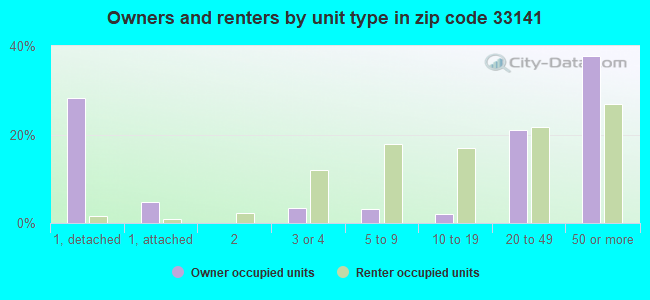
Houses and condos: 22,451 Renter-occupied apartments: 11,523
% of renters here:
66%
State:
33%
March 2022 cost of living index in zip code 33141: 106.7 (more than average, U.S. average is 100)
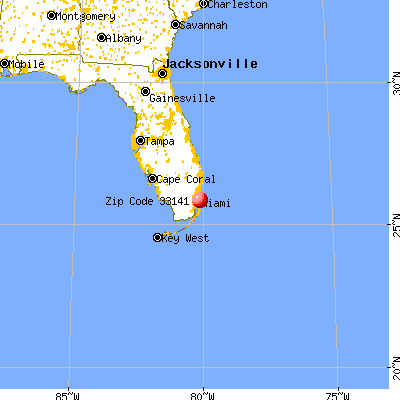
Land area: 2.3 sq. mi. Water area: 5.2 sq. mi.
Population density: 15,970 people per square mile
(very high).
OSM Map
General Map
Google Map
MSN Map
OSM Map
General Map
Google Map
MSN Map
OSM Map
General Map
Google Map
MSN Map
OSM Map
General Map
Google Map
MSN Map
Please wait while loading the map...
Real estate property taxes paid for housing units in 2022:
This zip code:
0.7% ($3,724)
Florida:
0.7% ($2,529)
Median real estate property taxes paid for housing units with mortgages in 2022: $3,904 (0.8%) Median real estate property taxes paid for housing units with no mortgage in 2022: $3,510 (0.7%)
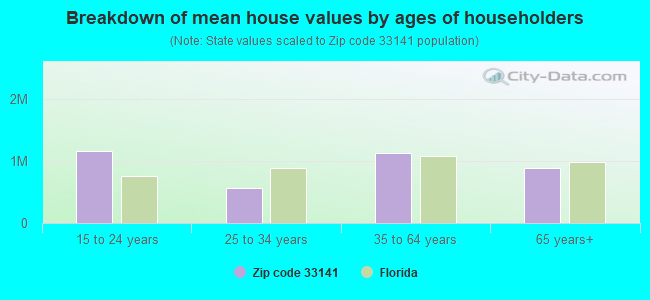
Estimated median house/condo value in 2022: $508,852
33141:
$508,852
Florida:
$354,100
According to our research of Florida and other state lists, there were 4 registered sex offenders living in 33141 zip code as of April 27, 2024. The ratio of all residents to sex offenders in zip code 33141 is 10,077 to 1. The ratio of registered sex offenders to all residents in this zip code is much lower than the state average.
Median resident age:
This zip code:
44.6 years
Florida median age:
42.7 years
Average household size:
This zip code:
2.1 people
Florida:
2.5 people
Averages for the 2020 tax year for zip code 33141, filed in 2021:
Average Adjusted Gross Income (AGI) in 2020: $111,468 (Individual Income Tax Returns)
Here:
$111,468
State:
$82,200
Salary/wage: $76,441 (reported on 73.0% of returns)
Here:
$76,441
State:
$58,347
(% of AGI for various income ranges: 1092.9% for AGIs below $25k, 3647.6% for AGIs $25k-50k, 7239.7% for AGIs $50k-75k, 10900.0% for AGIs $75k-100k, 19409.9% for AGIs $100k-200k, 199710.4% for AGIs over 200k)
Taxable interest for individuals: $13,803 (reported on 19.8% of returns)
This zip code:
$13,803
Florida:
$4,272
(% of AGI for various income ranges: 17.5% for AGIs below $25k, 27.9% for AGIs $25k-50k, 49.4% for AGIs $50k-75k, 169.4% for AGIs $75k-100k, 334.1% for AGIs $100k-200k, 16656.7% for AGIs over 200k)
Ordinary dividends: $27,169 (reported on 14.8% of returns)
Here:
$27,169
State:
$15,863
(% of AGI for various income ranges: 22.8% for AGIs below $25k, 33.7% for AGIs $25k-50k, 134.7% for AGIs $50k-75k, 298.6% for AGIs $75k-100k, 677.1% for AGIs $100k-200k, 23769.6% for AGIs over 200k)
Net capital gain/loss in AGI: +$125,298 (reported on 17.4% of returns)
Here:
+$125,298
State:
+$62,983
(% of AGI for various income ranges: 7.3% for AGIs below $25k, 57.6% for AGIs $25k-50k, 108.9% for AGIs $50k-75k, 415.7% for AGIs $75k-100k, 1664.4% for AGIs $100k-200k, 144220.4% for AGIs over 200k)
Profit/loss from business: +$13,077 (reported on 39.1% of returns)
Here:
+$13,077
State:
+$9,719
(% of AGI for various income ranges: 340.7% for AGIs below $25k, 204.3% for AGIs $25k-50k, 330.0% for AGIs $50k-75k, 698.4% for AGIs $75k-100k, 1074.0% for AGIs $100k-200k, 19460.0% for AGIs over 200k)
Taxable individual retirement arrangement distribution: $21,691 (reported on 3.5% of returns)
33141:
$21,691
Florida:
$24,823
(% of AGI for various income ranges: 15.5% for AGIs below $25k, 32.2% for AGIs $25k-50k, 93.8% for AGIs $50k-75k, 165.1% for AGIs $75k-100k, 547.3% for AGIs $100k-200k, 2160.0% for AGIs over 200k)
Self-employed (Keogh) retirement plans: $43,355 (reported on 0.6% of returns)
33141:
$43,355
Florida:
$29,694
(% of AGI for various income ranges: 29.5% for AGIs $50k-75k, 1608.9% for AGIs over 200k)
Total itemized deductions: $53,991 (reported on 8.5% of returns)
Here:
$53,991
State:
$45,393
(% of AGI for various income ranges: 42.6% for AGIs below $25k, 163.1% for AGIs $25k-50k, 367.8% for AGIs $50k-75k, 718.4% for AGIs $75k-100k, 1392.7% for AGIs $100k-200k, 21305.6% for AGIs over 200k)
Charity contributions: $18,968 (reported on 6.3% of returns)
Here:
$18,968
State:
$20,178
(% of AGI for various income ranges: 1.6% for AGIs below $25k, 17.3% for AGIs $25k-50k, 46.2% for AGIs $50k-75k, 89.8% for AGIs $75k-100k, 214.1% for AGIs $100k-200k, 6981.9% for AGIs over 200k)
Taxes paid: $8,167 (reported on 8.1% of returns)
33141:
$8,167
State:
$6,967
(% of AGI for various income ranges: 11.0% for AGIs below $25k, 35.3% for AGIs $25k-50k, 93.6% for AGIs $50k-75k, 179.7% for AGIs $75k-100k, 340.5% for AGIs $100k-200k, 2020.7% for AGIs over 200k)
Earned income credit: $1,679 (reported on 23.7% of returns)
Here:
$1,679
State:
$2,306
(% of AGI for various income ranges: 102.3% for AGIs below $25k, 49.7% for AGIs $25k-50k)
Percentage of individuals using paid preparers for their 2020 taxes: 89.5%
Here:
89%
State:
92%
(% for various income ranges: 87.0% for AGIs below $25k, 91.5% for AGIs $25k-50k, 91.8% for AGIs $50k-75k, 91.3% for AGIs $75k-100k, 90.1% for AGIs $100k-200k, 92.2% for AGIs over 200k)
Averages for the 2012 tax year for zip code 33141, filed in 2013:
Average Adjusted Gross Income (AGI) in 2012: $76,077 (Individual Income Tax Returns)
Here:
$76,077
State:
$60,316
Salary/wage: $47,261 (reported on 78.4% of returns)
Here:
$47,261
State:
$45,277
(% of AGI for various income ranges: 75.1% for AGIs below $25k, 89.5% for AGIs $25k-50k, 84.6% for AGIs $50k-75k, 77.1% for AGIs $75k-100k, 71.4% for AGIs $100k-200k, 25.7% for AGIs over 200k)
Taxable interest for individuals: $8,194 (reported on 19.4% of returns)
This zip code:
$8,194
Florida:
$3,587
(% of AGI for various income ranges: 0.9% for AGIs below $25k, 0.7% for AGIs $25k-50k, 0.8% for AGIs $50k-75k, 1.3% for AGIs $75k-100k, 2.0% for AGIs $100k-200k, 2.8% for AGIs over 200k)
Ordinary dividends: $20,849 (reported on 10.8% of returns)
Here:
$20,849
State:
$12,831
(% of AGI for various income ranges: 1.4% for AGIs below $25k, 1.0% for AGIs $25k-50k, 1.4% for AGIs $50k-75k, 1.7% for AGIs $75k-100k, 2.6% for AGIs $100k-200k, 4.0% for AGIs over 200k)
Net capital gain/loss in AGI: +$163,740 (reported on 10.4% of returns)
Here:
+$163,740
State:
+$33,493
(% of AGI for various income ranges: 0.3% for AGIs $25k-50k, 0.3% for AGIs $50k-75k, 1.7% for AGIs $75k-100k, 2.7% for AGIs $100k-200k, 38.1% for AGIs over 200k)
Profit/loss from business: +$9,921 (reported on 29.2% of returns)
Here:
+$9,921
State:
+$10,012
(% of AGI for various income ranges: 17.8% for AGIs below $25k, 3.5% for AGIs $25k-50k, 2.9% for AGIs $50k-75k, 3.8% for AGIs $75k-100k, 3.4% for AGIs $100k-200k, 2.0% for AGIs over 200k)
Taxable individual retirement arrangement distribution: $26,107 (reported on 3.7% of returns)
33141:
$26,107
Florida:
$21,544
(% of AGI for various income ranges: 0.9% for AGIs below $25k, 0.8% for AGIs $25k-50k, 1.6% for AGIs $50k-75k, 2.5% for AGIs $75k-100k, 2.7% for AGIs $100k-200k, 1.0% for AGIs over 200k)
Self-employment retirement plans: $23,011 (reported on 0.5% of returns)
33141:
$23,011
Florida:
$20,611
(% of AGI for various income ranges: 0.1% for AGIs below $25k, 0.4% for AGIs $50k-75k, 0.2% for AGIs over 200k)
Total itemized deductions: $32,573 (14% of AGI, reported on 22.6% of returns)
Here:
$32,573
State:
$25,533
Here:
13.9% of AGI
State:
18.0% of AGI
(% of AGI for various income ranges: 7.6% for AGIs below $25k, 12.5% for AGIs $25k-50k, 11.8% for AGIs $50k-75k, 12.4% for AGIs $75k-100k, 13.2% for AGIs $100k-200k, 8.3% for AGIs over 200k)
Charity contributions: $8,157 (reported on 16.4% of returns)
Here:
$8,157
State:
$5,698
(% of AGI for various income ranges: 0.4% for AGIs below $25k, 1.0% for AGIs $25k-50k, 1.2% for AGIs $50k-75k, 1.3% for AGIs $75k-100k, 1.6% for AGIs $100k-200k, 2.3% for AGIs over 200k)
Taxes paid: $10,980 (reported on 20.6% of returns)
33141:
$10,980
State:
$6,203
(% of AGI for various income ranges: 1.2% for AGIs below $25k, 1.6% for AGIs $25k-50k, 2.4% for AGIs $50k-75k, 3.0% for AGIs $75k-100k, 3.6% for AGIs $100k-200k, 3.5% for AGIs over 200k)
Earned income credit: $1,999 (reported on 27.3% of returns)
Here:
$1,999
State:
$2,372
(% of AGI for various income ranges: 7.5% for AGIs below $25k, 0.7% for AGIs $25k-50k)
Percentage of individuals using paid preparers for their 2012 taxes: 65.8%
Here:
66%
State:
54%
(% for various income ranges: 65.4% for AGIs below $25k, 62.3% for AGIs $25k-50k, 65.1% for AGIs $50k-75k, 67.9% for AGIs $75k-100k, 70.0% for AGIs $100k-200k, 88.4% for AGIs over 200k)
Averages for the 2004 tax year for zip code 33141, filed in 2005:
Average Adjusted Gross Income (AGI) in 2004: $44,544 (Individual Income Tax Returns)
Here:
$44,544
State:
$50,523
Salary/wage: $35,580 (reported on 78.0% of returns)
Here:
$35,580
State:
$39,563
(% of AGI for various income ranges: 143.3% for AGIs below $10k, 82.0% for AGIs $10k-25k, 88.8% for AGIs $25k-50k, 81.0% for AGIs $50k-75k, 76.7% for AGIs $75k-100k, 40.4% for AGIs over 100k)
Taxable interest for individuals: $5,033 (reported on 27.3% of returns)
This zip code:
$5,033
Florida:
$3,211
(% of AGI for various income ranges: 12.4% for AGIs below $10k, 1.8% for AGIs $10k-25k, 1.5% for AGIs $25k-50k, 2.4% for AGIs $50k-75k, 2.1% for AGIs $75k-100k, 4.0% for AGIs over 100k)
Taxable dividends: $7,144 (reported on 12.4% of returns)
Here:
$7,144
State:
$6,129
(% of AGI for various income ranges: 6.3% for AGIs below $10k, 1.0% for AGIs $10k-25k, 0.7% for AGIs $25k-50k, 1.7% for AGIs $50k-75k, 2.1% for AGIs $75k-100k, 2.6% for AGIs over 100k)
Net capital gain/loss: +$30,298 (reported on 12.5% of returns)
Here:
+$30,298
State:
+$27,205
(% of AGI for various income ranges: 0.8% for AGIs below $10k, 0.3% for AGIs $10k-25k, 0.7% for AGIs $25k-50k, 2.6% for AGIs $50k-75k, 2.8% for AGIs $75k-100k, 15.4% for AGIs over 100k)
Profit/loss from business: +$8,620 (reported on 26.5% of returns)
Here:
+$8,620
State:
+$10,634
(% of AGI for various income ranges: 69.1% for AGIs below $10k, 11.0% for AGIs $10k-25k, 4.0% for AGIs $25k-50k, 3.1% for AGIs $50k-75k, 4.8% for AGIs $75k-100k, 2.9% for AGIs over 100k)
IRA payment deduction: $3,067 (reported on 2.1% of returns)
33141:
$3,067
Florida:
$3,082
(% of AGI for various income ranges: 0.3% for AGIs below $10k, 0.2% for AGIs $10k-25k, 0.2% for AGIs $25k-50k, 0.2% for AGIs $50k-75k, 0.2% for AGIs $75k-100k, 0.1% for AGIs over 100k)
Self-employed pension: $15,623 (reported on 0.5% of returns)
Here:
$15,623
Florida:
$15,857
(% of AGI for various income ranges: 0.1% for AGIs $10k-25k, 0.1% for AGIs $50k-75k, 0.3% for AGIs over 100k)
Total itemized deductions: $23,124 (22% of AGI, reported on 27.2% of returns)
Here:
$23,124
State:
$20,370
Here:
22.1% of AGI
State:
20.7% of AGI
(% of AGI for various income ranges: 18.5% for AGIs below $10k, 12.0% for AGIs $10k-25k, 18.2% for AGIs $25k-50k, 17.8% for AGIs $50k-75k, 18.4% for AGIs $75k-100k, 11.7% for AGIs over 100k)
Charity contributions deductions: $3,115 (3% of AGI, reported on 22.0% of returns)
Here:
$3,115
State:
$4,064
Here:
2.8% of AGI
State:
3.8% of AGI
(% of AGI for various income ranges: 0.7% for AGIs below $10k, 0.9% for AGIs $10k-25k, 1.4% for AGIs $25k-50k, 1.4% for AGIs $50k-75k, 1.8% for AGIs $75k-100k, 1.8% for AGIs over 100k)
Total tax: $9,740 (reported on 72.8% of returns)
33141:
$9,740
State:
$9,431
(% of AGI for various income ranges: 12.5% for AGIs below $10k, 4.3% for AGIs $10k-25k, 6.7% for AGIs $25k-50k, 10.6% for AGIs $50k-75k, 12.2% for AGIs $75k-100k, 23.7% for AGIs over 100k)
Earned income credit: $1,606 (reported on 24.3% of returns)
Here:
$1,606
State:
$1,808
Percentage of individuals using paid preparers for their 2004 taxes: 71.0%
Here:
71%
State:
60%
(% for various income ranges: 72.4% for AGIs below $10k, 72.8% for AGIs $10k-25k, 66.0% for AGIs $25k-50k, 65.6% for AGIs $50k-75k, 71.3% for AGIs $75k-100k, 80.6% for AGIs over 100k)
Likely homosexual households (counted as self-reported same-sex unmarried-partner households)
Lesbian couples: 0.2% of all households
Gay men: 0.8% of all households
Household received Food Stamps/SNAP in the past 12 months: 2,912 Household did not receive Food Stamps/SNAP in the past 12 months: 14,666
Women who had a birth in the past 12 months: 200 (132 now married, 67 unmarried) Women who did not have a birth in the past 12 months: 9,269 (3,764 now married, 5,504 unmarried)
Housing units in zip code 33141 with a mortgage: 3,181 (322 second mortgage, 277 both second mortgage and home equity loan) Houses without a mortgage: 28
Median monthly owner costs for units with a mortgage: $2,636 Median monthly owner costs for units without a mortgage: $1,048
Residents with income below the poverty level in 2022:
This zip code:
11.5%
Whole state:
12.7%
Residents with income below 50% of the poverty level in 2022:
This zip code:
7.4%
Whole state:
6.6%
Median number of rooms in houses and condos:
Here:
4.2
State:
5.9
Median number of rooms in apartments:
Here:
3.2
State:
4.2
Notable locations in this zip code not listed on our city pages
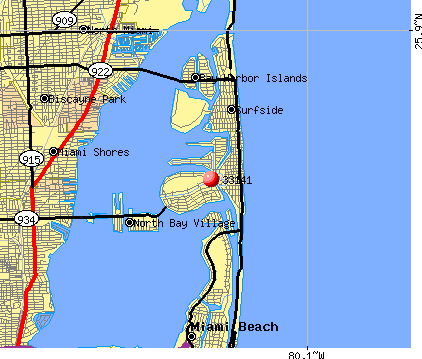
Notable locations in zip code 33141: Pelican Harbor Marina (A), North Bay Marina (B), North Bay Village Marina (C), Normandy Shores Golf Course (D), Treasure Isle Care Center (E), North Shore Community Center (F), North Shore Library (G), North Bay Village City Hall (H), North Bay Village Police Station (I), City of Miami Beach Fire Rescue Department Station 4 (J), Miami Beach Police Substation (K), Happy Kids Child Care Center (L), Abbott Nursery and Day Care Center (M), Abc Child Care Center (N), Miami - Dade County Fire Rescue Station 27 (O), Miami Beach Fire / Rescue Station 4 (P), North Bay Village City Hall - Police Chief (Q). Display/hide their locations on the map
Parks in zip code 33141 include: North Shore Open Space Park (1), Crespi Park (2), Tatum Park (3), Brittany Bay Park (4), 64th Street Park (5), North Shore Park (6). Display/hide their locations on the map
2,843 married couples with children.
1,700 single-parent households (615 men, 1,085 women).
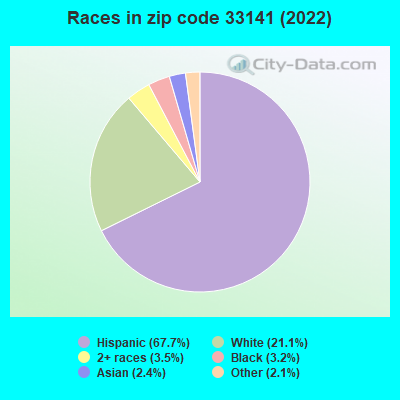
19.3% of residents of 33141 zip code speak English at home.
67.9% of residents speak Spanish at home (50% very well, 23% well, 18% not well, 9% not at all).
9.1% of residents speak other Indo-European language at home (67% very well, 26% well, 6% not well, 1% not at all).
1.7% of residents speak Asian or Pacific Island language at home (80% very well, 18% well, 2% not at all).
2.2% of residents speak other language at home (82% very well, 17% well, 2% not at all).
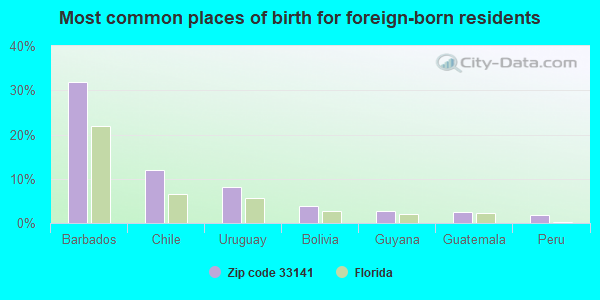
Foreign born population: 22,942 (62.0%) (55.3% of them are naturalized citizens)
This zip code:
62.0%
Whole state:
21.7%
32%Barbados
12%Chile
8%Uruguay
4%Bolivia
3%Guyana
2%Guatemala
2%Peru
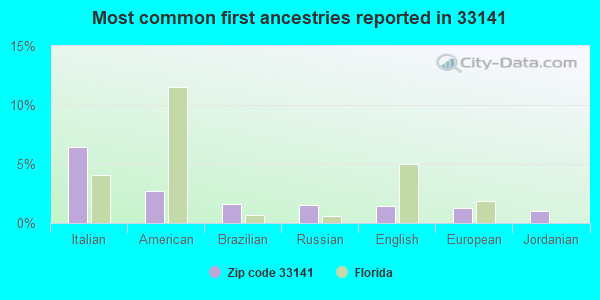
6%Italian
3%American
2%Brazilian
1%Russian
1%English
1%European
1%Jordanian
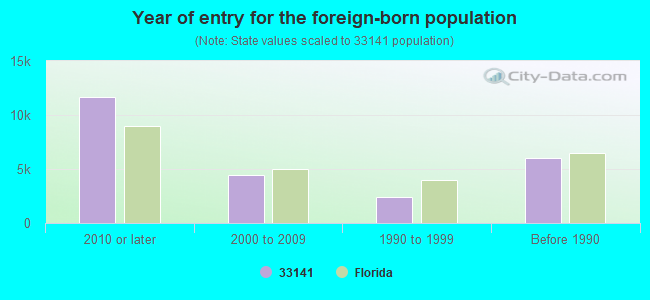
Year of entry for the foreign-born population
11,6502010 or later
4,4802000 to 2009
2,3911990 to 1999
5,982Before 1990
Facilities with environmental interests located in this zip code:
BISCAYNE ELEMENTARY SCHOOL (800 77TH STREET in MIAMI BEACH, FL)
(National Center for Education Statistics) - STATE ID-0321 Small Quantity Generators, between 100 kg and 1000 kg of hazardous waste/month (Resource Conservation and Recovery Act (tracking hazardous waste)) - notification Organizations: CARLOS FERNANDEZ, PRINCIPAL (CONTACT/OWNER)
, DADE COUNTY SCHOOL DISTRICT (SCHOOL DISTRICT)
Alternative names: DADE CO BISCAYNE ELEMENTARY
360 DEGREES CONDOMINIUMS (360 HARBOR DRIVE in NORTH BAY VILLAGE, FL)
National Pollutant Discharge Elimination System NON-MAJOR (Tracking pollutant discharge elimination systems) - permit Organizations: ANTHONY SEIJAS (CONTACT/OWNER)
Alternative names: BRADDOCK ROAD WATER & SANITARY
ASANTE SUBSTATION (NEC OAKLAND PARK BLVD/SR 7 in LAUDERDALE LAKES, FL)
National Pollutant Discharge Elimination System NON-MAJOR (Tracking pollutant discharge elimination systems) - permit Organizations: DEAN BUSCH (CONTACT/OWNER)
GERMANTOWN FPL SUBSTATION (1604 SW 10TH ST. in DELRAY BEACH, FL)
National Pollutant Discharge Elimination System NON-MAJOR (Tracking pollutant discharge elimination systems) - permit Organizations: DEAN BUSCH (CONTACT/OWNER)
DELUXE CLEANERS (1716 79TH STREET CAUSEWAY in NORTH BAY VILLAGE, FL)
AIR MINOR (AIRS/AFS) Small Quantity Generators, between 100 kg and 1000 kg of hazardous waste/month (Resource Conservation and Recovery Act (tracking hazardous waste)) - notification Business SIC classification: DRYCLEANING PLANTS, EXCEPT RUG CLEANING Organizations: ADAM AMIRALI, OWNER (CONTACT/OWNER)
Alternative names: DELUXE DRY CLEANERS
360 DEGREES DEVELOPMENT (7900 HARBOUR ISLAND DR in N BAY VILLAGE, FL)
National Pollutant Discharge Elimination System NON-MAJOR (Tracking pollutant discharge elimination systems) - permit Organizations: RAFAEL GONZALEZ (CONTACT/OWNER)
PRIVATA TOWNHOMES (25-135 N SHORE DR in MIAMI BEACH, FL)
National Pollutant Discharge Elimination System NON-MAJOR (Tracking pollutant discharge elimination systems) - permit Organizations: JOSE FERNANDEZ (CONTACT/OWNER)
ONE HOUR MARTINIZING (1716 79TH ST CAUSEWAY in NORTH BAY VILLAGE, FL)
AIR MINOR (AIRS/AFS) Business SIC classification: DRYCLEANING PLANTS, EXCEPT RUG CLEANING
NORMANDY CLEANERS (962 NORMANDY DRIVE in MIAMI BEACH, FL)
Small Quantity Generators, between 100 kg and 1000 kg of hazardous waste/month (Resource Conservation and Recovery Act (tracking hazardous waste)) - notification Organizations: JOSEPH EDELSTEIN, PRES (CONTACT/OWNER)
NORTH BEACH CLEANERS (7134 ABBOTT AVENUE in MIAMI BEACH, FL)
Small Quantity Generators, between 100 kg and 1000 kg of hazardous waste/month (Resource Conservation and Recovery Act (tracking hazardous waste)) - notification Organizations: ANWAR AMLANI (CONTACT/OWNER)
CIRCLE K #8718 (6812 COLLINS AVE in MIAMI BEACH, FL)
Small Quantity Generators, between 100 kg and 1000 kg of hazardous waste/month (Resource Conservation and Recovery Act (tracking hazardous waste)) - notification Organizations: STEVE BELIN, MGR (CONTACT/OWNER)
Housing units lacking complete plumbing facilities: 1.1% Housing units lacking complete kitchen facilities: 1.2%
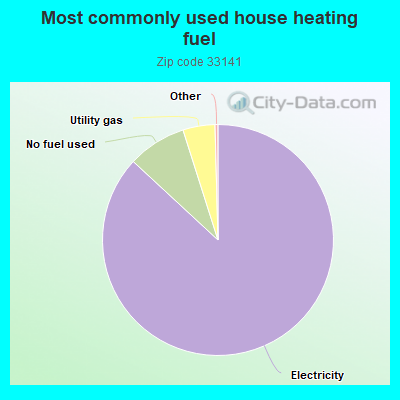
86.9%Electricity
8.2%No fuel used
4.5%Utility gas
Population in 1990: 29,489. Population change in the 1990s: +7,056 (+23.9%).
Place of birth for U.S.-born residents:
This state: 7,692
Northeast: 2,806
Midwest: 1,274
South: 1,023
West: 709
42% of the 33141 zip code residents lived in the same house 5 years ago. Out of people who lived in different houses, 73% lived in this county. Out of people who lived in different counties, 50% lived in Florida.
82% of the 33141 zip code residents lived in the same house 1 year ago. Out of people who lived in different houses, 53% moved from this county. Out of people who lived in different houses, 7% moved from different county within same state. Out of people who lived in different houses, 17% moved from different state. Out of people who lived in different houses, 21% moved from abroad.
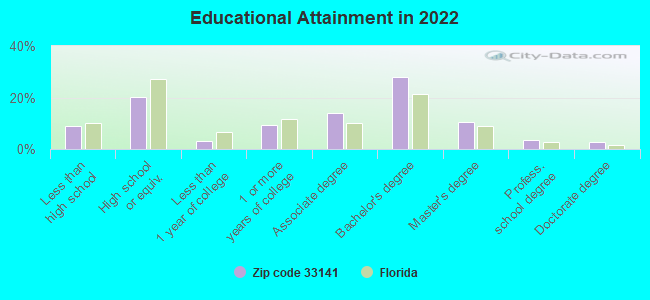
Private vs. public school enrollment:
Students in private schools in grades 1 to 8 (elementary and middle school): 344
Here:
16.3%
Florida:
15.8%
Students in private schools in grades 9 to 12 (high school): 109
Here:
7.7%
Florida:
12.9%
Students in private undergraduate colleges: 320
Here:
19.5%
Florida:
23.6%
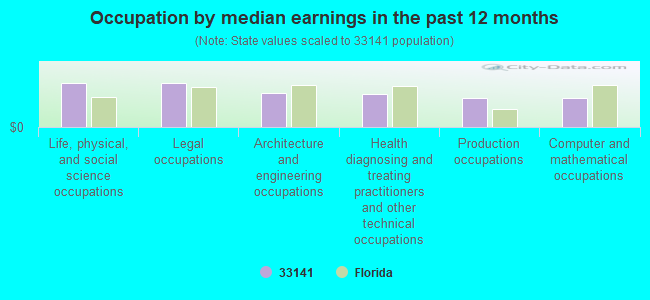
Occupation by median earnings in the past 12 months ($)
119,172Life, physical, and social science occupations
119,111Legal occupations
90,990Architecture and engineering occupations
88,913Health diagnosing and treating practitioners and other technical occupations
79,162Production occupations
78,503Computer and mathematical occupations
Companies with federal contracts located in this zip code:
NON-INVASIVE MONITORING SYSTEM (1666 KENNEDY CAUSEWAY #400 in MIAMI, FL; small business)
$99,624 with Army for Other Medical -- Operational Systems Development (R&D). Taking place in TX. Signed on 2006-01-04. Completion date: 2006-07-31.
MS MIAMI INTERNATIONAL SOFTWAR (1440 JOHN F KENNEDY CSWY, in MIAMI BEACH, FL; small business)
$36,603 with Department of Defense for ADP Software. Taking place in VA. Signed on 2005-09-13. Completion date: 2006-09-22.
LAMBERT BROS INC (1886 B 79THST ST CSWY in MIAMI, FL; small business) 3 employees, $150000 revenue.
$8,000 with United States Coast Guard (disused code: now 7008) for Maintenance, Repair or Alteration of Real Property -- Other Non-Building Facilities. Signed on 2002-07-15. Completion date: 2002-07-15.
Top industries in this zip code by the number of employees in 2005:
Health Care and Social Assistance: Nursing Care Facilities (100-249 employees: 4 establishments, 5-9 employees: 1 establishment)
2006 - 2018 National Fire Incident Reporting System (NFIRS) incidents
Based on the data from the years 2006 - 2018 the average number of fire incidents per year is 39. The highest number of fire incidents - 63 took place in 2015, and the least - 0 in 2007. The data has a growing trend.
When looking into fire subcategories, the most incidents belonged to: Structure Fires (40.2%), and Outside Fires (37.6%).
Fire incident types reported to NFIRS in Zip Code 33141


 Nearest zip codes: 33154, 33140, 33138, 33181, 33137, 33161.


 Based on the data from the years 2006 - 2018 the average number of fire incidents per year is 39. The highest number of fire incidents - 63 took place in 2015, and the least - 0 in 2007. The data has a growing trend.
 When looking into fire subcategories, the most incidents belonged to: Structure Fires (40.2%), and Outside Fires (37.6%).