Estimated zip code population in 2022: 20,343 Zip code population in 2010: 21,210 Zip code population in 2000: 20,240
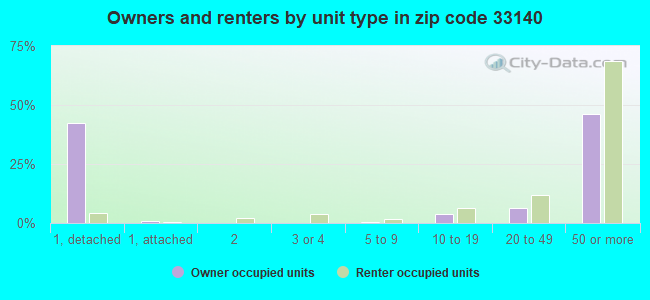
Houses and condos: 16,851 Renter-occupied apartments: 3,873
% of renters here:
43%
State:
33%
March 2022 cost of living index in zip code 33140: 109.7 (more than average, U.S. average is 100)
Land area: 3.0 sq. mi. Water area: 4.2 sq. mi.
Population density: 6,691 people per square mile
(high).
OSM Map
General Map
Google Map
MSN Map
OSM Map
General Map
Google Map
MSN Map
OSM Map
General Map
Google Map
MSN Map
OSM Map
General Map
Google Map
MSN Map
Please wait while loading the map...
Real estate property taxes paid for housing units in 2022:
This zip code:
0.7% ($7,184)
Florida:
0.7% ($2,529)
Median real estate property taxes paid for housing units with mortgages in 2022: $7,554 (0.6%) Median real estate property taxes paid for housing units with no mortgage in 2022: $6,668 (0.8%)
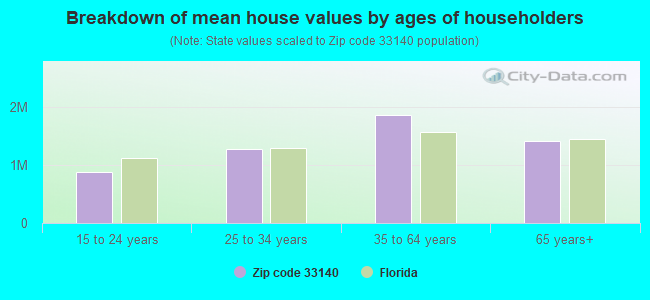
Estimated median house/condo value in 2022: $1,015,159
33140:
$1,015,159
Florida:
$354,100
According to our research of Florida and other state lists, there were 6 registered sex offenders living in 33140 zip code as of April 27, 2024. The ratio of all residents to sex offenders in zip code 33140 is 3,757 to 1. The ratio of registered sex offenders to all residents in this zip code is much lower than the state average.
Median resident age:
This zip code:
41.7 years
Florida median age:
42.7 years
Average household size:
This zip code:
2.2 people
Florida:
2.5 people
Averages for the 2020 tax year for zip code 33140, filed in 2021:
Average Adjusted Gross Income (AGI) in 2020: $558,059 (Individual Income Tax Returns)
Here:
$558,059
State:
$82,200
Salary/wage: $194,428 (reported on 66.6% of returns)
Here:
$194,428
State:
$58,347
(% of AGI for various income ranges: 1128.1% for AGIs below $25k, 3914.7% for AGIs $25k-50k, 7127.2% for AGIs $50k-75k, 10862.6% for AGIs $75k-100k, 20386.8% for AGIs $100k-200k, 245300.0% for AGIs over 200k)
Taxable interest for individuals: $48,543 (reported on 44.4% of returns)
This zip code:
$48,543
Florida:
$4,272
(% of AGI for various income ranges: 62.3% for AGIs below $25k, 136.0% for AGIs $25k-50k, 234.7% for AGIs $50k-75k, 456.0% for AGIs $75k-100k, 908.3% for AGIs $100k-200k, 49080.0% for AGIs over 200k)
Ordinary dividends: $79,587 (reported on 38.1% of returns)
Here:
$79,587
State:
$15,863
(% of AGI for various income ranges: 115.3% for AGIs below $25k, 204.6% for AGIs $25k-50k, 471.6% for AGIs $50k-75k, 865.1% for AGIs $75k-100k, 1488.6% for AGIs $100k-200k, 68096.5% for AGIs over 200k)
Net capital gain/loss in AGI: +$603,133 (reported on 40.3% of returns)
Here:
+$603,133
State:
+$62,983
(% of AGI for various income ranges: 87.3% for AGIs below $25k, 131.9% for AGIs $25k-50k, 466.9% for AGIs $50k-75k, 997.7% for AGIs $75k-100k, 2696.3% for AGIs $100k-200k, 577078.2% for AGIs over 200k)
Profit/loss from business: +$46,329 (reported on 30.7% of returns)
Here:
+$46,329
State:
+$9,719
(% of AGI for various income ranges: 456.0% for AGIs below $25k, 412.1% for AGIs $25k-50k, 716.0% for AGIs $50k-75k, 1001.1% for AGIs $75k-100k, 1526.5% for AGIs $100k-200k, 27094.0% for AGIs over 200k)
Taxable individual retirement arrangement distribution: $48,225 (reported on 7.5% of returns)
33140:
$48,225
Florida:
$24,823
(% of AGI for various income ranges: 56.4% for AGIs below $25k, 100.1% for AGIs $25k-50k, 178.4% for AGIs $50k-75k, 546.9% for AGIs $75k-100k, 982.4% for AGIs $100k-200k, 5936.0% for AGIs over 200k)
Self-employed (Keogh) retirement plans: $43,965 (reported on 1.8% of returns)
33140:
$43,965
Florida:
$29,694
(% of AGI for various income ranges: 103.8% for AGIs $100k-200k, 1705.0% for AGIs over 200k)
Total itemized deductions: $165,193 (reported on 21.2% of returns)
Here:
$165,193
State:
$45,393
(% of AGI for various income ranges: 137.5% for AGIs below $25k, 343.4% for AGIs $25k-50k, 716.2% for AGIs $50k-75k, 1052.6% for AGIs $75k-100k, 2217.9% for AGIs $100k-200k, 77433.5% for AGIs over 200k)
Charity contributions: $112,870 (reported on 18.2% of returns)
Here:
$112,870
State:
$20,178
(% of AGI for various income ranges: 8.7% for AGIs below $25k, 31.4% for AGIs $25k-50k, 92.6% for AGIs $50k-75k, 124.9% for AGIs $75k-100k, 472.2% for AGIs $100k-200k, 48283.5% for AGIs over 200k)
Taxes paid: $9,377 (reported on 21.0% of returns)
33140:
$9,377
State:
$6,967
(% of AGI for various income ranges: 29.4% for AGIs below $25k, 91.8% for AGIs $25k-50k, 171.4% for AGIs $50k-75k, 245.4% for AGIs $75k-100k, 504.3% for AGIs $100k-200k, 3142.0% for AGIs over 200k)
Earned income credit: $1,628 (reported on 11.3% of returns)
Here:
$1,628
State:
$2,306
(% of AGI for various income ranges: 86.6% for AGIs below $25k, 45.5% for AGIs $25k-50k)
Percentage of individuals using paid preparers for their 2020 taxes: 89.3%
Here:
89%
State:
92%
(% for various income ranges: 86.1% for AGIs below $25k, 90.2% for AGIs $25k-50k, 89.9% for AGIs $50k-75k, 88.7% for AGIs $75k-100k, 89.9% for AGIs $100k-200k, 92.3% for AGIs over 200k)
Averages for the 2012 tax year for zip code 33140, filed in 2013:
Average Adjusted Gross Income (AGI) in 2012: $224,952 (Individual Income Tax Returns)
Here:
$224,952
State:
$60,316
Salary/wage: $113,294 (reported on 71.0% of returns)
Here:
$113,294
State:
$45,277
(% of AGI for various income ranges: 64.3% for AGIs below $25k, 76.3% for AGIs $25k-50k, 71.3% for AGIs $50k-75k, 68.2% for AGIs $75k-100k, 63.7% for AGIs $100k-200k, 28.7% for AGIs over 200k)
Taxable interest for individuals: $22,766 (reported on 41.8% of returns)
This zip code:
$22,766
Florida:
$3,587
(% of AGI for various income ranges: 4.3% for AGIs below $25k, 2.3% for AGIs $25k-50k, 2.9% for AGIs $50k-75k, 2.7% for AGIs $75k-100k, 2.7% for AGIs $100k-200k, 4.5% for AGIs over 200k)
Ordinary dividends: $37,230 (reported on 29.5% of returns)
Here:
$37,230
State:
$12,831
(% of AGI for various income ranges: 6.1% for AGIs below $25k, 2.9% for AGIs $25k-50k, 3.2% for AGIs $50k-75k, 4.2% for AGIs $75k-100k, 4.0% for AGIs $100k-200k, 5.1% for AGIs over 200k)
Net capital gain/loss in AGI: +$289,145 (reported on 29.3% of returns)
Here:
+$289,145
State:
+$33,493
(% of AGI for various income ranges: 0.1% for AGIs below $25k, 0.8% for AGIs $25k-50k, 1.2% for AGIs $50k-75k, 2.1% for AGIs $75k-100k, 4.0% for AGIs $100k-200k, 45.4% for AGIs over 200k)
Profit/loss from business: +$29,768 (reported on 26.6% of returns)
Here:
+$29,768
State:
+$10,012
(% of AGI for various income ranges: 18.1% for AGIs below $25k, 6.6% for AGIs $25k-50k, 5.7% for AGIs $50k-75k, 4.9% for AGIs $75k-100k, 4.6% for AGIs $100k-200k, 2.8% for AGIs over 200k)
Taxable individual retirement arrangement distribution: $47,975 (reported on 9.1% of returns)
33140:
$47,975
Florida:
$21,544
(% of AGI for various income ranges: 3.1% for AGIs below $25k, 1.8% for AGIs $25k-50k, 2.9% for AGIs $50k-75k, 2.6% for AGIs $75k-100k, 3.9% for AGIs $100k-200k, 1.7% for AGIs over 200k)
Self-employment retirement plans: $28,623 (reported on 1.2% of returns)
33140:
$28,623
Florida:
$20,611
(% of AGI for various income ranges: 0.3% for AGIs $25k-50k, 0.4% for AGIs $100k-200k, 0.1% for AGIs over 200k)
Total itemized deductions: $67,918 (13% of AGI, reported on 37.1% of returns)
Here:
$67,918
State:
$25,533
Here:
12.9% of AGI
State:
18.0% of AGI
(% of AGI for various income ranges: 16.0% for AGIs below $25k, 14.1% for AGIs $25k-50k, 14.7% for AGIs $50k-75k, 15.4% for AGIs $75k-100k, 15.1% for AGIs $100k-200k, 10.4% for AGIs over 200k)
Charity contributions: $25,508 (reported on 30.4% of returns)
Here:
$25,508
State:
$5,698
(% of AGI for various income ranges: 1.0% for AGIs below $25k, 1.2% for AGIs $25k-50k, 1.5% for AGIs $50k-75k, 1.7% for AGIs $75k-100k, 2.1% for AGIs $100k-200k, 3.8% for AGIs over 200k)
Taxes paid: $21,976 (reported on 35.9% of returns)
33140:
$21,976
State:
$6,203
(% of AGI for various income ranges: 4.1% for AGIs below $25k, 3.0% for AGIs $25k-50k, 3.6% for AGIs $50k-75k, 4.0% for AGIs $75k-100k, 4.4% for AGIs $100k-200k, 3.4% for AGIs over 200k)
Earned income credit: $1,674 (reported on 13.6% of returns)
Here:
$1,674
State:
$2,372
(% of AGI for various income ranges: 4.4% for AGIs below $25k, 0.5% for AGIs $25k-50k)
Percentage of individuals using paid preparers for their 2012 taxes: 71.0%
Here:
71%
State:
54%
(% for various income ranges: 65.0% for AGIs below $25k, 65.5% for AGIs $25k-50k, 69.8% for AGIs $50k-75k, 74.3% for AGIs $75k-100k, 78.2% for AGIs $100k-200k, 88.1% for AGIs over 200k)
Averages for the 2004 tax year for zip code 33140, filed in 2005:
Average Adjusted Gross Income (AGI) in 2004: $123,280 (Individual Income Tax Returns)
Here:
$123,280
State:
$50,523
Salary/wage: $75,738 (reported on 69.6% of returns)
Here:
$75,738
State:
$39,563
(% of AGI for various income ranges: 69.1% for AGIs $10k-25k, 74.8% for AGIs $25k-50k, 69.3% for AGIs $50k-75k, 64.8% for AGIs $75k-100k, 33.7% for AGIs over 100k)
Taxable interest for individuals: $9,593 (reported on 55.1% of returns)
This zip code:
$9,593
Florida:
$3,211
(% of AGI for various income ranges: 7.1% for AGIs $10k-25k, 4.5% for AGIs $25k-50k, 4.6% for AGIs $50k-75k, 4.9% for AGIs $75k-100k, 3.6% for AGIs over 100k)
Taxable dividends: $11,337 (reported on 35.1% of returns)
Here:
$11,337
State:
$6,129
(% of AGI for various income ranges: 3.8% for AGIs $10k-25k, 2.6% for AGIs $25k-50k, 3.2% for AGIs $50k-75k, 3.8% for AGIs $75k-100k, 2.9% for AGIs over 100k)
Net capital gain/loss: +$82,408 (reported on 35.6% of returns)
Here:
+$82,408
State:
+$27,205
(% of AGI for various income ranges: 0.7% for AGIs $10k-25k, 1.8% for AGIs $25k-50k, 2.2% for AGIs $50k-75k, 2.7% for AGIs $75k-100k, 27.1% for AGIs over 100k)
Profit/loss from business: +$23,375 (reported on 23.9% of returns)
Here:
+$23,375
State:
+$10,634
(% of AGI for various income ranges: 10.7% for AGIs $10k-25k, 5.7% for AGIs $25k-50k, 5.8% for AGIs $50k-75k, 5.8% for AGIs $75k-100k, 3.8% for AGIs over 100k)
IRA payment deduction: $3,563 (reported on 4.0% of returns)
33140:
$3,563
Florida:
$3,082
(% of AGI for various income ranges: 0.3% for AGIs $10k-25k, 0.3% for AGIs $25k-50k, 0.3% for AGIs $50k-75k, 0.3% for AGIs $75k-100k, 0.1% for AGIs over 100k)
Self-employed pension: $18,550 (reported on 1.4% of returns)
Here:
$18,550
Florida:
$15,857
(% of AGI for various income ranges: 0.2% for AGIs $50k-75k, 0.4% for AGIs $75k-100k, 0.2% for AGIs over 100k)
Total itemized deductions: $35,082 (15% of AGI, reported on 44.7% of returns)
Here:
$35,082
State:
$20,370
Here:
14.5% of AGI
State:
20.7% of AGI
(% of AGI for various income ranges: 21.8% for AGIs $10k-25k, 21.2% for AGIs $25k-50k, 20.5% for AGIs $50k-75k, 20.5% for AGIs $75k-100k, 10.0% for AGIs over 100k)
Charity contributions deductions: $11,213 (4% of AGI, reported on 38.2% of returns)
Here:
$11,213
State:
$4,064
Here:
4.2% of AGI
State:
3.8% of AGI
(% of AGI for various income ranges: 1.6% for AGIs $10k-25k, 1.9% for AGIs $25k-50k, 2.2% for AGIs $50k-75k, 2.7% for AGIs $75k-100k, 3.6% for AGIs over 100k)
Total tax: $38,691 (reported on 79.1% of returns)
33140:
$38,691
State:
$9,431
(% of AGI for various income ranges: 4.7% for AGIs $10k-25k, 7.9% for AGIs $25k-50k, 11.1% for AGIs $50k-75k, 12.8% for AGIs $75k-100k, 26.7% for AGIs over 100k)
Earned income credit: $1,170 (reported on 10.7% of returns)
Here:
$1,170
State:
$1,808
Percentage of individuals using paid preparers for their 2004 taxes: 75.2%
Here:
75%
State:
60%
(% for various income ranges: 73.6% for AGIs below $10k, 72.7% for AGIs $10k-25k, 70.7% for AGIs $25k-50k, 72.2% for AGIs $50k-75k, 77.7% for AGIs $75k-100k, 84.1% for AGIs over 100k)
Likely homosexual households (counted as self-reported same-sex unmarried-partner households)
Lesbian couples: 0.0% of all households
Gay men: 0.9% of all households
Household received Food Stamps/SNAP in the past 12 months: 638 Household did not receive Food Stamps/SNAP in the past 12 months: 8,457
Women who had a birth in the past 12 months: 339 (308 now married, 41 unmarried) Women who did not have a birth in the past 12 months: 3,947 (1,771 now married, 2,176 unmarried)
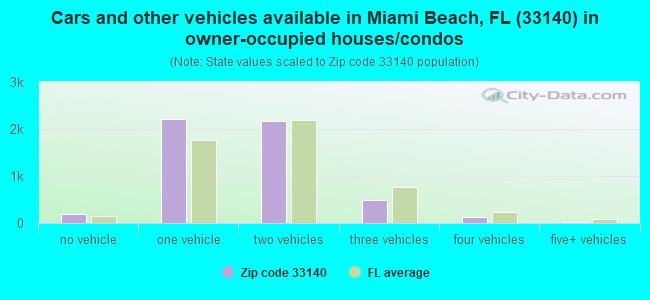
Housing units in zip code 33140 with a mortgage: 2,357 (364 second mortgage, 50 home equity loan, 322 both second mortgage and home equity loan) Houses without a mortgage: 76
Median monthly owner costs for units with a mortgage: $3,987 Median monthly owner costs for units without a mortgage: $1,523
Residents with income below the poverty level in 2022:
This zip code:
8.0%
Whole state:
12.7%
Residents with income below 50% of the poverty level in 2022:
This zip code:
3.4%
Whole state:
6.6%
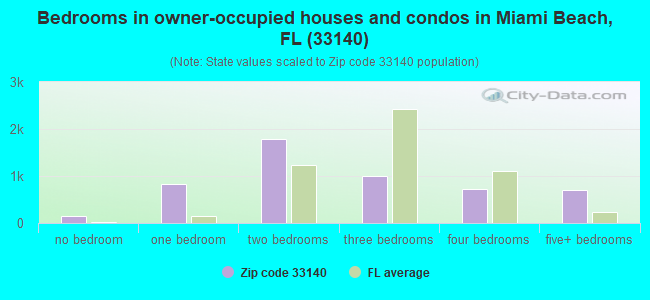
Median number of rooms in houses and condos:
Here:
5.0
State:
5.9
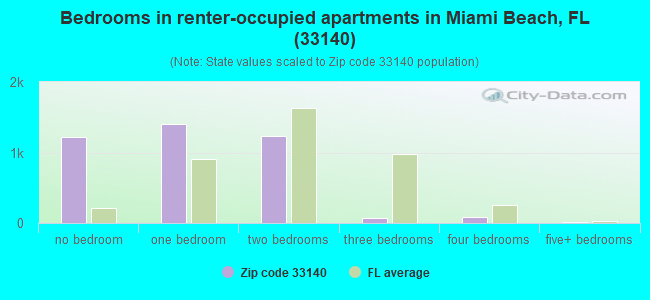
Median number of rooms in apartments:
Here:
2.8
State:
4.2
Notable locations in this zip code not listed on our city pages
Notable locations in zip code 33140: La Gorce Country Club (A), Miami Municipal Golf Course (B), Bayshore Golf Course (C), Young President's Club Day Care Center (D), Scott Rakow Youth Center (E), Mount Sinai Satellite After School Center (F), Miami Beach Methodist Church Care Center (G), J Ingraham Early Childhood Development Center (H), Casa Dei Bambini Day Care Center (I), City of Miami Beach Fire Rescue Department Station 2 (J), City of Miami Beach Fire Rescue Department Station 3 (K), Michael Ann Russell Jewish Community Center (L). Display/hide their locations on the map
Parks in zip code 33140 include: Indian Beach Park (1), Fisher Park (2), Muss Park (3), Pine Tree Park (4), Miami Beach Recreational Youth Center (5), 53rd Street Park (6), 36th Street Park (7), Polo Park (8). Display/hide their locations on the map
In group quarters: 231 (-1 institutionalized population)
Size of family households: 2,789 2-persons, 1,084 3-persons, 675 4-persons, 375 5-persons, 37 6-persons, 96 7-or-more-persons
Size of nonfamily households: 3,256 1-person, 712 2-persons, 36 4-persons
3,323 married couples with children.
762 single-parent households (178 men, 584 women).
38.0% of residents of 33140 zip code speak English at home.
47.4% of residents speak Spanish at home (71% very well, 15% well, 8% not well, 5% not at all).
10.7% of residents speak other Indo-European language at home (77% very well, 17% well, 5% not well, 1% not at all).
1.2% of residents speak Asian or Pacific Island language at home (76% very well, 17% well, 4% not well, 4% not at all).
2.6% of residents speak other language at home (78% very well, 18% well, 4% not well).
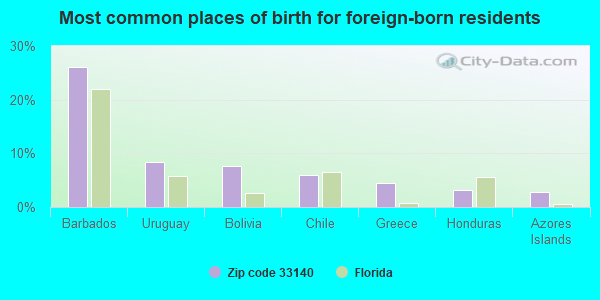
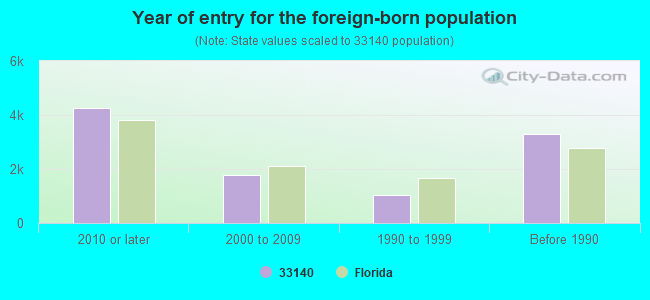
Foreign born population: 9,733 (47.8%) (64.8% of them are naturalized citizens)
Facilities with environmental interests located in this zip code:
NAUTILUS MIDDLE SCHOOL (4301 NORTH MICHIGAN AVE. in MIAMI BEACH, FL)
(National Center for Education Statistics) - STATE ID-6541 Organizations: DADE COUNTY SCHOOL DISTRICT (SCHOOL DISTRICT)
MOUNT SINAI MEDICAL CENTER (4300 ALTON ROAD in MIAMI BEACH, FL)
AIR MINOR (AIRS/AFS) CRITERIA AND HAZARDOUS AIR POLLUTANT INVENTORY (Inventory of air pollution sources) Small Quantity Generators, between 100 kg and 1000 kg of hazardous waste/month (Resource Conservation and Recovery Act (tracking hazardous waste)) - notification Business SIC classification: GENERAL MEDICAL AND SURGICAL HOSPITALS Organizations: BAILEY EDWARD DIRECTOR (CONTACT/OWNER)
Alternative names: MT SINAI MED CTR /GREATER MIAMI, MT. SINAI MEDICAL CENTER
NORTH BEACH ELEMENTARY SCHOOL (4100 PRAIRE AVENUE in MIAMI BEACH, FL)
AIR MONITORING SITE (Airborne pollution emission tracking) Small Quantity Generators, between 100 kg and 1000 kg of hazardous waste/month (Resource Conservation and Recovery Act (tracking hazardous waste)) - notification Organizations: DAVID HALBERG, PRINCIPAL (CONTACT/OWNER)
Alternative names: DADE CO NORTH BEACH ELEMENTARY
MIAMI HEART INSTITUTE (4701 N MERIDIAN AVE in MIAMI BEACH, FL)
Small Quantity Generators, between 100 kg and 1000 kg of hazardous waste/month (Resource Conservation and Recovery Act (tracking hazardous waste)) - notification Organizations: WALLACE JEFF, DIRECTOR ENV SERV (CONTACT/OWNER)
NORMANDY BEACH SUBSTATION (8670 HARDING AVE in MIAMI BEACH, FL)
Small Quantity Generators, between 100 kg and 1000 kg of hazardous waste/month (Resource Conservation and Recovery Act (tracking hazardous waste)) - notification Organizations: FPL (CONTACT/OWNER)
DADE CO NAUTILUS JR HIGH (4301 N MICHIGAN AV in MIAMI BEACH, FL)
Small Quantity Generators, between 100 kg and 1000 kg of hazardous waste/month (Resource Conservation and Recovery Act (tracking hazardous waste)) - notification Organizations: BLITMAN HAROLD, PRINCIPAL (CONTACT/OWNER)
CLEANERAMA CLEANERS (741 W 49 ST in MIAMI, FL)
Small Quantity Generators, between 100 kg and 1000 kg of hazardous waste/month (Resource Conservation and Recovery Act (tracking hazardous waste)) - notification Organizations: ARMANDO HERNANDEZ (CONTACT/OWNER)
Housing units lacking complete plumbing facilities: 1.5% Housing units lacking complete kitchen facilities: 3.4%
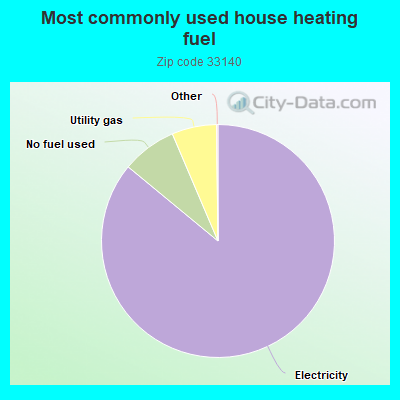
85.9%Electricity
7.6%No fuel used
6.2%Utility gas
Population in 1990: 13,057. Population change in the 1990s: +7,183 (+55.0%).
Place of birth for U.S.-born residents:
This state: 4,975
Northeast: 2,826
Midwest: 1,522
South: 643
West: 226
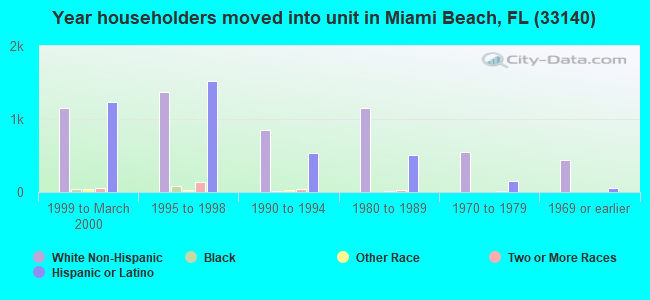
56% of the 33140 zip code residents lived in the same house 5 years ago. Out of people who lived in different houses, 67% lived in this county. Out of people who lived in different counties, 50% lived in Florida.
82% of the 33140 zip code residents lived in the same house 1 year ago. Out of people who lived in different houses, 49% moved from this county. Out of people who lived in different houses, 6% moved from different county within same state. Out of people who lived in different houses, 33% moved from different state. Out of people who lived in different houses, 11% moved from abroad.
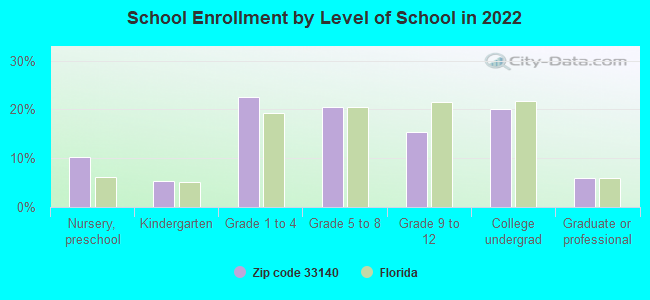
Private vs. public school enrollment:
Students in private schools in grades 1 to 8 (elementary and middle school): 1,018
Here:
56.5%
Florida:
15.8%
Students in private schools in grades 9 to 12 (high school): 295
Here:
46.6%
Florida:
12.9%
Students in private undergraduate colleges: 331
Here:
39.6%
Florida:
23.6%
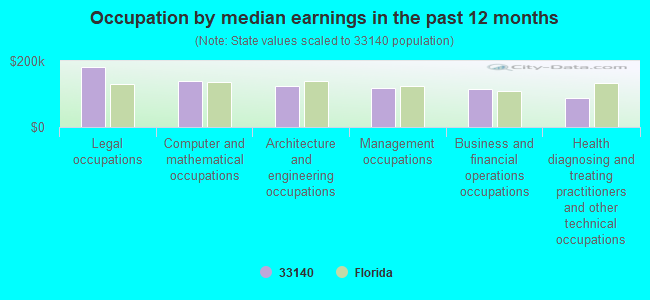
Occupation by median earnings in the past 12 months ($)
182,821Legal occupations
138,780Computer and mathematical occupations
124,456Architecture and engineering occupations
117,703Management occupations
116,324Business and financial operations occupations
87,904Health diagnosing and treating practitioners and other technical occupations
Companies with federal contracts located in this zip code:
AEY INC (925 W 41ST ST STE 306 in MIAMI BEACH, FL; small business) : $8,532,290 in 104 contractsfrom 2004 to 2006
Contracts for Guns, through 30 mm, Engineering -- Applied Research and Exploratory Development (R&D), Optical Sighting and Ranging Equipment, Clothing, Special Purpose, and moreby Department of State, Army, U.S. Special Operations Command, Department of Defense, and others Signed by year:2000: $0; 2001: $0; 2002: $0; 2003: $0; 2004: $1,136,230; 2005: $6,716,297; 2006: $679,763.
Biggest contracts:
$2,369,400 with Department of State for Guns, through 30 mm. Signed on 2005-08-30. Completion date: 2006-02-15.
$844,091 with Department of State for Engineering -- Applied Research and Exploratory Development (R&D). Taking place in LA. Signed on 2005-07-12. Completion date: 2005-09-30.
$716,510 with Army for Optical Sighting and Ranging Equipment. Signed on 2005-09-30. Completion date: 2005-10-31.
$624,978 with Department of State for Clothing, Special Purpose. Signed on 2006-06-08. Completion date: 2006-07-31.
Mark Starr (5161 Collins Avenue #714 in Miami Beach, FL; small business) : $433,476 in 3 contractsfrom 2005 to 2006
$225,269 with Departmental Offices for Personal Services Contracts. Taking place in DC. Signed on 2006-06-06. Completion date: 2010-06-05.
$206,662, same as above.Signed on 2005-06-22. Effective on 2005-06-06. Completion date: 2006-06-05.
$1,545, same as above.Signed on 2005-11-18. Completion date: 2006-06-05.
eden roc a renaissance resort & spa (4525 Collins Ave. in Miami Beach, FL) : $58,486 in 2 contractsfrom 2000 to 2004
$32,486 with Offices, Boards and Divisions (includes Attorney General, Deputy Attorney General, etc.) for Lease or Rental of Facilities -- Conference Space and Facilities. Signed on 2004-07-30. Completion date: 2004-12-08.
$26,000 with Equal Employment Opportunity Commission for Lease or Rental of Facilities -- Conference Space and Facilities. Signed on 2000-03-15. Completion date: 2000-05-15.
Top industries in this zip code by the number of employees in 2005:
Other Services (except Public Administration): Other Similar Organizations (except Business, Professional, Labor, and Political Organizations) (20-49: 2, 10-19: 8, 5-9: 9, 1-4: 13)
2005 - 2018 National Fire Incident Reporting System (NFIRS) incidents
Based on the data from the years 2005 - 2018 the average number of fire incidents per year is 122. The highest number of fire incidents - 165 took place in 2006, and the least - 66 in 2008. The data has a dropping trend.
When looking into fire subcategories, the most incidents belonged to: Structure Fires (58.7%), and Outside Fires (22.0%).
Fire incident types reported to NFIRS in Zip Code 33140

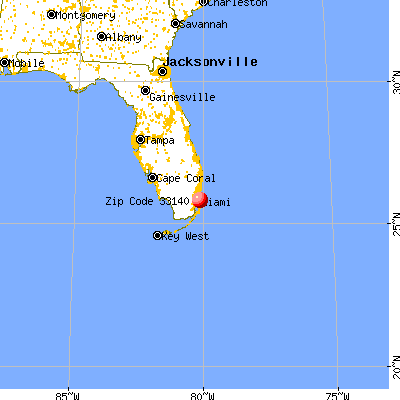


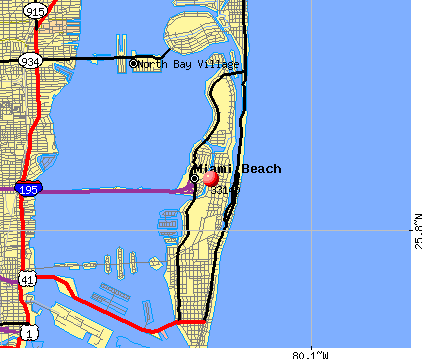 Nearest zip codes: 33141, 33137, 33139, 33138, 33132, 33109.


 Based on the data from the years 2005 - 2018 the average number of fire incidents per year is 122. The highest number of fire incidents - 165 took place in 2006, and the least - 66 in 2008. The data has a dropping trend.
 When looking into fire subcategories, the most incidents belonged to: Structure Fires (58.7%), and Outside Fires (22.0%).