Estimated zip code population in 2022: 36,090 Zip code population in 2010: 38,613 Zip code population in 2000: 38,441
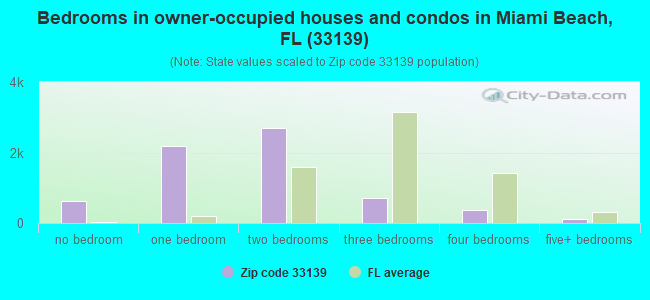
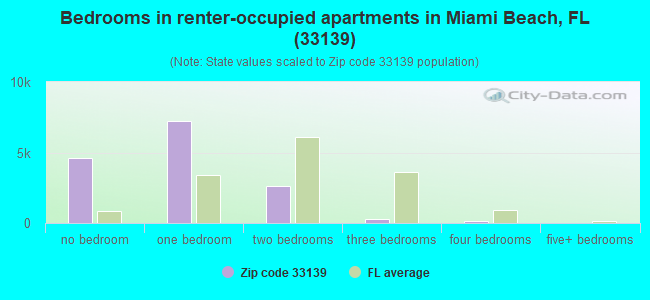
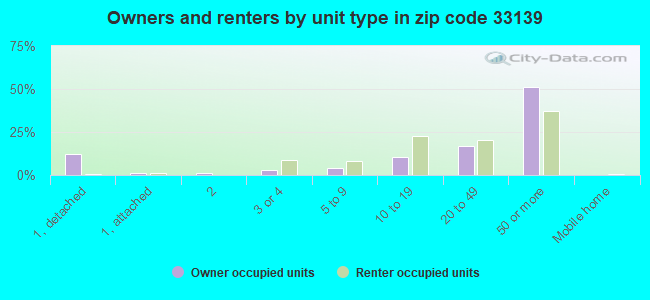
Houses and condos: 31,392 Renter-occupied apartments: 14,417
% of renters here:
68%
State:
33%
March 2022 cost of living index in zip code 33139: 108.1 (more than average, U.S. average is 100)
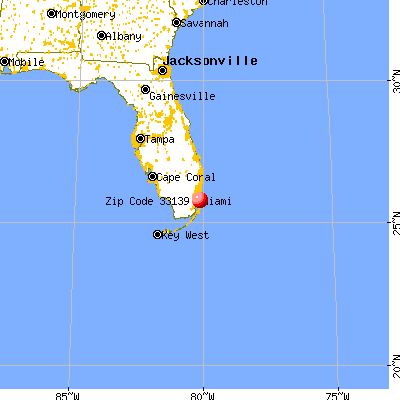
Land area: 2.7 sq. mi. Water area: 3.3 sq. mi.
Population density: 13,415 people per square mile
(very high).
OSM Map
General Map
Google Map
MSN Map
OSM Map
General Map
Google Map
MSN Map
OSM Map
General Map
Google Map
MSN Map
OSM Map
General Map
Google Map
MSN Map
Please wait while loading the map...
Real estate property taxes paid for housing units in 2022:
This zip code:
0.9% ($5,354)
Florida:
0.7% ($2,529)
Median real estate property taxes paid for housing units with mortgages in 2022: $5,825 (1.0%) Median real estate property taxes paid for housing units with no mortgage in 2022: $4,938 (0.9%)
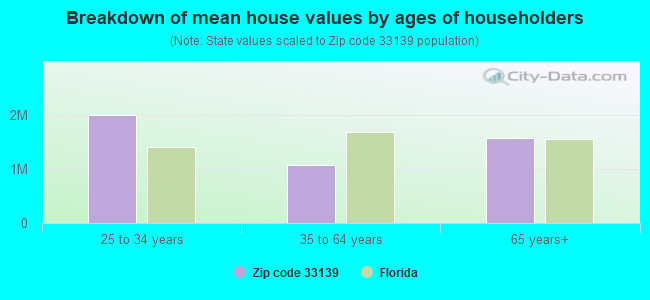
Estimated median house/condo value in 2022: $576,836
33139:
$576,836
Florida:
$354,100
According to our research of Florida and other state lists, there were 8 registered sex offenders living in 33139 zip code as of April 27, 2024. The ratio of all residents to sex offenders in zip code 33139 is 4,822 to 1. The ratio of registered sex offenders to all residents in this zip code is much lower than the state average.
Median resident age:
This zip code:
42.0 years
Florida median age:
42.7 years
Average household size:
This zip code:
1.7 people
Florida:
2.5 people
Averages for the 2020 tax year for zip code 33139, filed in 2021:
Average Adjusted Gross Income (AGI) in 2020: $458,484 (Individual Income Tax Returns)
Here:
$458,484
State:
$82,200
Salary/wage: $157,790 (reported on 72.7% of returns)
Here:
$157,790
State:
$58,347
(% of AGI for various income ranges: 1219.2% for AGIs below $25k, 3740.5% for AGIs $25k-50k, 7253.7% for AGIs $50k-75k, 11066.8% for AGIs $75k-100k, 20822.7% for AGIs $100k-200k, 272998.8% for AGIs over 200k)
Taxable interest for individuals: $28,189 (reported on 32.0% of returns)
This zip code:
$28,189
Florida:
$4,272
(% of AGI for various income ranges: 24.6% for AGIs below $25k, 43.1% for AGIs $25k-50k, 109.2% for AGIs $50k-75k, 183.1% for AGIs $75k-100k, 432.4% for AGIs $100k-200k, 27361.2% for AGIs over 200k)
Ordinary dividends: $61,616 (reported on 27.9% of returns)
Here:
$61,616
State:
$15,863
(% of AGI for various income ranges: 59.6% for AGIs below $25k, 86.6% for AGIs $25k-50k, 279.2% for AGIs $50k-75k, 410.1% for AGIs $75k-100k, 1089.9% for AGIs $100k-200k, 51304.5% for AGIs over 200k)
Net capital gain/loss in AGI: +$582,235 (reported on 30.3% of returns)
Here:
+$582,235
State:
+$62,983
(% of AGI for various income ranges: 78.4% for AGIs below $25k, 116.7% for AGIs $25k-50k, 305.3% for AGIs $50k-75k, 597.8% for AGIs $75k-100k, 1571.2% for AGIs $100k-200k, 561191.7% for AGIs over 200k)
Profit/loss from business: +$26,410 (reported on 34.0% of returns)
Here:
+$26,410
State:
+$9,719
(% of AGI for various income ranges: 307.0% for AGIs below $25k, 348.6% for AGIs $25k-50k, 573.7% for AGIs $50k-75k, 830.0% for AGIs $75k-100k, 1308.3% for AGIs $100k-200k, 20251.5% for AGIs over 200k)
Taxable individual retirement arrangement distribution: $50,990 (reported on 4.8% of returns)
33139:
$50,990
Florida:
$24,823
(% of AGI for various income ranges: 26.5% for AGIs below $25k, 84.1% for AGIs $25k-50k, 149.4% for AGIs $50k-75k, 238.4% for AGIs $75k-100k, 694.9% for AGIs $100k-200k, 5286.3% for AGIs over 200k)
Self-employed (Keogh) retirement plans: $40,423 (reported on 1.6% of returns)
33139:
$40,423
Florida:
$29,694
(% of AGI for various income ranges: 5.9% for AGIs below $25k, 24.7% for AGIs $50k-75k, 103.9% for AGIs $100k-200k, 1791.2% for AGIs over 200k)
Total itemized deductions: $109,845 (reported on 14.4% of returns)
Here:
$109,845
State:
$45,393
(% of AGI for various income ranges: 85.4% for AGIs below $25k, 205.5% for AGIs $25k-50k, 448.8% for AGIs $50k-75k, 756.5% for AGIs $75k-100k, 1400.2% for AGIs $100k-200k, 44705.2% for AGIs over 200k)
Charity contributions: $77,032 (reported on 11.3% of returns)
Here:
$77,032
State:
$20,178
(% of AGI for various income ranges: 2.7% for AGIs below $25k, 20.8% for AGIs $25k-50k, 55.9% for AGIs $50k-75k, 89.6% for AGIs $75k-100k, 244.7% for AGIs $100k-200k, 27168.7% for AGIs over 200k)
Taxes paid: $8,726 (reported on 14.0% of returns)
33139:
$8,726
State:
$6,967
(% of AGI for various income ranges: 17.2% for AGIs below $25k, 56.9% for AGIs $25k-50k, 111.5% for AGIs $50k-75k, 179.6% for AGIs $75k-100k, 373.5% for AGIs $100k-200k, 2352.8% for AGIs over 200k)
Earned income credit: $1,398 (reported on 14.9% of returns)
Here:
$1,398
State:
$2,306
(% of AGI for various income ranges: 75.4% for AGIs below $25k, 30.4% for AGIs $25k-50k)
Percentage of individuals using paid preparers for their 2020 taxes: 89.0%
Here:
89%
State:
92%
(% for various income ranges: 84.7% for AGIs below $25k, 88.9% for AGIs $25k-50k, 91.1% for AGIs $50k-75k, 92.2% for AGIs $75k-100k, 92.1% for AGIs $100k-200k, 93.4% for AGIs over 200k)
Averages for the 2012 tax year for zip code 33139, filed in 2013:
Average Adjusted Gross Income (AGI) in 2012: $176,705 (Individual Income Tax Returns)
Here:
$176,705
State:
$60,316
Salary/wage: $78,903 (reported on 79.6% of returns)
Here:
$78,903
State:
$45,277
(% of AGI for various income ranges: 78.0% for AGIs below $25k, 86.4% for AGIs $25k-50k, 83.4% for AGIs $50k-75k, 78.6% for AGIs $75k-100k, 72.9% for AGIs $100k-200k, 23.2% for AGIs over 200k)
Taxable interest for individuals: $15,438 (reported on 28.7% of returns)
This zip code:
$15,438
Florida:
$3,587
(% of AGI for various income ranges: 1.3% for AGIs below $25k, 1.2% for AGIs $25k-50k, 1.1% for AGIs $50k-75k, 2.2% for AGIs $75k-100k, 1.6% for AGIs $100k-200k, 2.8% for AGIs over 200k)
Ordinary dividends: $48,975 (reported on 19.5% of returns)
Here:
$48,975
State:
$12,831
(% of AGI for various income ranges: 3.1% for AGIs below $25k, 1.6% for AGIs $25k-50k, 1.7% for AGIs $50k-75k, 2.7% for AGIs $75k-100k, 3.4% for AGIs $100k-200k, 6.2% for AGIs over 200k)
Net capital gain/loss in AGI: +$314,059 (reported on 19.5% of returns)
Here:
+$314,059
State:
+$33,493
(% of AGI for various income ranges: 1.1% for AGIs $25k-50k, 0.9% for AGIs $50k-75k, 1.7% for AGIs $75k-100k, 3.2% for AGIs $100k-200k, 43.9% for AGIs over 200k)
Profit/loss from business: +$23,358 (reported on 24.7% of returns)
Here:
+$23,358
State:
+$10,012
(% of AGI for various income ranges: 14.7% for AGIs below $25k, 5.6% for AGIs $25k-50k, 5.6% for AGIs $50k-75k, 4.9% for AGIs $75k-100k, 4.7% for AGIs $100k-200k, 2.4% for AGIs over 200k)
Taxable individual retirement arrangement distribution: $50,982 (reported on 4.7% of returns)
33139:
$50,982
Florida:
$21,544
(% of AGI for various income ranges: 1.2% for AGIs below $25k, 0.8% for AGIs $25k-50k, 1.2% for AGIs $50k-75k, 2.1% for AGIs $75k-100k, 2.5% for AGIs $100k-200k, 1.3% for AGIs over 200k)
Self-employment retirement plans: $30,473 (reported on 1.1% of returns)
33139:
$30,473
Florida:
$20,611
(% of AGI for various income ranges: 0.2% for AGIs below $25k, 0.3% for AGIs $50k-75k, 0.4% for AGIs $100k-200k, 0.2% for AGIs over 200k)
Total itemized deductions: $49,699 (10% of AGI, reported on 30.6% of returns)
Here:
$49,699
State:
$25,533
Here:
10.4% of AGI
State:
18.0% of AGI
(% of AGI for various income ranges: 12.7% for AGIs below $25k, 11.9% for AGIs $25k-50k, 12.3% for AGIs $50k-75k, 13.1% for AGIs $75k-100k, 12.2% for AGIs $100k-200k, 7.6% for AGIs over 200k)
Charity contributions: $15,530 (reported on 22.9% of returns)
Here:
$15,530
State:
$5,698
(% of AGI for various income ranges: 0.6% for AGIs below $25k, 1.0% for AGIs $25k-50k, 1.1% for AGIs $50k-75k, 1.1% for AGIs $75k-100k, 1.3% for AGIs $100k-200k, 2.3% for AGIs over 200k)
Taxes paid: $17,913 (reported on 28.9% of returns)
33139:
$17,913
State:
$6,203
(% of AGI for various income ranges: 2.5% for AGIs below $25k, 1.9% for AGIs $25k-50k, 2.6% for AGIs $50k-75k, 4.3% for AGIs $75k-100k, 3.8% for AGIs $100k-200k, 2.9% for AGIs over 200k)
Earned income credit: $1,394 (reported on 15.0% of returns)
Here:
$1,394
State:
$2,372
(% of AGI for various income ranges: 3.7% for AGIs below $25k, 0.3% for AGIs $25k-50k)
Percentage of individuals using paid preparers for their 2012 taxes: 63.5%
Here:
64%
State:
54%
(% for various income ranges: 60.1% for AGIs below $25k, 58.9% for AGIs $25k-50k, 62.2% for AGIs $50k-75k, 63.3% for AGIs $75k-100k, 69.3% for AGIs $100k-200k, 88.0% for AGIs over 200k)
Averages for the 2004 tax year for zip code 33139, filed in 2005:
Average Adjusted Gross Income (AGI) in 2004: $89,607 (Individual Income Tax Returns)
Here:
$89,607
State:
$50,523
Salary/wage: $52,304 (reported on 81.0% of returns)
Here:
$52,304
State:
$39,563
(% of AGI for various income ranges: 83.0% for AGIs $10k-25k, 87.7% for AGIs $25k-50k, 83.7% for AGIs $50k-75k, 78.5% for AGIs $75k-100k, 30.9% for AGIs over 100k)
Taxable interest for individuals: $8,260 (reported on 35.5% of returns)
This zip code:
$8,260
Florida:
$3,211
(% of AGI for various income ranges: 2.4% for AGIs $10k-25k, 1.9% for AGIs $25k-50k, 2.2% for AGIs $50k-75k, 2.2% for AGIs $75k-100k, 3.4% for AGIs over 100k)
Taxable dividends: $9,961 (reported on 20.1% of returns)
Here:
$9,961
State:
$6,129
(% of AGI for various income ranges: 1.4% for AGIs $10k-25k, 1.4% for AGIs $25k-50k, 2.1% for AGIs $50k-75k, 2.0% for AGIs $75k-100k, 2.2% for AGIs over 100k)
Net capital gain/loss: +$88,207 (reported on 20.6% of returns)
Here:
+$88,207
State:
+$27,205
(% of AGI for various income ranges: 0.3% for AGIs $10k-25k, 1.0% for AGIs $25k-50k, 1.7% for AGIs $50k-75k, 4.3% for AGIs $75k-100k, 26.1% for AGIs over 100k)
Profit/loss from business: +$17,014 (reported on 21.8% of returns)
Here:
+$17,014
State:
+$10,634
(% of AGI for various income ranges: 7.9% for AGIs $10k-25k, 3.6% for AGIs $25k-50k, 4.6% for AGIs $50k-75k, 5.6% for AGIs $75k-100k, 3.4% for AGIs over 100k)
IRA payment deduction: $2,945 (reported on 2.6% of returns)
33139:
$2,945
Florida:
$3,082
(% of AGI for various income ranges: 0.2% for AGIs $10k-25k, 0.2% for AGIs $25k-50k, 0.2% for AGIs $50k-75k, 0.2% for AGIs $75k-100k, 0.0% for AGIs over 100k)
Self-employed pension: $20,087 (reported on 1.0% of returns)
Here:
$20,087
Florida:
$15,857
(% of AGI for various income ranges: 0.1% for AGIs $25k-50k, 0.2% for AGIs $50k-75k, 0.4% for AGIs $75k-100k, 0.2% for AGIs over 100k)
Total itemized deductions: $29,740 (14% of AGI, reported on 34.1% of returns)
Here:
$29,740
State:
$20,370
Here:
14.4% of AGI
State:
20.7% of AGI
(% of AGI for various income ranges: 12.8% for AGIs $10k-25k, 16.7% for AGIs $25k-50k, 16.8% for AGIs $50k-75k, 16.2% for AGIs $75k-100k, 9.0% for AGIs over 100k)
Charity contributions deductions: $7,209 (3% of AGI, reported on 27.3% of returns)
Here:
$7,209
State:
$4,064
Here:
3.1% of AGI
State:
3.8% of AGI
(% of AGI for various income ranges: 0.9% for AGIs $10k-25k, 1.4% for AGIs $25k-50k, 1.5% for AGIs $50k-75k, 1.5% for AGIs $75k-100k, 2.4% for AGIs over 100k)
Total tax: $23,843 (reported on 79.6% of returns)
33139:
$23,843
State:
$9,431
(% of AGI for various income ranges: 4.9% for AGIs $10k-25k, 8.8% for AGIs $25k-50k, 12.8% for AGIs $50k-75k, 14.9% for AGIs $75k-100k, 24.3% for AGIs over 100k)
Earned income credit: $1,028 (reported on 13.6% of returns)
Here:
$1,028
State:
$1,808
Percentage of individuals using paid preparers for their 2004 taxes: 67.3%
Here:
67%
State:
60%
(% for various income ranges: 67.3% for AGIs below $10k, 67.2% for AGIs $10k-25k, 62.2% for AGIs $25k-50k, 65.7% for AGIs $50k-75k, 67.7% for AGIs $75k-100k, 79.5% for AGIs over 100k)
Likely homosexual households (counted as self-reported same-sex unmarried-partner households)
Lesbian couples: 0.2% of all households
Gay men: 1.4% of all households
Household received Food Stamps/SNAP in the past 12 months: 3,117 Household did not receive Food Stamps/SNAP in the past 12 months: 18,099
Women who had a birth in the past 12 months: 394 (151 now married, 228 unmarried) Women who did not have a birth in the past 12 months: 8,451 (3,440 now married, 5,011 unmarried)
Housing units in zip code 33139 with a mortgage: 3,308 (262 second mortgage, 28 home equity loan, 162 both second mortgage and home equity loan) Houses without a mortgage: 31
Median monthly owner costs for units with a mortgage: $2,804 Median monthly owner costs for units without a mortgage: $1,175
Residents with income below the poverty level in 2022:
This zip code:
17.1%
Whole state:
12.7%
Residents with income below 50% of the poverty level in 2022:
This zip code:
10.7%
Whole state:
6.6%
Median number of rooms in houses and condos:
Here:
3.7
State:
5.9
Median number of rooms in apartments:
Here:
2.6
State:
4.2
Notable locations in this zip code not listed on our city pages
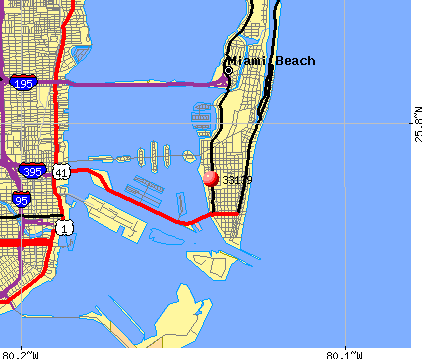
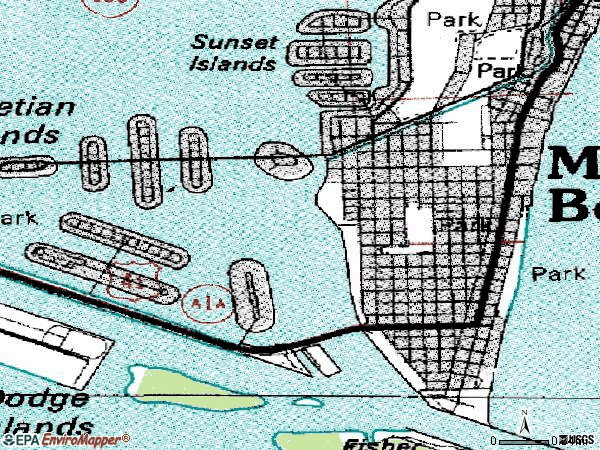
Notable locations in zip code 33139: Reeves Plaza (A), United States Coast Guard Integrated Support Command Miami Beach Wharves (B), 21st Street Recreation Center (C), South Shore Community Center (D), Abel Holtz Stadium (E), Miami Beach Marina (F), Holocaust Memorial (G), South Pointe Fishing Pier (H), Art Deco District (I), Wolfsonian Gallery (J), South Pointe Tower (K), South Shore Library (L), Sunbridge Care and Rehabilitation for South Miami (M), Sanford L Ziff Jewish Museum of Florida (N), Rainbow Intergenerational Day Care Center (O), Rainbow Miami Beach Day Care Center (P), Raindrop Child Care Center (Q), Ocean Front Auditorium (R), Oceanside Extended Care Center (S), Miami Beach Chamber of Commerce (T). Display/hide their locations on the map
Churches in zip code 33139 include: Saint Francis de Sales Church (A), Temple Beth Shalom (B), Miami Beach First Baptist Church (C). Display/hide their locations on the map
Parks in zip code 33139 include: South Beach Park (1), Collins Park (2), Flagler Memorial Monument (3), Flamingo Park (4), Miami Beach Botanical Garden (5), Pace Park (6), Island View Park (7), Washington Park (8), South Pointe Park (9). Display/hide their locations on the map
Tourist attraction (not listed on the city page) : Fragments On Beach Water Sports (1717 Collins Avenue).
2,656 married couples with children.
1,293 single-parent households (486 men, 807 women).
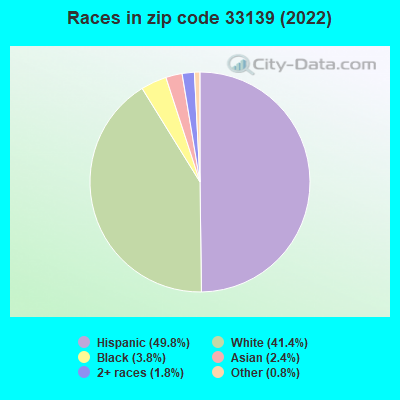
35.4% of residents of 33139 zip code speak English at home.
48.9% of residents speak Spanish at home (47% very well, 17% well, 22% not well, 14% not at all).
13.5% of residents speak other Indo-European language at home (77% very well, 19% well, 4% not well).
1.6% of residents speak Asian or Pacific Island language at home (62% very well, 18% well, 15% not well, 5% not at all).
1.3% of residents speak other language at home (88% very well, 12% well).
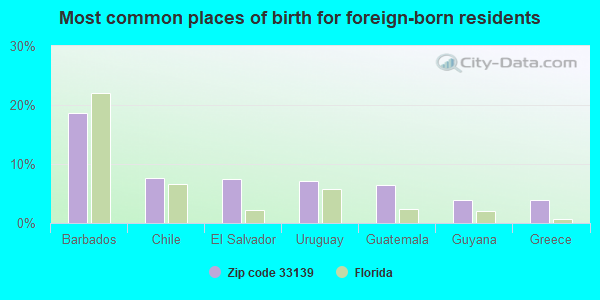
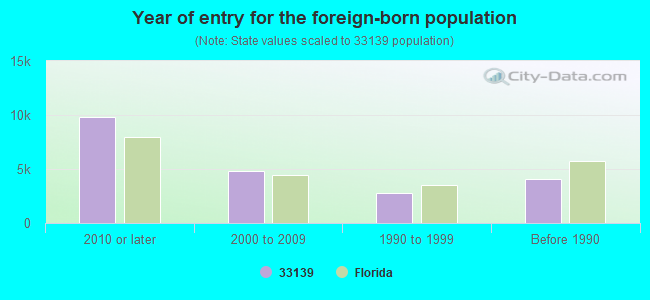
Foreign born population: 20,389 (56.5%) (45.7% of them are naturalized citizens)
Major facilities with environmental interests located in this zip code:
MIAMI BEACH SENIOR HIGH SCHOOL (2231 PRAIRIE AVENUE in MIAMI BEACH, FL)
(Geographic Names Information System) (National Center for Education Statistics) - STATE ID-7201 Small Quantity Generators, between 100 kg and 1000 kg of hazardous waste/month (Resource Conservation and Recovery Act (tracking hazardous waste)) - notification Organizations: FERRER RONALD, PRINCIPAL (CONTACT/OWNER)
, DADE COUNTY SCHOOL DISTRICT (SCHOOL DISTRICT)
Alternative names: DADE CO MIAMI BEACH SR HIGH
SOUTH POINTE ELEMENTARY SCHOOL (1050 4TH STREET in MIAMI BEACH, FL)
(National Center for Education Statistics) - STATE ID-5091 Small Quantity Generators, between 100 kg and 1000 kg of hazardous waste/month (Resource Conservation and Recovery Act (tracking hazardous waste)) - notification Organizations: ARLENE ORTENZO, PRINCIPAL (CONTACT/OWNER)
, DADE COUNTY SCHOOL DISTRICT (SCHOOL DISTRICT)
Alternative names: DADE CO S POINTE ELEM
MIAMI BEACH, CITY OF (140 MACARTHUR CAUSEWAY in MIAMI BEACH, FL)
Small Quantity Generators, between 100 kg and 1000 kg of hazardous waste/month (Resource Conservation and Recovery Act (tracking hazardous waste)) - notification COMMUNITY WATER SYSTEM (SDWIS) - SDWIS-FL4130901 8001, WATER TREATMENT PLANT Organizations: J BEAUCHAMP, SAFETY (CONTACT/OWNER)
LEJEUNE PLAZA CLEANERS INC (1544 ALTON ROAD in MIAMI BEACH, FL)
AIR MINOR (AIRS/AFS) (Resource Conservation and Recovery Act (tracking hazardous waste)) Business SIC classification: DRYCLEANING PLANTS, EXCEPT RUG CLEANING Organizations: JOSE URREA, PRES (CONTACT/OWNER)
Alternative names: L P CLEANERS, LE JEUNE PLAZA DRY CLEANER INCORPORATED
LOEWS CORP. (1601 COLLINS AVE in MIAMI BEACH, FL)
AIR MINOR (AIRS/AFS) (Resource Conservation and Recovery Act (tracking hazardous waste)) Business SIC classification: DRYCLEANING PLANTS, EXCEPT RUG CLEANING Organizations: LOEWS MIAMI BEACH HOTEL (CONTACT/OWNER)
Alternative names: LOEWS MIAMI BEACH HOTEL
SHELL STATION #136599 IN MIAMI (1698 ALTON ROAD in MIAMI BEACH, FL)
National Pollutant Discharge Elimination System NON-MAJOR (Tracking pollutant discharge elimination systems) - permit Business SIC classification: GASOLINE SERVICE STATIONS Organizations: CRAIG HURST (CONTACT/OWNER)
M & M CLEANERS INC (1201 20TH STREET in MIAMI BEACH, FL)
AIR MINOR (AIRS/AFS) Small Quantity Generators, between 100 kg and 1000 kg of hazardous waste/month (Resource Conservation and Recovery Act (tracking hazardous waste)) - notification Business SIC classification: DRYCLEANING PLANTS, EXCEPT RUG CLEANING Organizations: M GENE PELOSI, GENERAL MANAGER (CONTACT/OWNER)
Alternative names: MARKS QUALITY CLEANERS & LAUNDRY
AMATO ONE HOUR CLEANING CORPORATION (844 ALTON RD in MIAMI BEACH, FL)
AIR MINOR (AIRS/AFS) Small Quantity Generators, between 100 kg and 1000 kg of hazardous waste/month (Resource Conservation and Recovery Act (tracking hazardous waste)) - notification Business SIC classification: DRYCLEANING PLANTS, EXCEPT RUG CLEANING Organizations: IGNAZIO AMATO (CONTACT/OWNER)
Alternative names: AMATO ONE HOUR CLEANERS CORP
LAOMAN'S INC (1611 ALTON ROAD in MIAMI BEACH, FL)
AIR MINOR (AIRS/AFS) Small Quantity Generators, between 100 kg and 1000 kg of hazardous waste/month (Resource Conservation and Recovery Act (tracking hazardous waste)) - notification Business SIC classification: DRYCLEANING PLANTS, EXCEPT RUG CLEANING Organizations: SARDINAS LISETTE (CONTACT/OWNER)
Alternative names: LAOMANS DRY CLEANERS
LAUNDRY ASSOCIATES INC (1515 ALTON ROAD in MIAMI BEACH, FL)
AIR MINOR (AIRS/AFS) Small Quantity Generators, between 100 kg and 1000 kg of hazardous waste/month (Resource Conservation and Recovery Act (tracking hazardous waste)) - notification Business SIC classification: DRYCLEANING PLANTS, EXCEPT RUG CLEANING Organizations: GEOFFREY WONG, PRES (CONTACT/OWNER)
Alternative names: DRYCLEAN USA
1 HOUR VALENTONE CLEANERS (1361 WASHINGTON AVE in MIAMI BEACH, FL)
(Resource Conservation and Recovery Act (tracking hazardous waste)) Organizations: ALBERTO ESPINO (CONTACT/OWNER)
MIAMI BEACH PUBLIC WORKS, CITY OF (451 DADE BLVD in MIAMI BEACH, FL)
(Resource Conservation and Recovery Act (tracking hazardous waste)) Organizations: DAN SHEPHERD, SUPER (CONTACT/OWNER)
MORAN CROWLEY ENVIRONMENT (120 MACARTHUR CAUSEWAY in MIAMI BEACH, FL)
(Resource Conservation and Recovery Act (tracking hazardous waste)) Organizations: KEVIN HORVATH, TERMINAL MANAGER (CONTACT/OWNER)
Housing units lacking complete plumbing facilities: 1.1% Housing units lacking complete kitchen facilities: 1.7%
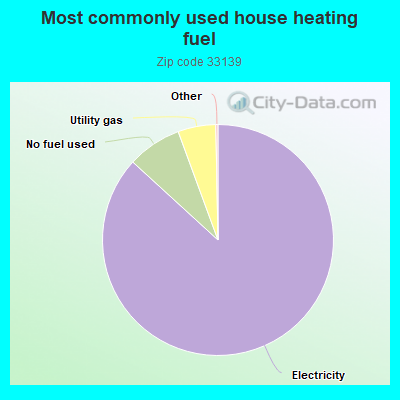
86.8%Electricity
7.6%No fuel used
5.3%Utility gas
Population in 1990: 48,971.
Place of birth for U.S.-born residents:
This state: 6,092
Northeast: 4,346
Midwest: 1,962
South: 1,875
West: 1,117
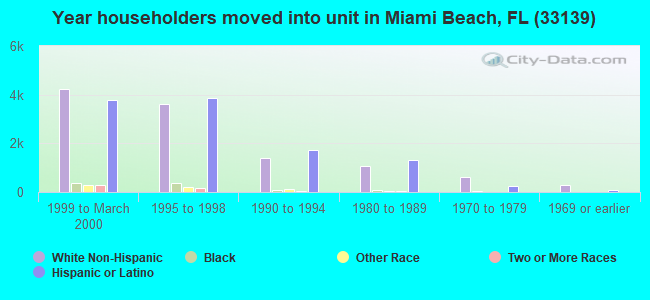
42% of the 33139 zip code residents lived in the same house 5 years ago. Out of people who lived in different houses, 62% lived in this county. Out of people who lived in different counties, 50% lived in Florida.
76% of the 33139 zip code residents lived in the same house 1 year ago. Out of people who lived in different houses, 52% moved from this county. Out of people who lived in different houses, 6% moved from different county within same state. Out of people who lived in different houses, 22% moved from different state. Out of people who lived in different houses, 18% moved from abroad.
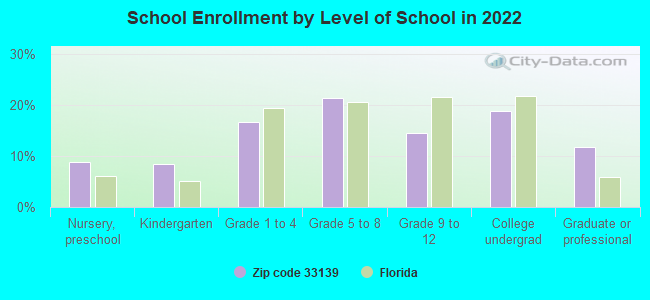
Private vs. public school enrollment:
Students in private schools in grades 1 to 8 (elementary and middle school): 338
Here:
17.7%
Florida:
15.8%
Students in private schools in grades 9 to 12 (high school): 81
Here:
11.1%
Florida:
12.9%
Students in private undergraduate colleges: 250
Here:
26.3%
Florida:
23.6%
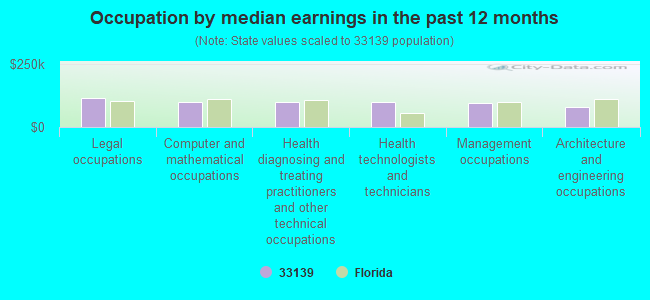
Occupation by median earnings in the past 12 months ($)
117,216Legal occupations
101,692Computer and mathematical occupations
100,001Health diagnosing and treating practitioners and other technical occupations
99,949Health technologists and technicians
94,711Management occupations
81,261Architecture and engineering occupations
Companies with federal contracts located in this zip code:
QUINT WELLINGTON REDWOOD ACADE (407 LINCOLN RD STE 11A in MIAMI BEACH, FL) : $97,400 in 5 contractsfrom 2004 to 2005
Contracts for ADP Systems Development Services by Navy Signed by year:2000: $0; 2001: $0; 2002: $0; 2003: $0; 2004: $23,000; 2005: $74,400; 2006: $0.
Biggest contracts:
$35,000 with Navy for ADP Systems Development Services. Signed on 2005-04-19. Completion date: 2005-04-06.
$22,400, same as above.Signed on 2005-09-12. Completion date: 2005-10-07.
$17,000, same as above.Signed on 2005-01-27. Completion date: 2005-12-02.
$11,500, same as above.Signed on 2004-12-15. Completion date: 2005-12-02.
V P GROUP INC (2301 COLLONS AVENUE, A-1231 in Miami Beach, FL) : $54,896 in 2 contractsin 2004
$27,448 with Department of State for Paints, Dopes, Varnishes, and Related Products. Signed on 2004-05-21. Completion date: 2004-07-22.
$27,448, same as above.Signed on 2004-06-21. Completion date: 2004-07-21.
ROYAL PALM CROWNE PLAZA RESORT (1545 COLLINS AVE in MIAMI BEACH, FL; small business) : $12,870 in 3 contractsfrom 2003 to 2005
$6,156 with Army for Lodging - Hotel/Motel. Signed on 2003-07-17. Completion date: 2003-07-11.
$5,644 with Bureau of Alcohol, Tobacco, Firearms and Explosives for Other Education and Training Services. Signed on 2004-12-05. Effective on 2004-12-02. Completion date: 2004-12-18.
$1,070 with Army for Lodging - Hotel/Motel. Signed on 2005-02-17. Completion date: 2005-07-15.
CLISHAMS DANNY CAN AM AIRSHOW (1521 ALTON RD PMB 296 in MIAMI BEACH, FL; small business) : $8,860 in 2 contractsfrom 2004 to 2005
$5,360 with Navy for Other Professional Services. Signed on 2004-10-01. Completion date: 2005-01-24.
$3,500 with Air Force for Other Social Services. Taking place in MD. Signed on 2005-05-18. Completion date: 2005-04-22.
Top industries in this zip code by the number of employees in 2005:
2009 - 2018 National Fire Incident Reporting System (NFIRS) incidents
Based on the data from the years 2009 - 2018 the average number of fire incidents per year is 98. The highest number of fire incidents - 126 took place in 2014, and the least - 14 in 2009. The data has a growing trend.
When looking into fire subcategories, the most incidents belonged to: Outside Fires (38.8%), and Structure Fires (36.7%).
Fire incident types reported to NFIRS in Zip Code 33139


 Nearest zip codes: 33132, 33109, 33131, 33137, 33140, 33101.


 Based on the data from the years 2009 - 2018 the average number of fire incidents per year is 98. The highest number of fire incidents - 126 took place in 2014, and the least - 14 in 2009. The data has a growing trend.
 When looking into fire subcategories, the most incidents belonged to: Outside Fires (38.8%), and Structure Fires (36.7%).