Races in Monroe, Michigan (MI) Detailed Stats
Ancestries, Foreign-born residents, place of birth
Settings
X


Recent posts about races in Monroe, Michigan on our local forum with over 2,400,000 registered users:
 | Is Monroe Street the liveliest street in Downtown Detroit? (3 replies) |
| Inequality in Washtenaw County (9 replies) |
| CDC to Michigan: Shut Down Again. (81 replies) |
| New Skyscraper Planned for Monroe Block (25 replies) |
| Forbes just named GR #1 place to invest in house (50 replies) |
| Moving to Monroe - Good neighborhood - bad neighborhood (19 replies) |
Latest news about races in Monroe, MI collected exclusively by city-data.com from local newspapers, TV, and radio stations
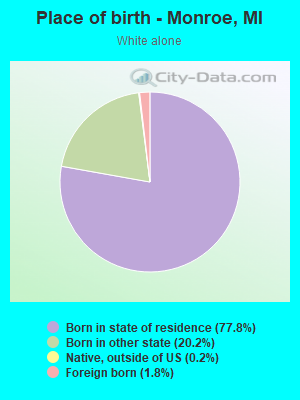
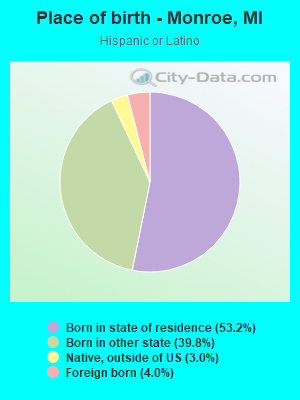
According to 2022 data, the most numerous races in Monroe, MI are White alone (17,203 residents), Black alone (607 residents), and Hispanic (726 residents). 96.9% of Monroe residents speak English at home. 2.2% of Monroe, MI residents are foreign-born (0.7% born in Asia, 0.6% born in Europe, 0.3% born in North America, 0.3% born in Latin America, 0.3% born in Africa), which is 170.4% less than the foreign-born rate of 6.0% across the entire state of Michigan.
Race distribution in Monroe
2000
2022

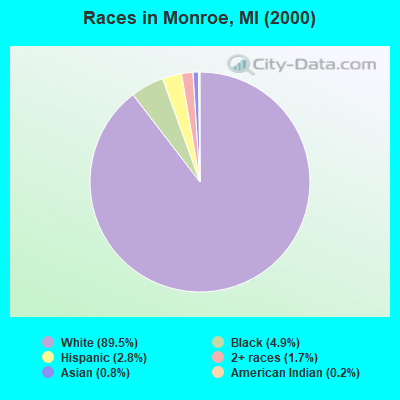
- 19,74889.5%White alone
- 1,0924.9%Black alone
- 6102.8%Hispanic
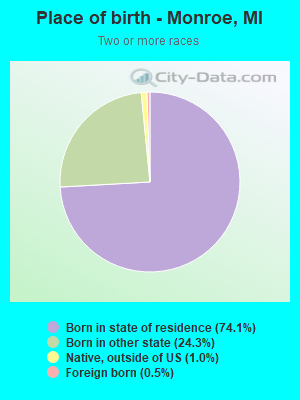
- 3761.7%Two or more races
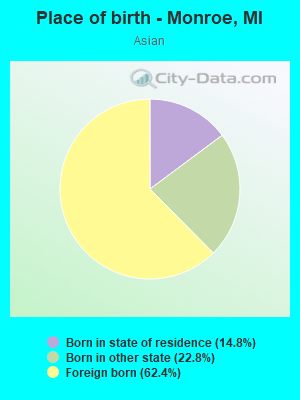
- 1860.8%Asian alone
- 410.2%American Indian alone
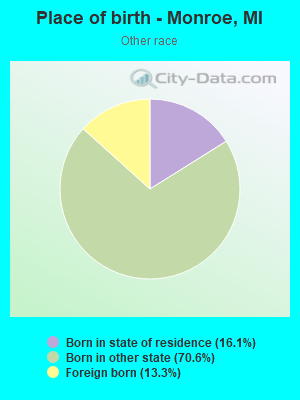
- 190.09%Other race alone
- 40.02%Native Hawaiian and Other
Pacific Islander alone
-
- 17,20383.9%White alone
- 1,2165.9%Two or more races
- 7263.5%Hispanic
- 6073.0%Black alone
- 1350.7%Other race alone
- 470.2%Asian alone
- 470.2%American Indian alone

2000
2022
-
- 7,806,69178.6%White alone
- 1,402,04714.1%Black alone
- 323,8773.3%Hispanic
- 175,3111.8%Asian alone
- 163,4871.6%Two or more races
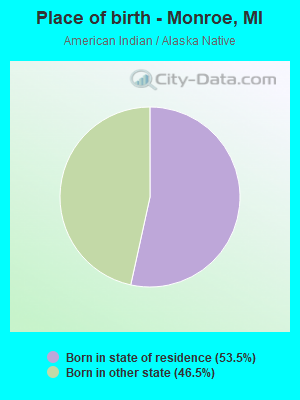
- 53,4210.5%American Indian alone
- 11,4650.1%Other race alone
- 2,1450.02%Native Hawaiian and Other
Pacific Islander alone

-
- 7,289,05172.6%White alone
- 1,310,46413.1%Black alone
- 572,4055.7%Hispanic
- 450,0314.5%Two or more races
- 335,7323.3%Asian alone
- 45,2170.5%Other race alone
- 29,0110.3%American Indian alone
- 2,2070.02%Native Hawaiian and Other
Pacific Islander alone

Income and house value in Monroe
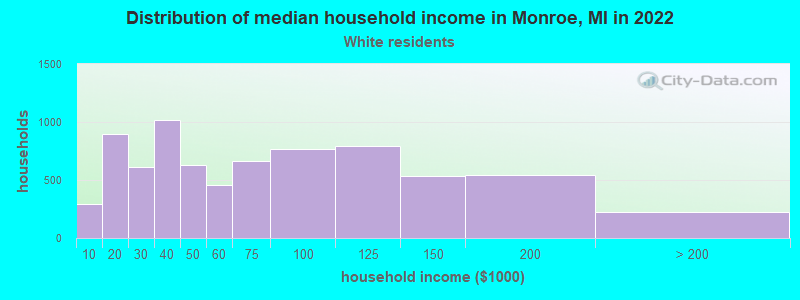
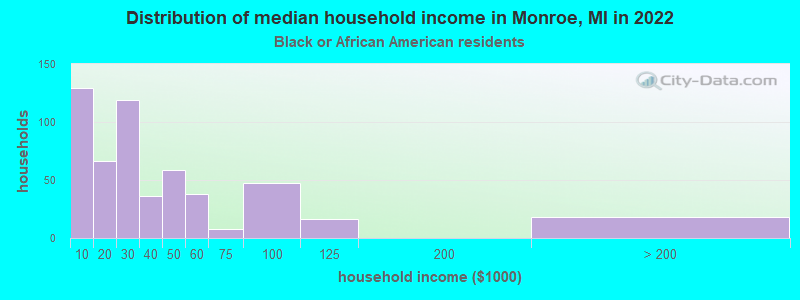
- Median household income in 2022
- $58,930White non-Hispanic householders
- $28,883Black householders
- $140,178American Indian and Alaska Native householders
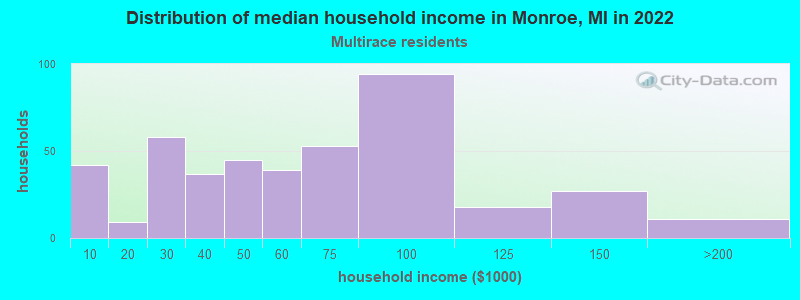
- $52,413Two or more races householders
- $47,061Hispanic or Latino race householders
- Median 2022 house value
- $161,312White Non-Hispanic householders
- $89,233Black or African American householders
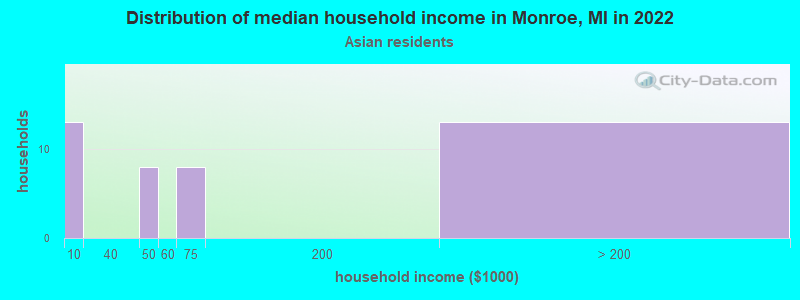
- $137,240Asian householders
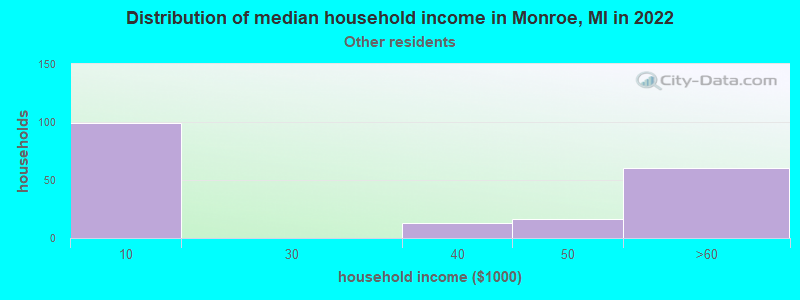
- $137,378Some other race householders
- $182,341Two or more races householders
- $166,569Hispanic or Latino householders
Household income for White non-Hispanic householders
Household income for Black householders
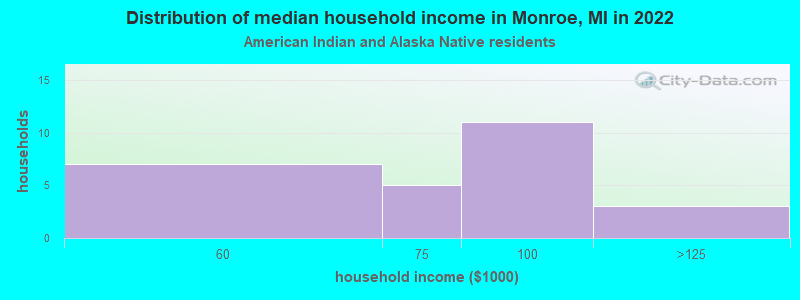
Household income for American Indian and Alaska Native householders
Household income for Asian householders
Household income for Some other race householders
Household income for Two or more races householders
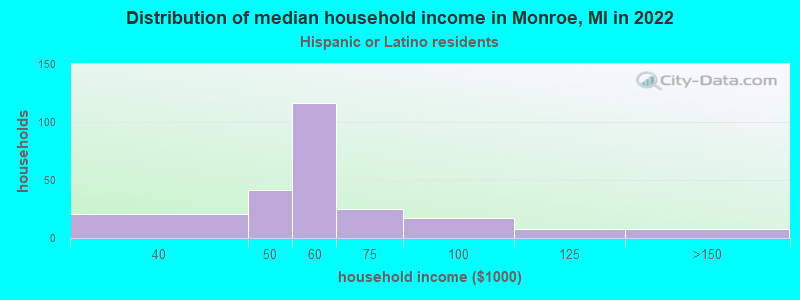
Household income for Hispanic or Latino race householders
Median age by race in Monroe
- 38.3Median age for White residents
- 37.3Males
- 38.9Females
- 37.2Median age for Black or African American residents
- 38.0Males
- 38.3Females
- 48.3Median age for American Indian / Alaska Native residents
- 36.5Males
- -673,835,124.8Females
- 35.2Median age for Asian residents
- 37.6Males
- 57.7Females
- -666,666,666.0Median age for Native Hawaiian / Pacific Islander residents
- -666,666,666.0Males
- -666,666,666.0Females
- 37.9Median age for Other race residents
- 31.3Males
- 45.8Females
- 27.6Median age for Two or more races residents
- 28.4Males
- 25.9Females
- 38.6Median age for White alone residents
- 37.7Males
- 39.4Females
- 38.0Median age for Hispanic or Latino residents
- 34.7Males
- 44.7Females
Owner/renter occupied households by race in Monroe
- House owners and renters - White residents
- 5,15768.5%Owner occupied
- 2,37031.5%Renter occupied
- House owners and renters - Black or African American residents
- 15231.3%Owner occupied
- 33368.7%Renter occupied
- House owners and renters - American Indian / Alaska Native residents
- 2177.8%Owner occupied
- 622.2%Renter occupied
- House owners and renters - Asian residents
- 2151.1%Owner occupied
- 2048.9%Renter occupied
- House owners and renters - Other race residents
- 8044.1%Owner occupied
- 10255.9%Renter occupied
- House owners and renters - Two or more races residents
- 28068.5%Owner occupied
- 12931.5%Renter occupied
- House owners and renters - White alone residents
- 5,11168.8%Owner occupied
- 2,32131.2%Renter occupied
- House owners and renters - Hispanic or Latino residents
- 14152.0%Owner occupied
- 13048.0%Renter occupied
Language usage in Monroe
- English speakers - Total
- 96.9% of residents of Monroe speak English at home.
- 1.2% of residents speak Spanish at home
- 20186.3%Speak English very well
- 3213.7%Speak English less than very well
- 1.7% of residents speak other language at home
- 22772.3%Speak English very well
- 8727.7%Speak English less than very well
- English speakers - Born in the United States
- 94.9% of residents of Monroe speak English at home.
- 2.9% of residents speak Spanish at home
- 10989.3%Speak English very well
- 1310.7%Speak English less than very well
- 0.8% of residents speak other language at home
- 2062.5%Speak English very well
- 1237.5%Speak English less than very well
- English speakers - Native, born elsewhere
- 60.3% of residents of Monroe speak English at home.
- 27.4% of residents speak Spanish at home
- 945.0%Speak English very well
- 1155.0%Speak English less than very well
- 93.2% of residents speak other language at home
- 68100.0%Speak English very well
- English speakers - Foreign-born
- 72.4% of residents of Monroe speak English at home.
- 6.5% of residents speak Spanish at home
- 27100.0%Speak English very well
- 27.8% of residents speak other language at home
- 4135.7%Speak English very well
- 7464.3%Speak English less than very well
White (Caucasian) - Speak only English
| Native: | 98.2% (15,391) |
| Foreign-born: | 66.5% (193) |
White (Caucasian) - Speak another language
| Native: | 1.4% (224) |
| Foreign-born: | 27.1% (79) |
Black or African American - Speak only English
| Native: | 100.0% (1,212) |
| Foreign-born: | 93.1% (49) |
Asian - Speak another language
| Native: | 100.0% (43) |
| Foreign-born: | 64.8% (46) |
Other race - Speak another language
| Native: | 21.3% (75) |
| Foreign-born: | 100.0% (36) |
Two or more races - Speak only English
| Native: | 90.5% (770) |
| Foreign-born: | 36.9% (5) |
Two or more races - Speak another language
| Native: | 9.0% (77) |
| Foreign-born: | 57.2% (7) |
White alone - Speak only English
| Native: | 98.4% (15,174) |
| Foreign-born: | 62.4% (197) |
White alone - Speak another language
| Native: | 1.3% (194) |
| Foreign-born: | 27.1% (85) |
Hispanic or Latino - Speak only English
| Native: | 77.7% (501) |
| Foreign-born: | 14.3% (8) |
Hispanic or Latino - Speak another language
| Native: | 22.2% (143) |
| Foreign-born: | 85.5% (47) |
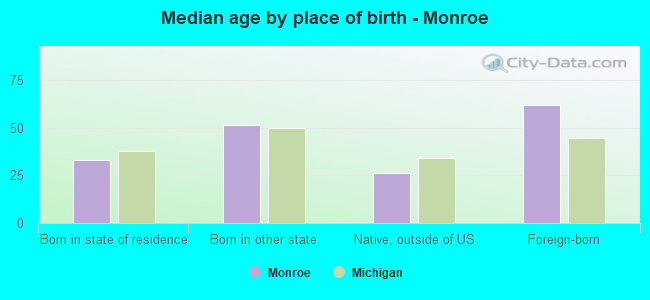
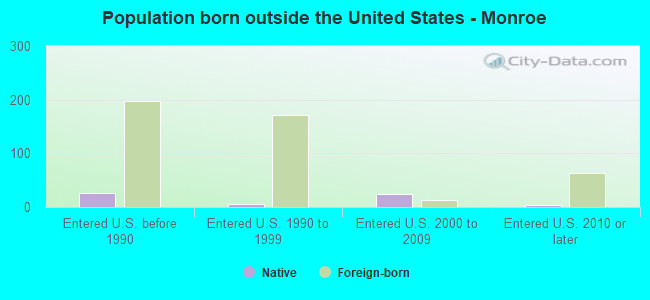
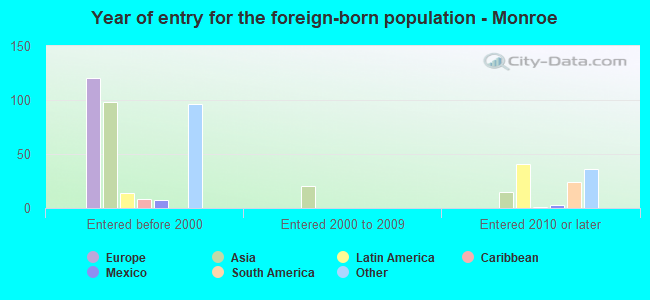
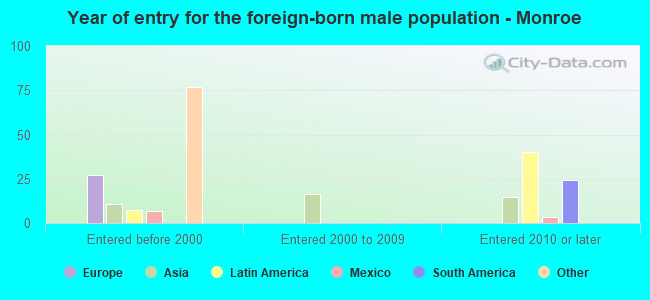
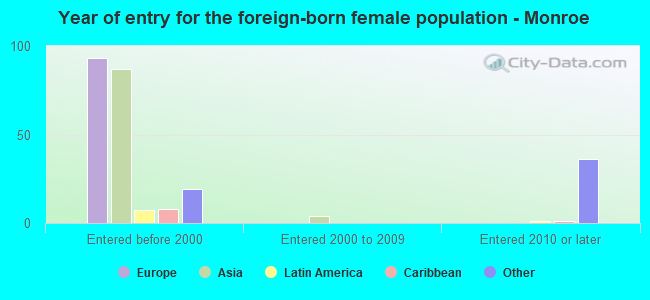
Foreign-born residents in Monroe
455 residents are foreign born (0.7% Asia, 0.6% Europe, 0.3% North America, 0.3% Latin America, 0.3% Africa).
| This city: | 2.2% |
| Michigan: | 6.9% |
Marital status for residents in Monroe
Marital status - White (Caucasian) population 15 years and over
- Males
- 36.5%Never married
- 44.3%Now married
- 0.8%Separated
- 4.5%Widowed
- 14.0%Divorced
- Females
- 28.5%Never married
- 42.5%Now married
- 1.9%Separated
- 10.7%Widowed
- 16.4%Divorced
Women who gave birth in the past 12 months
| Now married: | 65.3% (155) |
| Unmarried: | 34.7% (83) |
Women who did not give birth in the past 12 months
| Now married: | 39.8% (1,407) |
| Unmarried: | 60.2% (2,124) |
Marital status - Black or African American population 15 years and over
- Males
- 61.9%Never married
- 17.8%Now married
- 0.0%Separated
- 1.4%Widowed
- 18.9%Divorced
- Females
- 66.8%Never married
- 12.4%Now married
- 0.0%Separated
- 3.6%Widowed
- 17.2%Divorced
Women who did not give birth in the past 12 months
| Now married: | 3.0% (12) |
| Unmarried: | 97.0% (393) |
Marital status - American Indian / Alaska Native population 15 years and over
- Males
- 0.0%Never married
- 89.2%Now married
- 0.0%Separated
- 0.0%Widowed
- 10.8%Divorced
- Females
- 0.0%Never married
- 100.0%Now married
- 0.0%Separated
- 0.0%Widowed
- 0.0%Divorced
Women who did not give birth in the past 12 months
| Now married: | 100.0% (13) |
| Unmarried: | 0.0% (0) |
Marital status - Asian population 15 years and over
- Males
- 74.6%Never married
- 25.4%Now married
- 0.0%Separated
- 0.0%Widowed
- 0.0%Divorced
- Females
- 0.0%Never married
- 100.0%Now married
- 0.0%Separated
- 0.0%Widowed
- 0.0%Divorced
Women who did not give birth in the past 12 months
| Now married: | 100.0% (2) |
| Unmarried: | 0.0% (0) |
Marital status - Other race population 15 years and over
- Males
- 30.2%Never married
- 55.8%Now married
- 0.0%Separated
- 0.0%Widowed
- 14.0%Divorced
- Females
- 5.4%Never married
- 43.5%Now married
- 0.0%Separated
- 0.0%Widowed
- 51.2%Divorced
Women who did not give birth in the past 12 months
| Now married: | 44.4% (75) |
| Unmarried: | 55.6% (94) |
Marital status - Two or more races population 15 years and over
- Males
- 48.4%Never married
- 36.4%Now married
- 0.0%Separated
- 0.0%Widowed
- 15.1%Divorced
- Females
- 25.2%Never married
- 39.5%Now married
- 0.0%Separated
- 15.8%Widowed
- 19.5%Divorced
Women who gave birth in the past 12 months
| Now married: | 100.0% (17) |
| Unmarried: | 0.0% (0) |
Women who did not give birth in the past 12 months
| Now married: | 22.9% (41) |
| Unmarried: | 77.1% (137) |
Marital status - White alone, not Hispanic / Latino population 15 years and over
- Males
- 36.2%Never married
- 44.7%Now married
- 0.8%Separated
- 4.6%Widowed
- 13.7%Divorced
- Females
- 28.3%Never married
- 42.5%Now married
- 1.9%Separated
- 10.8%Widowed
- 16.5%Divorced
Women who gave birth in the past 12 months
| Now married: | 65.3% (156) |
| Unmarried: | 34.7% (83) |
Women who did not give birth in the past 12 months
| Now married: | 40.0% (1,390) |
| Unmarried: | 60.0% (2,088) |
Marital status - Hispanic or Latino population 15 years and over
- Males
- 43.1%Never married
- 39.9%Now married
- 0.0%Separated
- 0.0%Widowed
- 17.0%Divorced
- Females
- 28.5%Never married
- 60.5%Now married
- 0.0%Separated
- 2.7%Widowed
- 8.4%Divorced
Women who did not give birth in the past 12 months
| Now married: | 56.5% (108) |
| Unmarried: | 43.5% (83) |
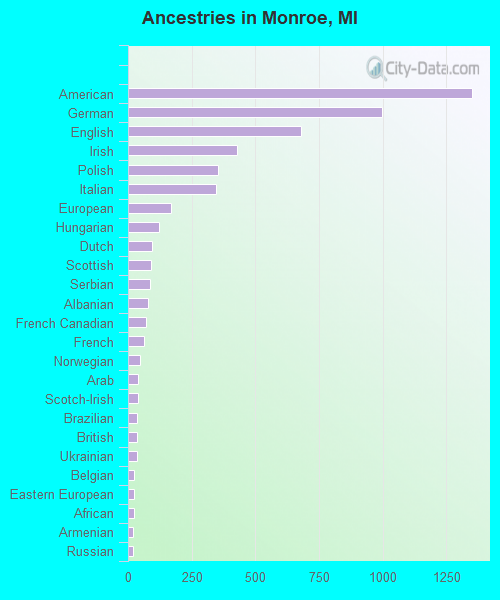
Ancestries in Monroe

- 1,35019.3%American
- 99714.3%German
- 6809.7%English
- 4296.1%Irish
- 3535.0%Polish
- 3464.9%Italian
- 1702.4%European
- 1221.7%Hungarian
- 931.3%Dutch
- 921.3%Scottish
- 871.2%Serbian
- 801.1%Albanian
- 701.0%French Canadian
- 610.9%French
- 470.7%Norwegian
- 390.6%Arab
- 380.5%Scotch-Irish
- 350.5%Brazilian
- 350.5%British
- 350.5%Ukrainian
- 240.3%Belgian
- 240.3%Eastern European
- 220.3%African
- 180.3%Armenian
- 180.3%Russian
- 170.2%Swedish
- 90.1%Lebanese
- 90.1%Czech
- 10.01%Czechoslovakian
- 10.01%Jamaican
Geographical mobility in Monroe

- Same house 1 year ago
- 14,74786.0%White (Caucasian)
- 1,16291.8%Black or African American
- 2651.2%American Indian / Alaska Native
- 10490.9%Asian
- 29278.1%Other race
- 1,01172.8%Two or more races
- 14,56686.0%White alone, not Hispanic / Latino
- 63090.5%Hispanic or Latino
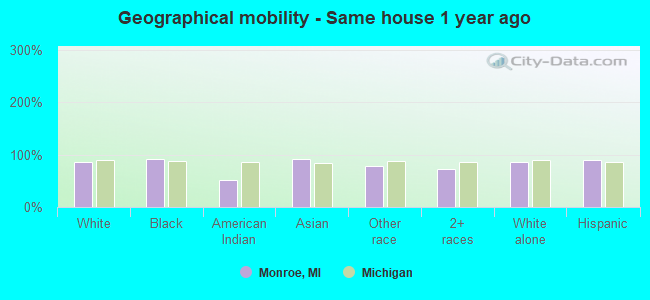
-
- Moved within same county
- 1,73610.1%White / Caucasian
- 594.7%Black or African American
- 59.9%American Indian / Alaska Native
- 1118.0%Two or more races
- 1,69110.0%White alone, not Hispanic / Latino
- 375.3%Hispanic or Latino
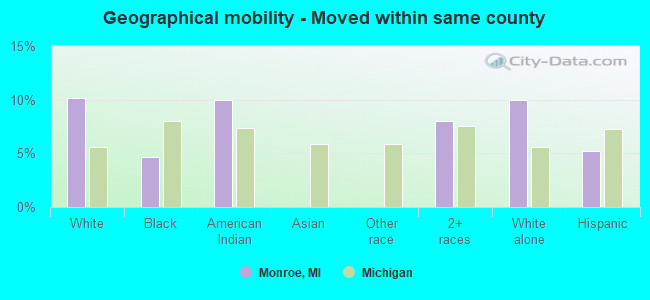
-
- Moved within same state
- 5083.0%White / Caucasian
- 443.5%Black or African American
- 1326.3%American Indian / Alaska Native
- 119.5%Asian
- 8121.8%Other race
- 735.3%Two or more races
- 5033.0%White alone, not Hispanic / Latino
- 223.2%Hispanic or Latino
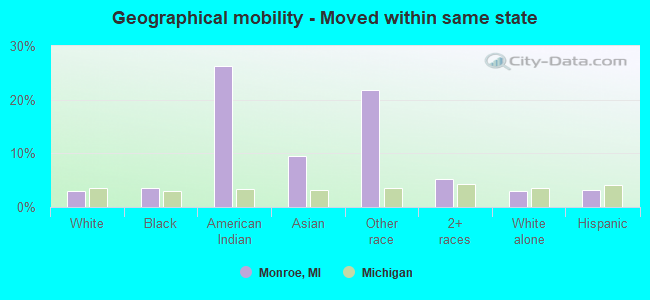
-
- Moved from different state
- 2001.2%White / Caucasian
- 80.6%Black or African American
- 130.9%Two or more races
- 2001.2%White alone, not Hispanic / Latino
- 91.3%Hispanic or Latino
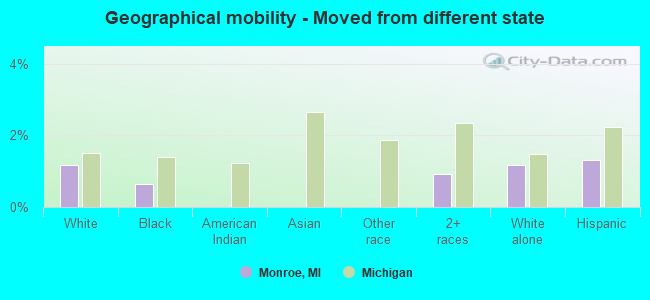
-
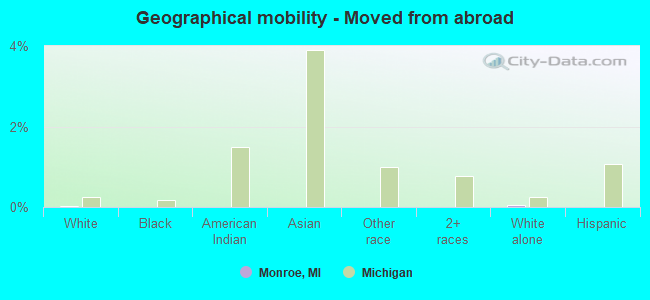
- Moved from abroad
- 60.0%White
- 60.0%White alone, not Hispanic / Latino
Children Nativity (place of birth) in Monroe
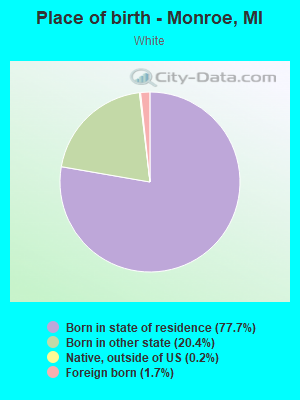
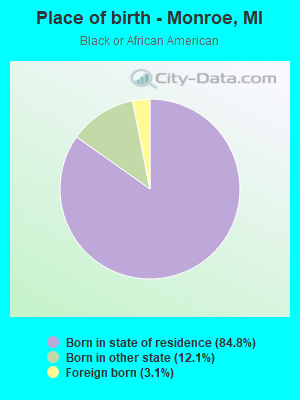
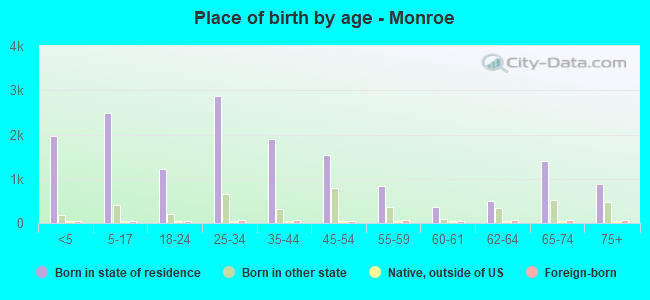
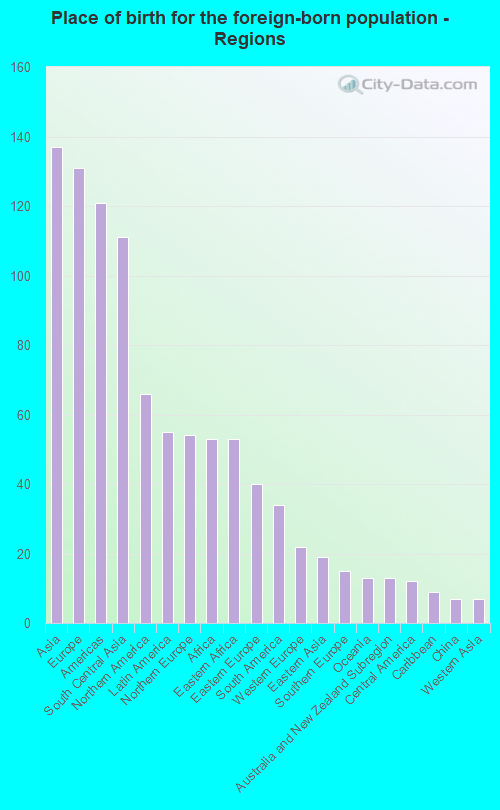
Place of birth for residents in Monroe
![Place of birth for the foreign-born population - Regions]()
- 137Asia
- 131Europe
- 121Americas
- 111South Central Asia
- 66Northern America
- 55Latin America
- 54Northern Europe
- 53Africa
- 53Eastern Africa
- 40Eastern Europe
- 34South America
- 22Western Europe
- 19Eastern Asia
- 15Southern Europe
- 13Oceania
- 13Australia and New Zealand Subregion
- 12Central America
- 9Caribbean
- 7China
- 7Western Asia
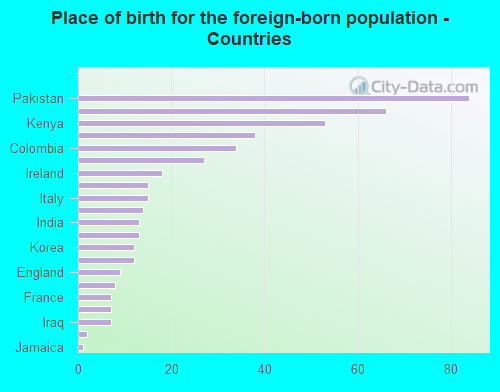
![Place of birth for the foreign-born population - Countries]()
- 84Pakistan
- 66Canada
- 53Kenya
- 38Albania
- 34Colombia
- 27United Kingdom
- 18Ireland
- 15Netherlands
- 15Italy
- 14Sri Lanka
- 13India
- 13Australia
- 12Korea
- 12Mexico
- 9England
- 8Cuba
- 7France
- 7Hong Kong
- 7Iraq
- 2Russia
- 1Jamaica
Grandparents responsible for own grandchildren in Monroe
Zip codes: 48161.