Races in Mooresville, North Carolina (NC) Detailed Stats
Data:
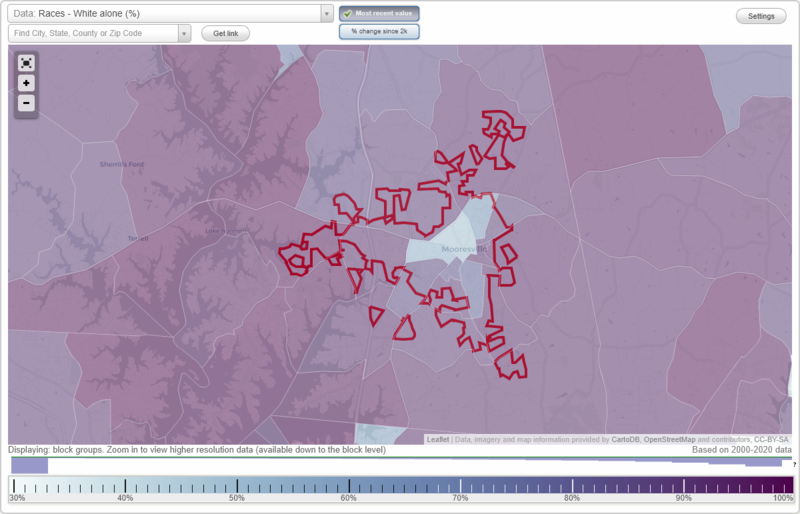
Races - White alone (%)
Races - White alone (% change since 2000)
Races - Black alone (%)
Races - Black alone (% change since 2000)
Races - American Indian alone (%)
Races - American Indian alone (% change since 2000)
Races - Asian alone (%)
Races - Asian alone (% change since 2000)
Races - Hispanic (%)
Races - Hispanic (% change since 2000)
Races - Native Hawaiian and Other Pacific Islander alone (%)
Races - Native Hawaiian and Other Pacific Islander alone (% change since 2000)
Races - Two or more races(%)
Races - Two or more races(% change since 2000)
Races - Other race alone (%)
Races - Other race alone (% change since 2000)
Racial diversity
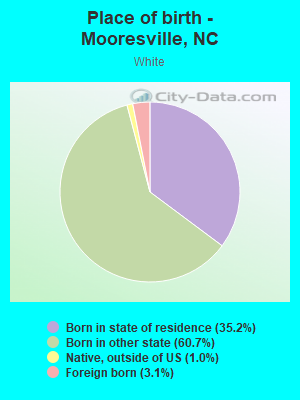
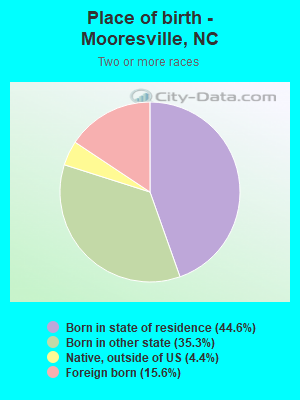
Place of birth - Born in state of residence (%)
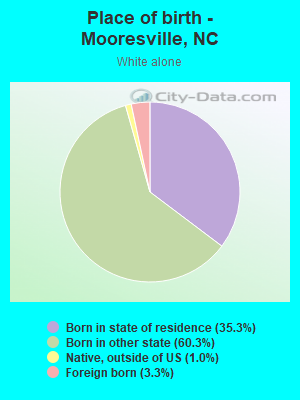
Place of birth - Born in state of residence (%) - White
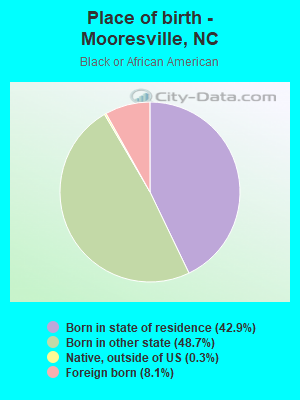
Place of birth - Born in state of residence (%) - Black or African American
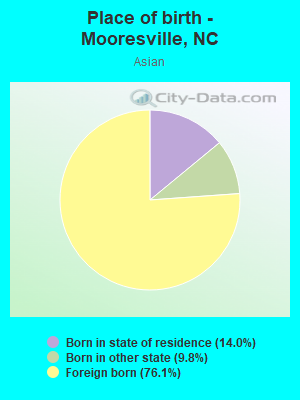
Place of birth - Born in state of residence (%) - Asian
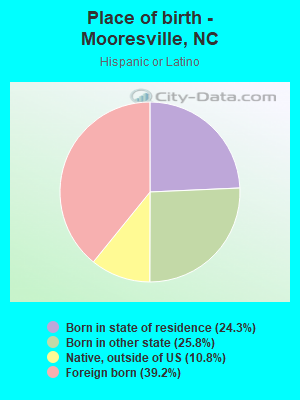
Place of birth - Born in state of residence (%) - Hispanic or Latino
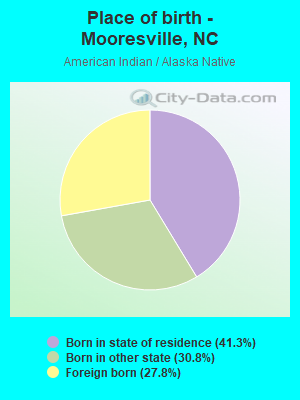
Place of birth - Born in state of residence (%) - American Indian and Alaska Native
Place of birth - Born in state of residence (%) - Multirace
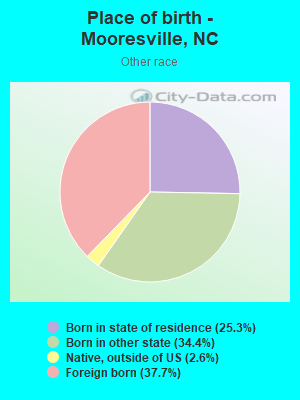
Place of birth - Born in state of residence (%) - Other Race
Place of birth - Born in other state (%)
Place of birth - Born in other state (%) - White
Place of birth - Born in other state (%) - Black or African American
Place of birth - Born in other state (%) - Asian
Place of birth - Born in other state (%) - Hispanic or Latino
Place of birth - Born in other state (%) - American Indian and Alaska Native
Place of birth - Born in other state (%) - Multirace
Place of birth - Born in other state (%) - Other Race
Place of birth - Native, outside of US (%)
Place of birth - Native, outside of US (%) - White
Place of birth - Native, outside of US (%) - Black or African American
Place of birth - Native, outside of US (%) - Asian
Place of birth - Native, outside of US (%) - Hispanic or Latino
Place of birth - Native, outside of US (%) - American Indian and Alaska Native
Place of birth - Native, outside of US (%) - Multirace
Place of birth - Native, outside of US (%) - Other Race
Place of birth - Foreign born (%)
Place of birth - Foreign born (%) - White
Place of birth - Foreign born (%) - Black or African American
Place of birth - Foreign born (%) - Asian
Place of birth - Foreign born (%) - Hispanic or Latino
Place of birth - Foreign born (%) - American Indian and Alaska Native
Place of birth - Foreign born (%) - Multirace
Place of birth - Foreign born (%) - Other Race
Residents speaking English at home (%)
Residents speaking English at home - Born in the United States (%)
Residents speaking English at home - Native, born elsewhere (%)
Residents speaking English at home - Foreign born (%)
Residents speaking Spanish at home (%)
Residents speaking Spanish at home - Born in the United States (%)
Residents speaking Spanish at home - Native, born elsewhere (%)
Residents speaking Spanish at home - Foreign born (%)
Residents speaking other language at home (%)
Residents speaking other language at home - Born in the United States (%)
Residents speaking other language at home - Native, born elsewhere (%)
Residents speaking other language at home - Foreign born (%)
Marital status - Never married (%)
Marital status - Now married (%)
Marital status - Separated (%)
Marital status - Widowed (%)
Marital status - Divorced (%)
Ancestries Reported - Arab (%)
Ancestries Reported - Czech (%)
Ancestries Reported - Danish (%)
Ancestries Reported - Dutch (%)
Ancestries Reported - English (%)
Ancestries Reported - French (%)
Ancestries Reported - French Canadian (%)
Ancestries Reported - German (%)
Ancestries Reported - Greek (%)
Ancestries Reported - Hungarian (%)
Ancestries Reported - Irish (%)
Ancestries Reported - Italian (%)
Ancestries Reported - Lithuanian (%)
Ancestries Reported - Norwegian (%)
Ancestries Reported - Polish (%)
Ancestries Reported - Portuguese (%)
Ancestries Reported - Russian (%)
Ancestries Reported - Scotch-Irish (%)
Ancestries Reported - Scottish (%)
Ancestries Reported - Slovak (%)
Ancestries Reported - Subsaharan African (%)
Ancestries Reported - Swedish (%)
Ancestries Reported - Swiss (%)
Ancestries Reported - Ukrainian (%)
Ancestries Reported - United States (%)
Ancestries Reported - Welsh (%)
Ancestries Reported - West Indian (%)
Ancestries Reported - Other (%)
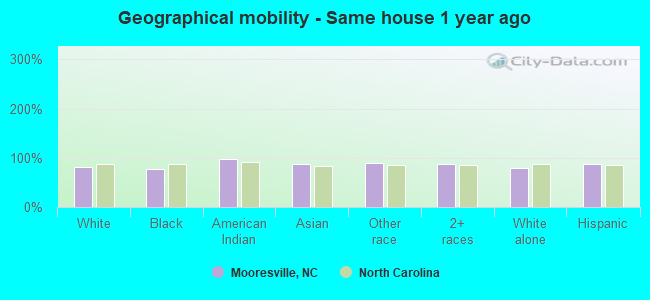
Geographical mobility - Same house 1 year ago (%)
Geographical mobility - Same house 1 year ago (%) - White
Geographical mobility - Same house 1 year ago (%) - Black or African American
Geographical mobility - Same house 1 year ago (%) - Asian
Geographical mobility - Same house 1 year ago (%) - Hispanic or Latino
Geographical mobility - Same house 1 year ago (%) - American Indian and Alaska Native
Geographical mobility - Same house 1 year ago (%) - Multirace
Geographical mobility - Same house 1 year ago (%) - Other Race
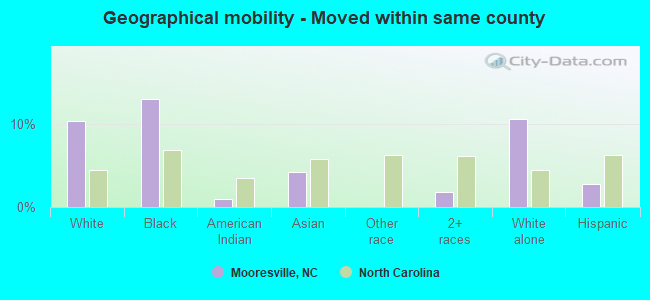
Geographical mobility - Moved within same county (%)
Geographical mobility - Moved within same county (%) - White
Geographical mobility - Moved within same county (%) - Black or African American
Geographical mobility - Moved within same county (%) - Asian
Geographical mobility - Moved within same county (%) - Hispanic or Latino
Geographical mobility - Moved within same county (%) - American Indian and Alaska Native
Geographical mobility - Moved within same county (%) - Multirace
Geographical mobility - Moved within same county (%) - Other Race
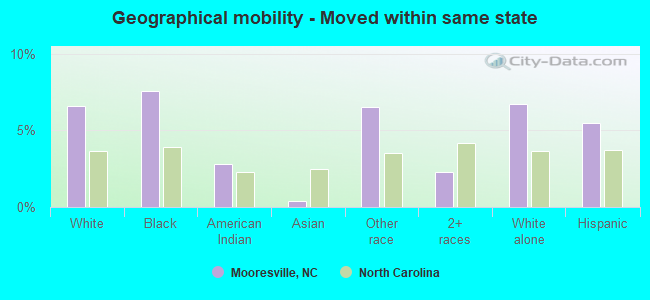
Geographical mobility - Moved from different county within same state (%)
Geographical mobility - Moved from different county within same state (%) - White
Geographical mobility - Moved from different county within same state (%) - Black or African American
Geographical mobility - Moved from different county within same state (%) - Asian
Geographical mobility - Moved from different county within same state (%) - Hispanic or Latino
Geographical mobility - Moved from different county within same state (%) - American Indian and Alaska Native
Geographical mobility - Moved from different county within same state (%) - Multirace
Geographical mobility - Moved from different county within same state (%) - Other Race
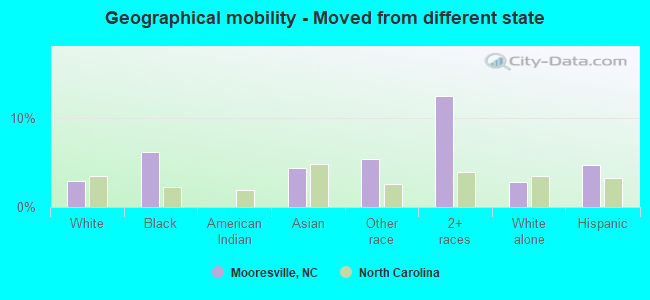
Geographical mobility - Moved from different state (%)
Geographical mobility - Moved from different state (%) - White
Geographical mobility - Moved from different state (%) - Black or African American
Geographical mobility - Moved from different state (%) - Asian
Geographical mobility - Moved from different state (%) - Hispanic or Latino
Geographical mobility - Moved from different state (%) - American Indian and Alaska Native
Geographical mobility - Moved from different state (%) - Multirace
Geographical mobility - Moved from different state (%) - Other Race
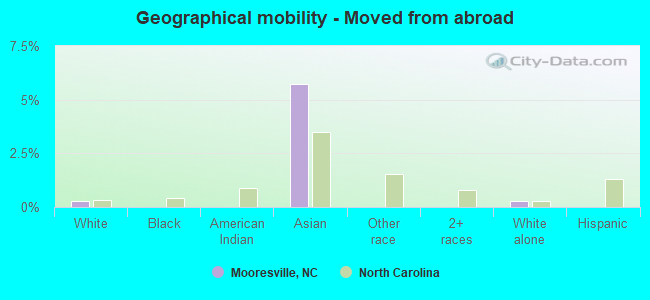
Geographical mobility - Moved from abroad (%)
Geographical mobility - Moved from abroad (%) - White
Geographical mobility - Moved from abroad (%) - Black or African American
Geographical mobility - Moved from abroad (%) - Asian
Geographical mobility - Moved from abroad (%) - Hispanic or Latino
Geographical mobility - Moved from abroad (%) - American Indian and Alaska Native
Geographical mobility - Moved from abroad (%) - Multirace
Geographical mobility - Moved from abroad (%) - Other Race
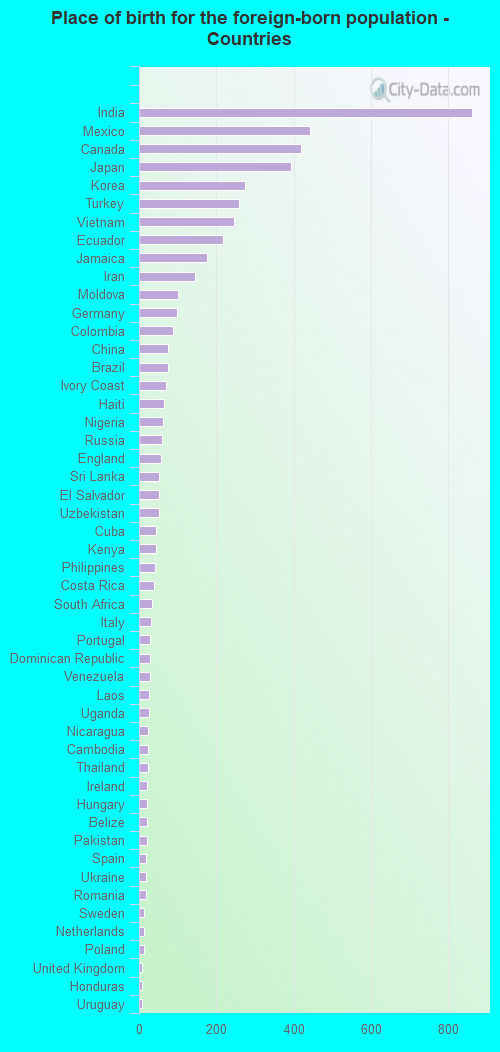
Place of birth for the foreign-born population - Ireland (%)
Place of birth for the foreign-born population - Denmark (%)
Place of birth for the foreign-born population - Norway (%)
Place of birth for the foreign-born population - Sweden (%)
Place of birth for the foreign-born population - United Kingdom (%)
Place of birth for the foreign-born population - England (%)
Place of birth for the foreign-born population - Scotland (%)
Place of birth for the foreign-born population - Other Northern Europe (%)
Place of birth for the foreign-born population - Austria (%)
Place of birth for the foreign-born population - Belgium (%)
Place of birth for the foreign-born population - France (%)
Place of birth for the foreign-born population - Germany (%)
Place of birth for the foreign-born population - Netherlands (%)
Place of birth for the foreign-born population - Switzerland (%)
Place of birth for the foreign-born population - Other Western Europe (%)
Place of birth for the foreign-born population - Greece (%)
Place of birth for the foreign-born population - Italy (%)
Place of birth for the foreign-born population - Portugal (%)
Place of birth for the foreign-born population - Spain (%)
Place of birth for the foreign-born population - Other Southern Europe (%)
Place of birth for the foreign-born population - Albania (%)
Place of birth for the foreign-born population - Belarus (%)
Place of birth for the foreign-born population - Bosnia and Herzegovina (%)
Place of birth for the foreign-born population - Bulgaria (%)
Place of birth for the foreign-born population - Croatia (%)
Place of birth for the foreign-born population - Czechoslovakia (%)
Place of birth for the foreign-born population - Hungary (%)
Place of birth for the foreign-born population - Latvia (%)
Place of birth for the foreign-born population - Lithuania (%)
Place of birth for the foreign-born population - North Macedonia (Macedonia) (%)
Place of birth for the foreign-born population - Moldova (%)
Place of birth for the foreign-born population - Poland (%)
Place of birth for the foreign-born population - Romania (%)
Place of birth for the foreign-born population - Russia (%)
Place of birth for the foreign-born population - Serbia (%)
Place of birth for the foreign-born population - Ukraine (%)
Place of birth for the foreign-born population - Other Eastern Europe (%)
Place of birth for the foreign-born population - China (%)
Place of birth for the foreign-born population - Hong Kong (%)
Place of birth for the foreign-born population - Taiwan (%)
Place of birth for the foreign-born population - Japan (%)
Place of birth for the foreign-born population - Korea (%)
Place of birth for the foreign-born population - Other Eastern Asia (%)
Place of birth for the foreign-born population - Afghanistan (%)
Place of birth for the foreign-born population - Bangladesh (%)
Place of birth for the foreign-born population - India (%)
Place of birth for the foreign-born population - Iran (%)
Place of birth for the foreign-born population - Kazakhstan (%)
Place of birth for the foreign-born population - Nepal (%)
Place of birth for the foreign-born population - Pakistan (%)
Place of birth for the foreign-born population - Sri Lanka (%)
Place of birth for the foreign-born population - Uzbekistan (%)
Place of birth for the foreign-born population - Other South Central Asia (%)
Place of birth for the foreign-born population - Burma (%)
Place of birth for the foreign-born population - Cambodia (%)
Place of birth for the foreign-born population - Indonesia (%)
Place of birth for the foreign-born population - Laos (%)
Place of birth for the foreign-born population - Malaysia (%)
Place of birth for the foreign-born population - Philippines (%)
Place of birth for the foreign-born population - Singapore (%)
Place of birth for the foreign-born population - Thailand (%)
Place of birth for the foreign-born population - Vietnam (%)
Place of birth for the foreign-born population - Other South Eastern Asia (%)
Place of birth for the foreign-born population - Armenia (%)
Place of birth for the foreign-born population - Iraq (%)
Place of birth for the foreign-born population - Israel (%)
Place of birth for the foreign-born population - Jordan (%)
Place of birth for the foreign-born population - Kuwait (%)
Place of birth for the foreign-born population - Lebanon (%)
Place of birth for the foreign-born population - Saudi Arabia (%)
Place of birth for the foreign-born population - Syria (%)
Place of birth for the foreign-born population - Turkey (%)
Place of birth for the foreign-born population - Yemen (%)
Place of birth for the foreign-born population - Other Western Asia (%)
Place of birth for the foreign-born population - Eritrea (%)
Place of birth for the foreign-born population - Ethiopia (%)
Place of birth for the foreign-born population - Kenya (%)
Place of birth for the foreign-born population - Somalia (%)
Place of birth for the foreign-born population - Uganda (%)
Place of birth for the foreign-born population - Zimbabwe (%)
Place of birth for the foreign-born population - Other Eastern Africa (%)
Place of birth for the foreign-born population - Cameroon (%)
Place of birth for the foreign-born population - Congo (%)
Place of birth for the foreign-born population - Democratic Republic of Congo (Zaire) (%)
Place of birth for the foreign-born population - Other Middle Africa (%)
Place of birth for the foreign-born population - Egypt (%)
Place of birth for the foreign-born population - Morocco (%)
Place of birth for the foreign-born population - Sudan (%)
Place of birth for the foreign-born population - Other Northern Africa (%)
Place of birth for the foreign-born population - South Africa (%)
Place of birth for the foreign-born population - Other Southern Africa (%)
Place of birth for the foreign-born population - Cabo Verde (%)
Place of birth for the foreign-born population - Ghana (%)
Place of birth for the foreign-born population - Liberia (%)
Place of birth for the foreign-born population - Nigeria (%)
Place of birth for the foreign-born population - Senegal (%)
Place of birth for the foreign-born population - Sierra Leone (%)
Place of birth for the foreign-born population - Other Western Africa (%)
Place of birth for the foreign-born population - Australia (%)
Place of birth for the foreign-born population - New Zealand (%)
Place of birth for the foreign-born population - Fiji (%)
Place of birth for the foreign-born population - Micronesia (%)
Place of birth for the foreign-born population - Bahamas (%)
Place of birth for the foreign-born population - Barbados (%)
Place of birth for the foreign-born population - Cuba (%)
Place of birth for the foreign-born population - Dominica (%)
Place of birth for the foreign-born population - Dominican Republic (%)
Place of birth for the foreign-born population - Grenada (%)
Place of birth for the foreign-born population - Haiti (%)
Place of birth for the foreign-born population - Jamaica (%)
Place of birth for the foreign-born population - St. Vincent and the Grenadines (%)
Place of birth for the foreign-born population - Trinidad and Tobago (%)
Place of birth for the foreign-born population - West Indies (%)
Place of birth for the foreign-born population - Other Caribbean (%)
Place of birth for the foreign-born population - Belize (%)
Place of birth for the foreign-born population - Costa Rica (%)
Place of birth for the foreign-born population - El Salvador (%)
Place of birth for the foreign-born population - Guatemala (%)
Place of birth for the foreign-born population - Honduras (%)
Place of birth for the foreign-born population - Mexico (%)
Place of birth for the foreign-born population - Nicaragua (%)
Place of birth for the foreign-born population - Panama (%)
Place of birth for the foreign-born population - Other Central America (%)
Place of birth for the foreign-born population - Argentina (%)
Place of birth for the foreign-born population - Bolivia (%)
Place of birth for the foreign-born population - Brazil (%)
Place of birth for the foreign-born population - Chile (%)
Place of birth for the foreign-born population - Colombia (%)
Place of birth for the foreign-born population - Ecuador (%)
Place of birth for the foreign-born population - Guyana (%)
Place of birth for the foreign-born population - Peru (%)
Place of birth for the foreign-born population - Uruguay (%)
Place of birth for the foreign-born population - Venezuela (%)
Place of birth for the foreign-born population - Other South America (%)
Place of birth for the foreign-born population - Canada (%)
Place of birth for the foreign-born population - Other Northern America (%)
Place of birth for the foreign-born population - Other (%)
Latest news about races in Mooresville, NC collected exclusively by city-data.com from local newspapers, TV, and radio stations
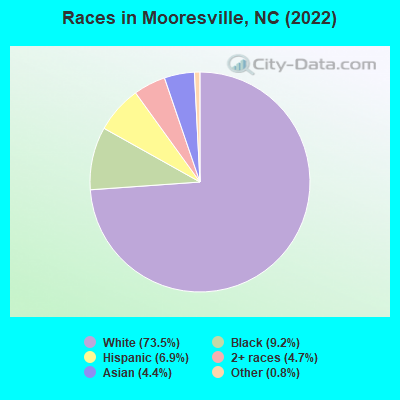
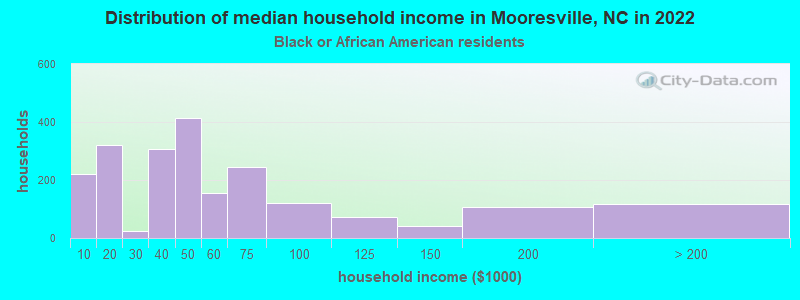
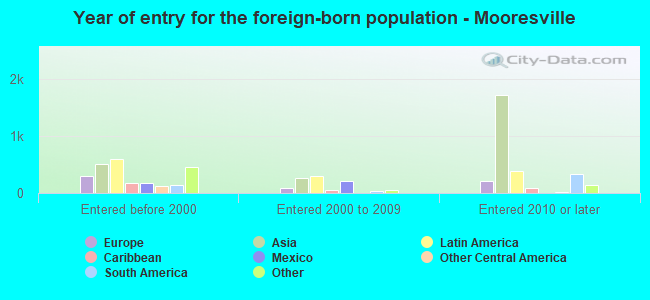
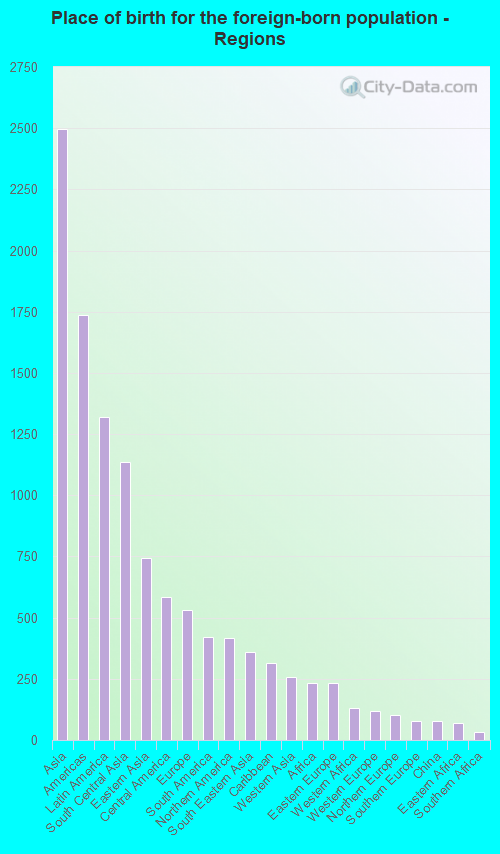
According to 2022 data, the most numerous races in Mooresville, NC are White alone (38,331 residents), Black alone (4,820 residents), and Hispanic (3,615 residents). 88.7% of Mooresville residents speak English at home. 9.6% of Mooresville, NC residents are foreign-born (4.7% born in Asia, 2.5% born in Latin America, 1.0% born in Europe), which is 16.6% greater than the foreign-born rate of 8.0% across the entire state of North Carolina.
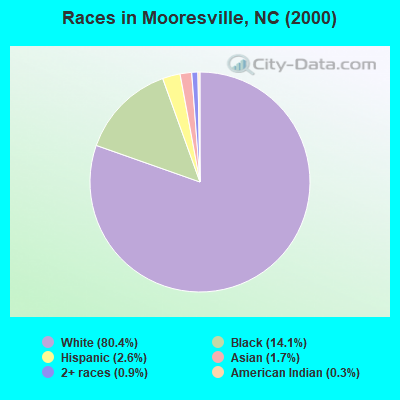
Race distribution in Mooresville
2000 2022
5,647,155 70.2% White alone 1,723,301 21.4% Black alone 378,963 4.7% Hispanic 112,416 1.4% Asian alone 95,333 1.2% American Indian alone 79,965 1.0% Two or more races 9,015 0.1% Other race alone 3,165 0.04% Native Hawaiian and Other
6,497,519 60.7% White alone 2,155,650 20.1% Black alone 1,114,799 10.4% Hispanic 438,061 4.1% Two or more races 341,052 3.2% Asian alone 91,758 0.9% American Indian alone 50,180 0.5% Other race alone 9,954 0.09% Native Hawaiian and Other
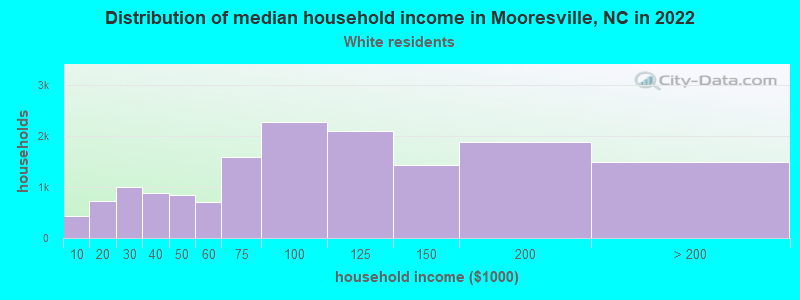
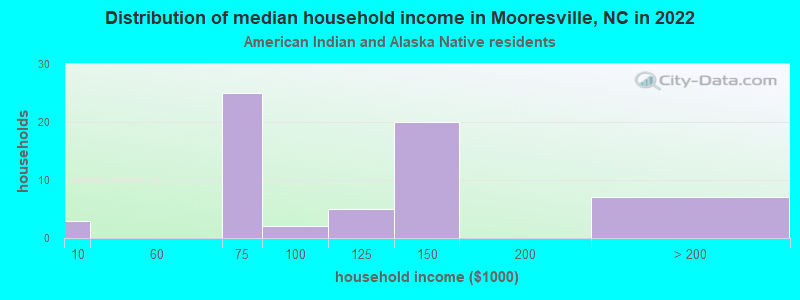
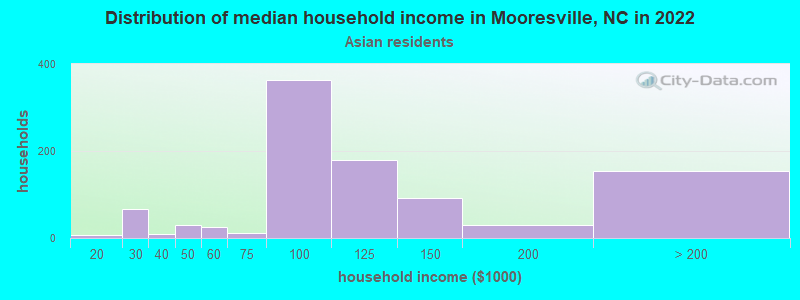
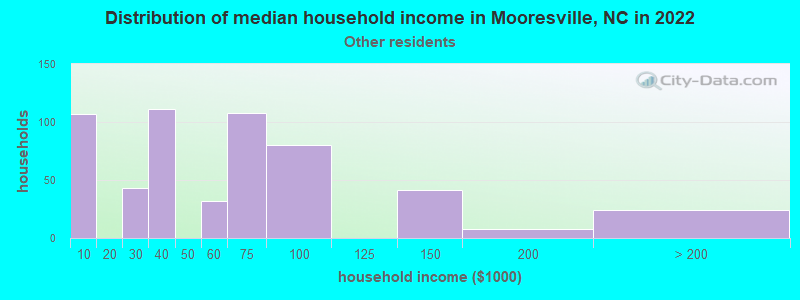
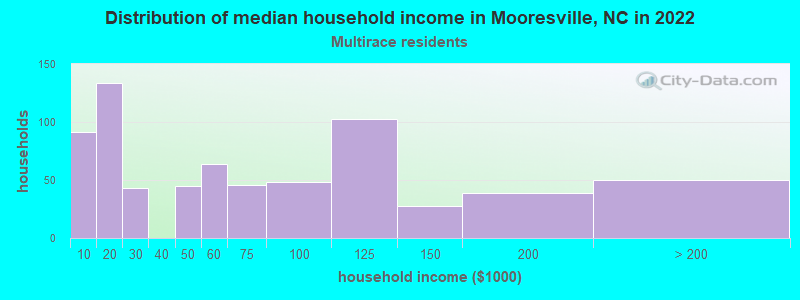
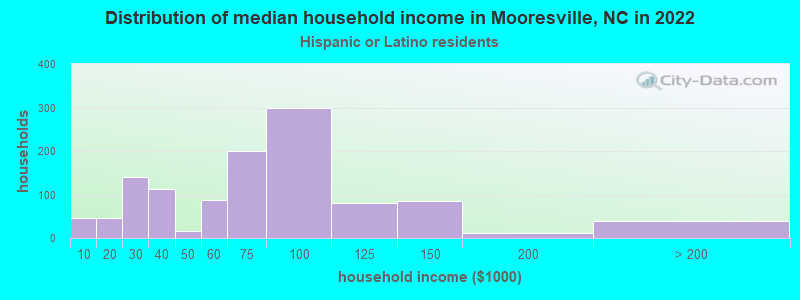
Income and house value in Mooresville Median household income in 2022 $89,333 White non-Hispanic householders$45,453 Black householders$102,095 Asian householders$54,514 Some other race householders$51,502 Two or more races householders$79,154 Hispanic or Latino race householdersMedian 2022 house value $423,293 White Non-Hispanic householders$190,231 Black or African American householders$192,003 American Indian or Alaska Native householders $481,485 Asian householders$354,468 Two or more races householders$417,386 Hispanic or Latino householders
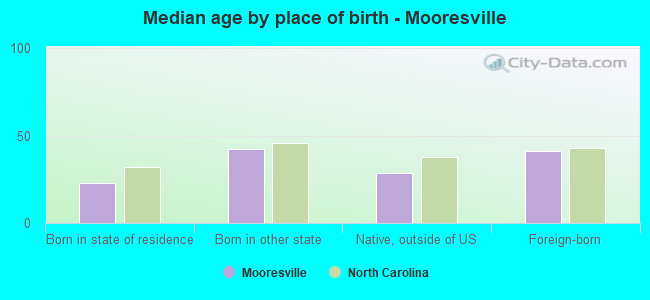
Median age by race in Mooresville
38.9 Median age for White residents38.0 40.1 29.0 Median age for Black or African American residents24.9 35.2 41.4 Median age for American Indian / Alaska Native residents41.1 44.6 47.1 Median age for Asian residents45.7 45.1 -609,884,331.7 Median age for Native Hawaiian / Pacific Islander residents-666,666,666.0 -666,666,666.0 29.7 Median age for Other race residents28.7 33.4 21.7 Median age for Two or more races residents16.2 24.5 39.0 Median age for White alone residents37.8 40.0 29.8 Median age for Hispanic or Latino residents28.0 34.2
Owner/renter occupied households by race in Mooresville
House owners and renters - White residents 10,074 66.1% Owner occupied5,160 33.9% Renter occupiedHouse owners and renters - Black or African American residents 517 24.6% Owner occupied1,585 75.4% Renter occupiedHouse owners and renters - American Indian / Alaska Native residents 59 96.6% Owner occupied2 3.4% Renter occupiedHouse owners and renters - Asian residents 618 63.7% Owner occupied352 36.3% Renter occupiedHouse owners and renters - Other race residents 141 22.2% Owner occupied495 77.8% Renter occupiedHouse owners and renters - Two or more races residents 373 42.4% Owner occupied508 57.6% Renter occupiedHouse owners and renters - White alone residents 9,765 65.5% Owner occupied5,135 34.5% Renter occupiedHouse owners and renters - Hispanic or Latino residents 538 48.7% Owner occupied567 51.3% Renter occupied
Language usage in Mooresville
English speakers - Total 88.7% of residents of Mooresville speak English at home.
4.6% of residents speak Spanish at home 1,554 67.7% Speak English very well741 32.3% Speak English less than very well6.0% of residents speak other language at home 1,631 55.4% Speak English very well1,311 44.6% Speak English less than very well
English speakers - Born in the United States 96.5% of residents of Mooresville speak English at home.
1.8% of residents speak Spanish at home 445 90.1% Speak English very well49 9.9% Speak English less than very well1.5% of residents speak other language at home 336 83.6% Speak English very well66 16.4% Speak English less than very well
English speakers - Native, born elsewhere 87.6% of residents of Mooresville speak English at home.
21.0% of residents speak Spanish at home 106 73.1% Speak English very well39 26.9% Speak English less than very well0.7% of residents speak other language at home 5 100.0% Speak English very well
English speakers - Foreign-born 22.1% of residents of Mooresville speak English at home.
24.7% of residents speak Spanish at home 585 45.3% Speak English very well705 54.7% Speak English less than very well38.0% of residents speak other language at home 1,092 55.1% Speak English very well890 44.9% Speak English less than very well
White (Caucasian) - Speak only English Native:
97.6% (34,936)Foreign-born:
49.1% (577)
White (Caucasian) - Speak another language Native:
2.3% (834)Foreign-born:
51.7% (608)
Black or African American - Speak only English Native:
99.3% (4,473)Foreign-born:
54.4% (231)
Black or African American - Speak another language Native:
0.8% (35)Foreign-born:
45.9% (195)
American Indian / Alaska Native - Speak another language Native:
100.0% (105)Foreign-born:
100.0% (42)
Asian - Speak only English Native:
50.0% (194)Foreign-born:
16.6% (343)
Asian - Speak another language Native:
50.0% (194)Foreign-born:
83.3% (1,716)
Other race - Speak only English Native:
52.9% (424)Foreign-born:
1.3% (7)
Other race - Speak another language Native:
51.0% (409)Foreign-born:
100.0% (521)
Two or more races - Speak only English Native:
93.8% (2,583)Foreign-born:
9.0% (45)
Two or more races - Speak another language Native:
8.1% (223)Foreign-born:
88.9% (444)
White alone - Speak only English Native:
97.7% (34,212)Foreign-born:
49.4% (616)
White alone - Speak another language Native:
2.4% (829)Foreign-born:
50.4% (628)
Hispanic or Latino - Speak only English Native:
61.2% (1,177)Foreign-born:
4.6% (61)
Hispanic or Latino - Speak another language Native:
40.5% (779)Foreign-born:
100.0% (1,338)
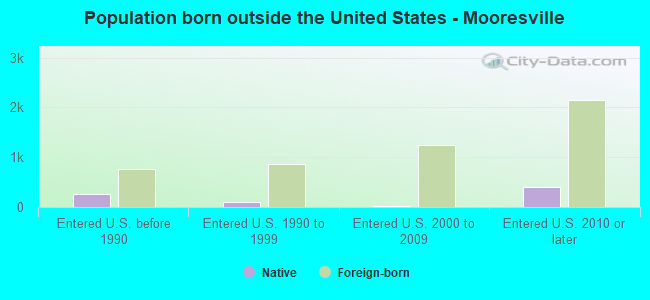
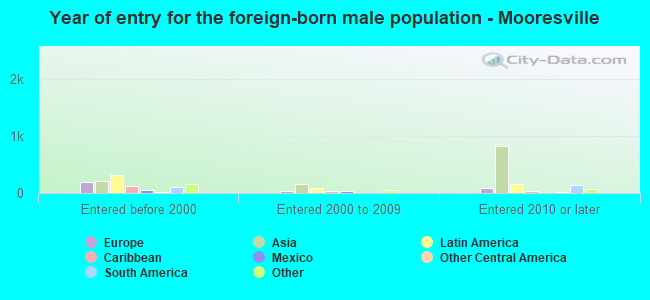
Foreign-born residents in Mooresville 5,002 residents are foreign born (4.7% Asia , 2.5% Latin America , 1.0% Europe ).
This city:
9.6%North Carolina:
8.3%
Marital status for residents in Mooresville Marital status - White (Caucasian) population 15 years and over
Males 30.6% Never married58.0% Now married1.9% Separated1.8% Widowed7.7% DivorcedFemales 24.3% Never married53.4% Now married1.2% Separated6.8% Widowed14.4% DivorcedWomen who gave birth in the past 12 months Now married:
86.3% (513)Unmarried:
13.7% (82)
Women who did not give birth in the past 12 months Now married:
49.0% (4,417)Unmarried:
51.0% (4,594)
Marital status - Black or African American population 15 years and over
Males 57.0% Never married30.7% Now married4.4% Separated3.0% Widowed4.8% DivorcedFemales 62.4% Never married23.4% Now married0.9% Separated1.7% Widowed11.7% DivorcedWomen who gave birth in the past 12 months Now married:
16.7% (14)Unmarried:
83.3% (71)
Women who did not give birth in the past 12 months Now married:
14.0% (204)Unmarried:
86.0% (1,259)
Marital status - American Indian / Alaska Native population 15 years and over
Males 49.0% Never married32.7% Now married0.0% Separated0.0% Widowed18.4% DivorcedFemales 21.2% Never married39.4% Now married0.0% Separated0.0% Widowed39.4% DivorcedWomen who did not give birth in the past 12 months Now married:
65.0% (28)Unmarried:
35.0% (15)
Marital status - Asian population 15 years and over
Males 21.5% Never married78.5% Now married0.0% Separated0.0% Widowed0.0% DivorcedFemales 6.0% Never married66.5% Now married1.1% Separated21.0% Widowed5.4% DivorcedWomen who gave birth in the past 12 months Now married:
94.5% (199)Unmarried:
5.5% (12)
Women who did not give birth in the past 12 months Now married:
69.9% (394)Unmarried:
30.1% (170)
Marital status - Other race population 15 years and over
Males 34.3% Never married41.7% Now married0.0% Separated0.0% Widowed24.1% DivorcedFemales 39.4% Never married32.7% Now married9.7% Separated0.0% Widowed18.1% DivorcedWomen who did not give birth in the past 12 months Now married:
60.1% (244)Unmarried:
39.9% (162)
Marital status - Two or more races population 15 years and over
Males 57.0% Never married36.4% Now married0.0% Separated2.8% Widowed3.8% DivorcedFemales 37.3% Never married38.5% Now married3.4% Separated11.5% Widowed9.3% DivorcedWomen who did not give birth in the past 12 months Now married:
41.3% (241)Unmarried:
58.7% (342)
Marital status - White alone, not Hispanic / Latino population 15 years and over
Males 30.3% Never married58.1% Now married1.9% Separated1.7% Widowed7.9% DivorcedFemales 23.6% Never married54.1% Now married1.1% Separated6.9% Widowed14.3% DivorcedWomen who gave birth in the past 12 months Now married:
86.3% (526)Unmarried:
13.7% (84)
Women who did not give birth in the past 12 months Now married:
49.3% (4,320)Unmarried:
50.7% (4,443)
Marital status - Hispanic or Latino population 15 years and over
Males 38.8% Never married51.0% Now married0.0% Separated1.7% Widowed8.5% DivorcedFemales 40.7% Never married37.7% Now married5.5% Separated4.8% Widowed11.3% DivorcedWomen who did not give birth in the past 12 months Now married:
49.0% (474)Unmarried:
51.0% (493)
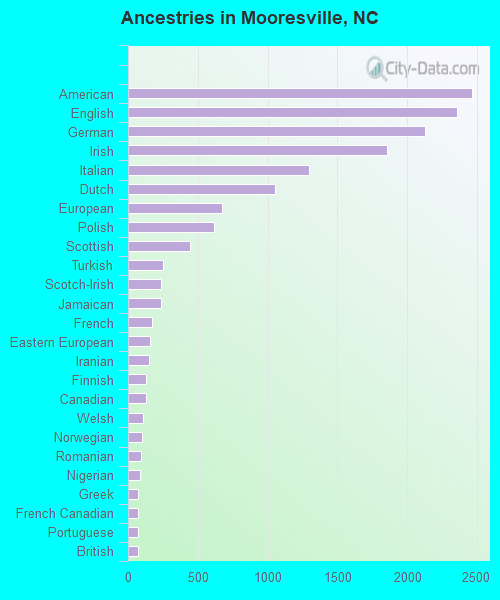
Ancestries in Mooresville
2,463 10.2% American2,358 9.7% English2,128 8.8% German1,856 7.7% Irish1,295 5.3% Italian1,055 4.4% Dutch676 2.8% European617 2.5% Polish446 1.8% Scottish248 1.0% Turkish239 1.0% Scotch-Irish233 1.0% Jamaican173 0.7% French159 0.7% Eastern European152 0.6% Iranian129 0.5% Finnish126 0.5% Canadian104 0.4% Welsh98 0.4% Norwegian95 0.4% Romanian87 0.4% Nigerian75 0.3% Greek74 0.3% French Canadian73 0.3% Portuguese72 0.3% British70 0.3% African57 0.2% Russian52 0.2% Hungarian50 0.2% Swedish46 0.2% Czechoslovakian33 0.1% Lebanese32 0.1% Scandinavian27 0.1% Danish18 0.07% Croatian13 0.05% Pennsylvania German10 0.04% Ugandan10 0.04% Ukrainian9 0.04% Swiss8 0.03% Czech8 0.03% Lithuanian8 0.03% Slovak6 0.02% Macedonian
Geographical mobility in Mooresville Same house 1 year ago 31,108 80.4% White (Caucasian)3,658 76.7% Black or African American136 97.5% American Indian / Alaska Native2,215 86.5% Asian1,205 89.0% Other race3,096 88.1% Two or more races30,322 80.1% White alone, not Hispanic / Latino3,047 88.1% Hispanic or LatinoMoved within same county 4,025 10.4% White / Caucasian623 13.1% Black or African American1 1.0% American Indian / Alaska Native107 4.2% Asian65 1.8% Two or more races4,049 10.7% White alone, not Hispanic / Latino97 2.8% Hispanic or LatinoMoved within same state 2,552 6.6% White / Caucasian360 7.5% Black or African American4 2.8% American Indian / Alaska Native10 0.4% Asian89 6.5% Other race81 2.3% Two or more races2,549 6.7% White alone, not Hispanic / Latino189 5.5% Hispanic or LatinoMoved from different state 1,113 2.9% White / Caucasian294 6.2% Black or African American112 4.4% Asian73 5.4% Other race438 12.5% Two or more races1,072 2.8% White alone, not Hispanic / Latino162 4.7% Hispanic or LatinoMoved from abroad 108 0.3% White147 5.7% Asian108 0.3% White alone, not Hispanic / Latino
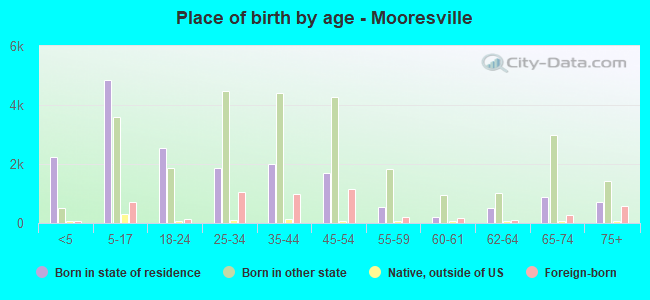
Children Nativity (place of birth) in Mooresville
Children under 6 years - Living with two parents Both parents native 2,185 100.0% NativeBoth parents foreign-born 442 83.2% Native89 16.8% Foreign-bornOne native, one foreign-born parent 82 100.0% NativeChildren under 6 years - Living with one parent Native parent 690 100.0% NativeForeign-born parent 47 100.0% NativeChildren 6 to 17 years - Living with two parents Both parents native 5,156 95.6% Native237 4.4% Foreign-bornBoth parents foreign-born 504 69.3% Native224 30.7% Foreign-bornOne native, one foreign-born parent 432 100.0% NativeChildren 6 to 17 years - Living with one parent Native parent 1,917 100.0% NativeForeign-born parent 140 57.5% Native103 42.5% Foreign-born
Grandparents responsible for own grandchildren in Mooresville
Grandparents (30 to 59 years) White / Caucasian 63 30.0% Responsible for grandchildren147 70.0% Not responsible for grandchildrenBlack or African American 15 100.0% Not responsible for grandchildrenWhite alone, not Hispanic / Latino 63 29.2% Responsible for grandchildren153 70.8% Not responsible for grandchildrenGrandparents (60 years and over) White / Caucasian 113 40.0% Responsible for grandchildren170 60.0% Not responsible for grandchildrenBlack or African American 14 5.9% Responsible for grandchildren231 94.1% Not responsible for grandchildrenWhite alone, not Hispanic / Latino 116 46.6% Responsible for grandchildren133 53.4% Not responsible for grandchildren