Races in Morehead City, North Carolina (NC) Detailed Stats
Ancestries, Foreign-born residents, place of birth
Settings
X


Recent posts about races in Morehead City, North Carolina on our local forum with over 2,400,000 registered users:

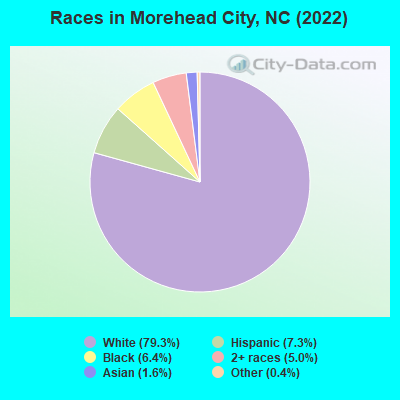
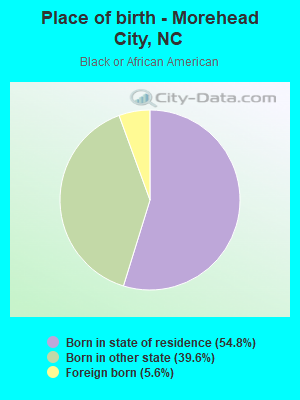
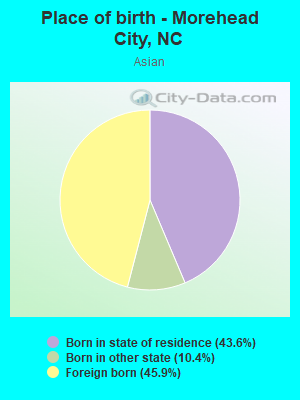
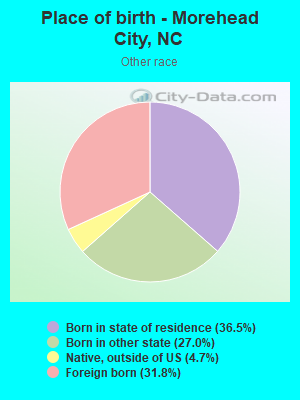
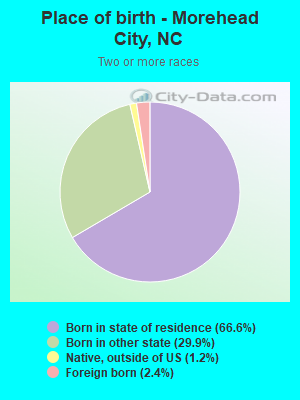
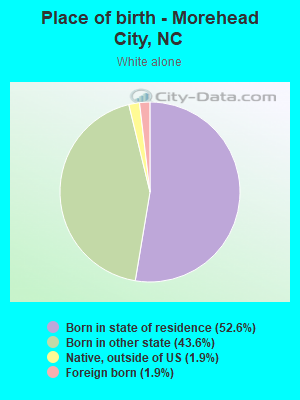
According to 2022 data, the most numerous races in Morehead City, NC are White alone (7,809 residents), Black alone (625 residents), and Hispanic (717 residents). 93.5% of Morehead City residents speak English at home. 3.6% of Morehead City, NC residents are foreign-born (1.4% born in Latin America, 1.2% born in Europe, 0.6% born in Asia), which is 120.3% less than the foreign-born rate of 8.0% across the entire state of North Carolina.
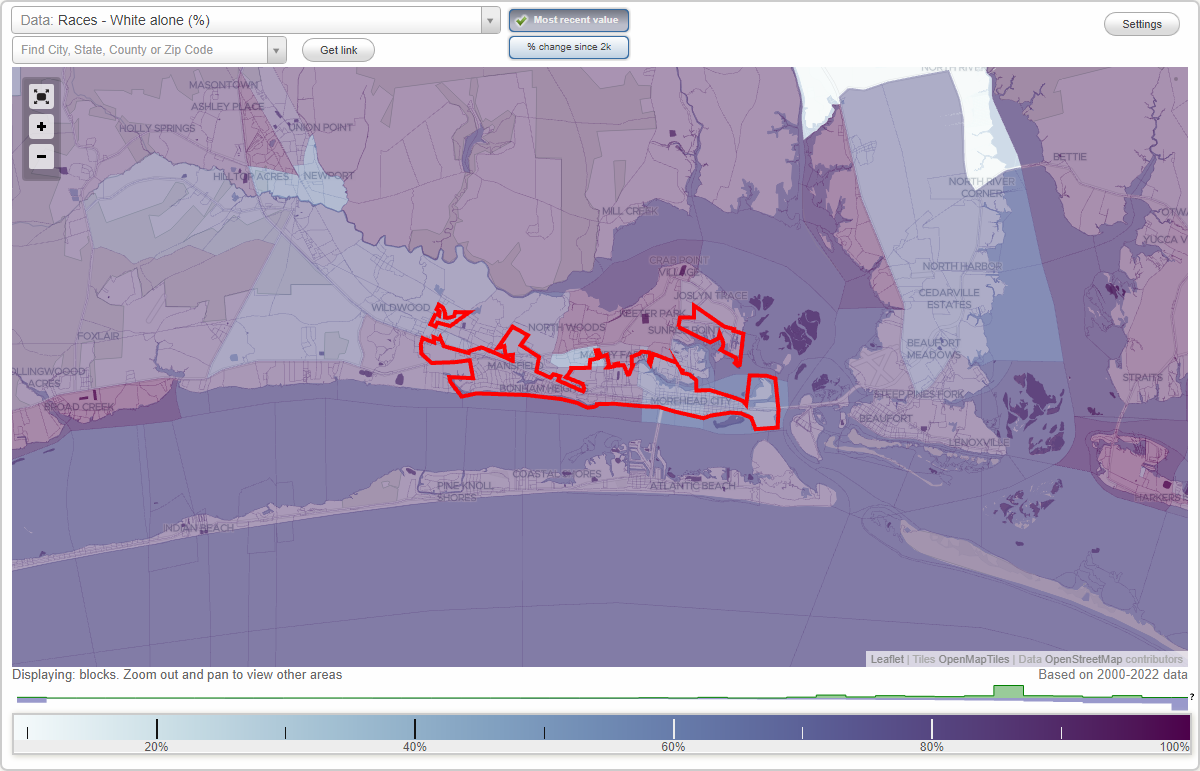
Race distribution in Morehead City
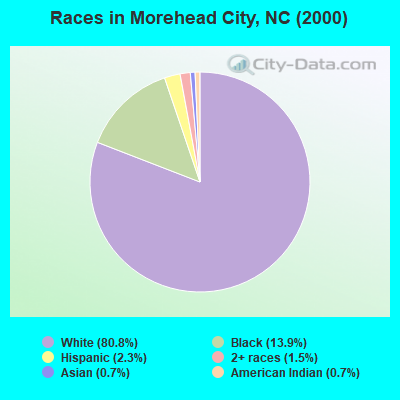
2000
2022

- 6,21380.8%White alone
- 1,07113.9%Black alone
- 1802.3%Hispanic
- 1151.5%Two or more races
- 520.7%Asian alone
- 500.7%American Indian alone
- 70.09%Other race alone
- 30.04%Native Hawaiian and Other
Pacific Islander alone
-
- 7,80979.3%White alone
- 7177.3%Hispanic
- 6256.4%Black alone
- 4905.0%Two or more races
- 1571.6%Asian alone
- 400.4%Other race alone
- 60.06%American Indian alone
2000
2022
-
- 5,647,15570.2%White alone
- 1,723,30121.4%Black alone
- 378,9634.7%Hispanic
- 112,4161.4%Asian alone
- 95,3331.2%American Indian alone
- 79,9651.0%Two or more races
- 9,0150.1%Other race alone
- 3,1650.04%Native Hawaiian and Other
Pacific Islander alone

-
- 6,497,51960.7%White alone
- 2,155,65020.1%Black alone
- 1,114,79910.4%Hispanic
- 438,0614.1%Two or more races
- 341,0523.2%Asian alone
- 91,7580.9%American Indian alone
- 50,1800.5%Other race alone
- 9,9540.09%Native Hawaiian and Other
Pacific Islander alone

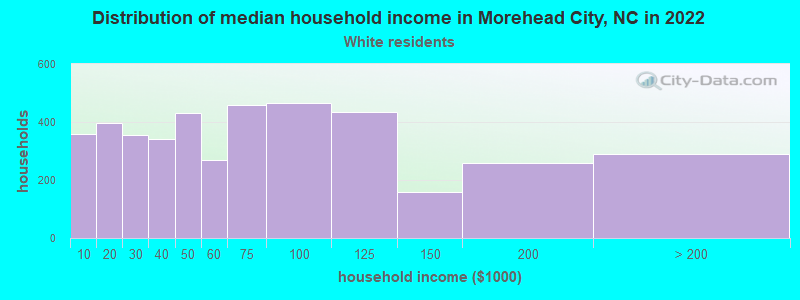
Income and house value in Morehead City
- Median household income in 2022
- $57,781White non-Hispanic householders
- $16,943Black householders
- $67,919Asian householders
- $101,852Two or more races householders
- $52,430Hispanic or Latino race householders
- Median 2022 house value
- $385,367White Non-Hispanic householders
- $202,074Black or African American householders
- $330,414American Indian or Alaska Native householders
- $391,279Asian householders
- $326,240Two or more races householders
- $614,222Hispanic or Latino householders
Household income for White non-Hispanic householders
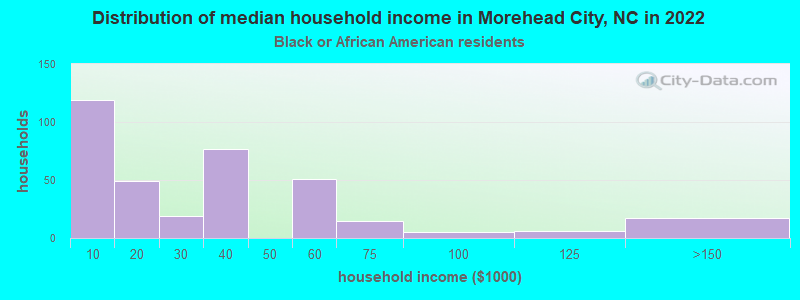
Household income for Black householders
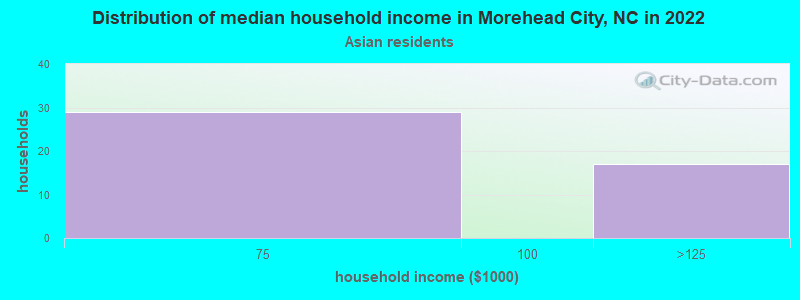
Household income for Asian householders
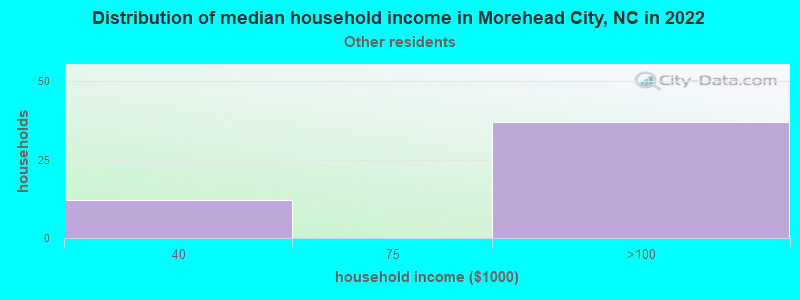
Household income for Some other race householders
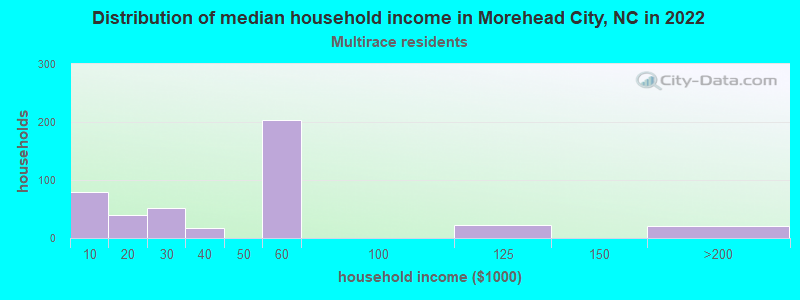
Household income for Two or more races householders
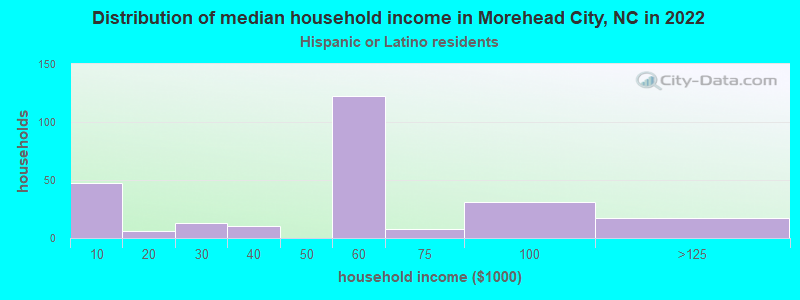
Household income for Hispanic or Latino race householders
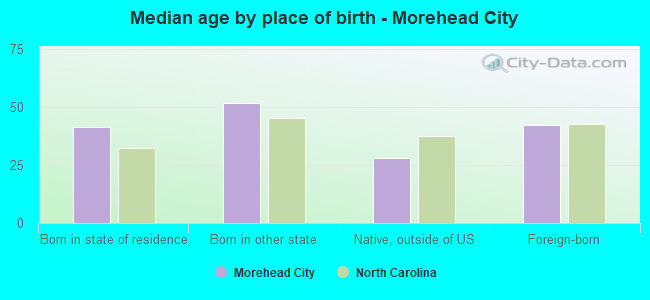
Median age by race in Morehead City
- 50.9Median age for White residents
- 49.1Males
- 54.9Females
- 37.3Median age for Black or African American residents
- 43.3Males
- 33.3Females
- 23.5Median age for American Indian / Alaska Native residents
- -1,549,295,773.1Males
- -682,971,013.8Females
- 66.2Median age for Asian residents
- 10.0Males
- 55.7Females
- -609,884,331.7Median age for Native Hawaiian / Pacific Islander residents
- -666,666,666.0Males
- -612,403,100.2Females
- 9.8Median age for Other race residents
- 23.1Males
- 9.7Females
- 17.6Median age for Two or more races residents
- 22.7Males
- 19.2Females
- 50.7Median age for White alone residents
- 49.3Males
- 54.7Females
- 41.8Median age for Hispanic or Latino residents
- 32.3Males
- 48.3Females
Owner/renter occupied households by race in Morehead City
- House owners and renters - White residents
- 2,28354.3%Owner occupied
- 1,92145.7%Renter occupied
- House owners and renters - Black or African American residents
- 499.5%Owner occupied
- 47490.5%Renter occupied
- House owners and renters - American Indian / Alaska Native residents
- 5100.0%Renter occupied
- House owners and renters - Asian residents
- 1740.6%Owner occupied
- 2559.4%Renter occupied
- House owners and renters - Other race residents
- 54100.0%Renter occupied
- House owners and renters - Two or more races residents
- 11635.5%Owner occupied
- 21164.5%Renter occupied
- House owners and renters - White alone residents
- 2,28954.3%Owner occupied
- 1,92745.7%Renter occupied
- House owners and renters - Hispanic or Latino residents
- 3611.8%Owner occupied
- 27088.2%Renter occupied
Language usage in Morehead City
- English speakers - Total
- 93.5% of residents of Morehead City speak English at home.
- 4.3% of residents speak Spanish at home
- 34585.8%Speak English very well
- 5714.2%Speak English less than very well
- 1.8% of residents speak other language at home
- 15491.7%Speak English very well
- 148.3%Speak English less than very well
- English speakers - Born in the United States
- 91.6% of residents of Morehead City speak English at home.
- 3.4% of residents speak Spanish at home
- 129100.0%Speak English very well
- 2.1% of residents speak other language at home
- 80100.0%Speak English very well
- English speakers - Native, born elsewhere
- 79.4% of residents of Morehead City speak English at home.
- 11.8% of residents speak Spanish at home
- 2592.6%Speak English very well
- 27.4%Speak English less than very well
- English speakers - Foreign-born
- 58.2% of residents of Morehead City speak English at home.
- 29.7% of residents speak Spanish at home
- 2929.0%Speak English very well
- 7171.0%Speak English less than very well
- 13.6% of residents speak other language at home
- 4189.1%Speak English very well
- 510.9%Speak English less than very well
White (Caucasian) - Speak only English
| Native: | 96.2% (7,151) |
| Foreign-born: | 86.8% (120) |
White (Caucasian) - Speak another language
| Native: | 3.0% (220) |
| Foreign-born: | 17.6% (24) |
Black or African American - Speak only English
| Native: | 99.4% (566) |
| Foreign-born: | 100.0% (35) |
Asian - Speak only English
| Native: | 99.5% (86) |
| Foreign-born: | 36.5% (27) |
Other race - Speak another language
| Native: | 14.9% (23) |
| Foreign-born: | 100.0% (77) |
Two or more races - Speak another language
| Native: | 26.8% (244) |
| Foreign-born: | 100.0% (19) |
White alone - Speak only English
| Native: | 96.5% (7,107) |
| Foreign-born: | 91.3% (133) |
White alone - Speak another language
| Native: | 3.1% (226) |
| Foreign-born: | 10.6% (15) |
Hispanic or Latino - Speak another language
| Native: | 35.0% (218) |
| Foreign-born: | 99.8% (96) |
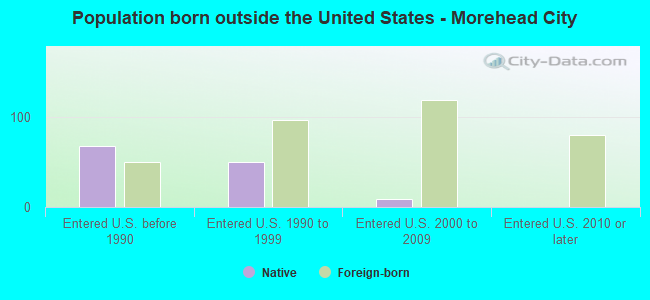
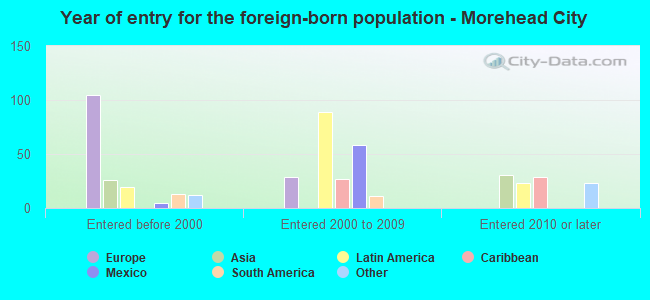
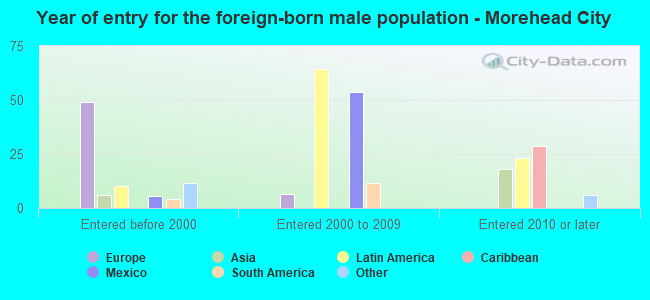
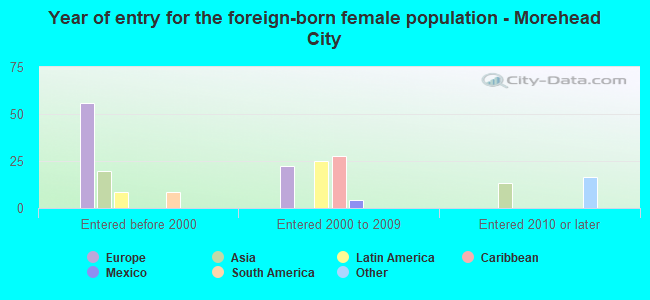
Foreign-born residents in Morehead City
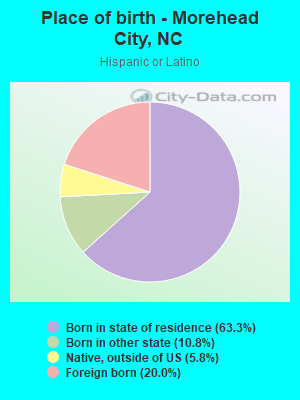
355 residents are foreign born (1.4% Latin America, 1.2% Europe, 0.6% Asia).
| This city: | 3.6% |
| North Carolina: | 8.3% |

Marital status for residents in Morehead City
Marital status - White (Caucasian) population 15 years and over
- Males
- 26.4%Never married
- 49.8%Now married
- 0.3%Separated
- 4.4%Widowed
- 19.1%Divorced
- Females
- 20.3%Never married
- 41.7%Now married
- 3.0%Separated
- 17.0%Widowed
- 18.0%Divorced
Women who gave birth in the past 12 months
| Now married: | 85.5% (99) |
| Unmarried: | 14.5% (17) |
Women who did not give birth in the past 12 months
| Now married: | 47.7% (693) |
| Unmarried: | 52.3% (761) |
Marital status - Black or African American population 15 years and over
- Males
- 57.6%Never married
- 31.7%Now married
- 0.0%Separated
- 1.9%Widowed
- 8.8%Divorced
- Females
- 67.9%Never married
- 13.3%Now married
- 0.0%Separated
- 10.0%Widowed
- 8.9%Divorced
Women who gave birth in the past 12 months
| Now married: | 0.0% (0) |
| Unmarried: | 100.0% (28) |
Women who did not give birth in the past 12 months
| Now married: | 6.3% (7) |
| Unmarried: | 93.7% (104) |
Marital status - American Indian / Alaska Native population 15 years and over
- Males
- 0.0%Never married
- 0.0%Now married
- 0.0%Separated
- 0.0%Widowed
- 100.0%Divorced
- Females
- 100.0%Never married
- 0.0%Now married
- 0.0%Separated
- 0.0%Widowed
- 0.0%Divorced
Women who did not give birth in the past 12 months
| Now married: | 0.0% (0) |
| Unmarried: | 100.0% (5) |
Marital status - Asian population 15 years and over
- Males
- 0.0%Never married
- 100.0%Now married
- 0.0%Separated
- 0.0%Widowed
- 0.0%Divorced
- Females
- 0.0%Never married
- 56.9%Now married
- 17.2%Separated
- 25.9%Widowed
- 0.0%Divorced
Women who did not give birth in the past 12 months
| Now married: | 68.8% (35) |
| Unmarried: | 31.2% (16) |
Marital status - Other race population 15 years and over
- Males
- 38.0%Never married
- 21.1%Now married
- 0.0%Separated
- 0.0%Widowed
- 40.8%Divorced
- Females
- 0.0%Never married
- 100.0%Now married
- 0.0%Separated
- 0.0%Widowed
- 0.0%Divorced
Women who did not give birth in the past 12 months
| Now married: | 100.0% (11) |
| Unmarried: | 0.0% (0) |
Marital status - Two or more races population 15 years and over
- Males
- 72.8%Never married
- 27.2%Now married
- 0.0%Separated
- 0.0%Widowed
- 0.0%Divorced
- Females
- 50.3%Never married
- 34.5%Now married
- 0.0%Separated
- 6.4%Widowed
- 8.8%Divorced
Women who did not give birth in the past 12 months
| Now married: | 36.9% (168) |
| Unmarried: | 63.1% (287) |
Marital status - White alone, not Hispanic / Latino population 15 years and over
- Males
- 26.0%Never married
- 51.3%Now married
- 0.4%Separated
- 4.6%Widowed
- 17.7%Divorced
- Females
- 20.3%Never married
- 41.3%Now married
- 3.1%Separated
- 17.0%Widowed
- 18.2%Divorced
Women who gave birth in the past 12 months
| Now married: | 83.8% (88) |
| Unmarried: | 16.2% (17) |
Women who did not give birth in the past 12 months
| Now married: | 47.1% (688) |
| Unmarried: | 52.9% (772) |
Marital status - Hispanic or Latino population 15 years and over
- Males
- 50.4%Never married
- 13.7%Now married
- 0.0%Separated
- 0.0%Widowed
- 35.9%Divorced
- Females
- 36.1%Never married
- 53.2%Now married
- 0.0%Separated
- 10.8%Widowed
- 0.0%Divorced
Women who gave birth in the past 12 months
| Now married: | 100.0% (13) |
| Unmarried: | 0.0% (0) |
Women who did not give birth in the past 12 months
| Now married: | 53.2% (134) |
| Unmarried: | 46.8% (118) |
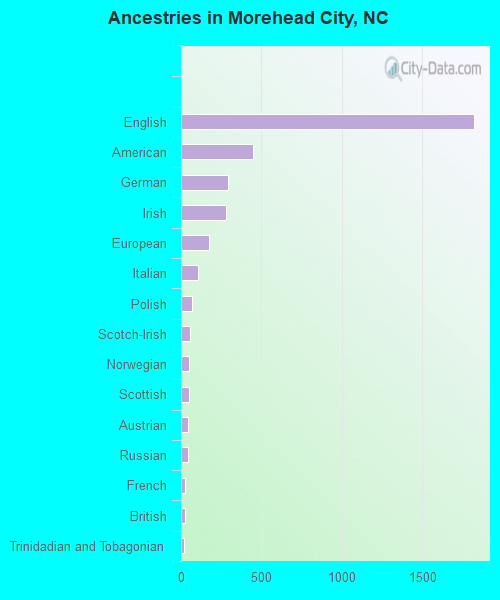
Ancestries in Morehead City

- 1,82338.2%English
- 4509.4%American
- 2936.1%German
- 2805.9%Irish
- 1733.6%European
- 1082.3%Italian
- 661.4%Polish
- 561.2%Scotch-Irish
- 481.0%Norwegian
- 471.0%Scottish
- 420.9%Austrian
- 420.9%Russian
- 240.5%French
- 220.5%British
- 180.4%Trinidadian and Tobagonian
- 140.3%Greek
- 110.2%Lebanese
- 110.2%Dutch
- 110.2%French Canadian
- 80.2%Danish
- 80.2%Scandinavian
- 60.1%Ugandan
- 40.08%Canadian
- 40.08%African
- 40.08%Ukrainian
- 30.06%Czech
- 30.06%Eastern European
- 30.06%Hungarian
- 20.04%Serbian
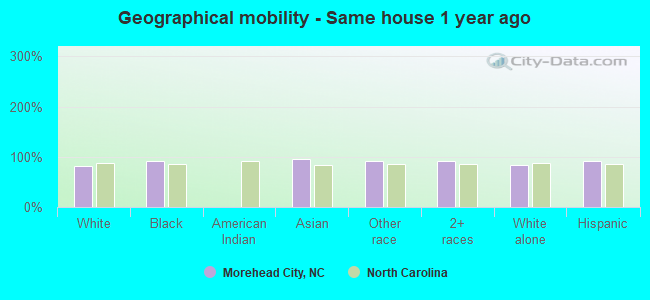
Geographical mobility in Morehead City

- Same house 1 year ago
- 6,43982.6%White (Caucasian)
- 55892.4%Black or African American
- 15295.8%Asian
- 22290.9%Other race
- 93692.1%Two or more races
- 6,38982.7%White alone, not Hispanic / Latino
- 66292.2%Hispanic or Latino
-
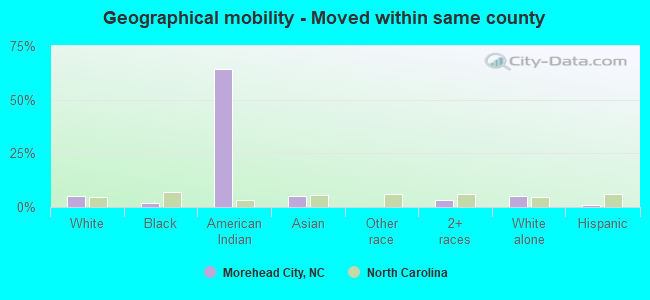
- Moved within same county
- 4135.3%White / Caucasian
- 111.8%Black or African American
- 464.3%American Indian / Alaska Native
- 85.3%Asian
- 333.2%Two or more races
- 4135.3%White alone, not Hispanic / Latino
- 50.7%Hispanic or Latino
-
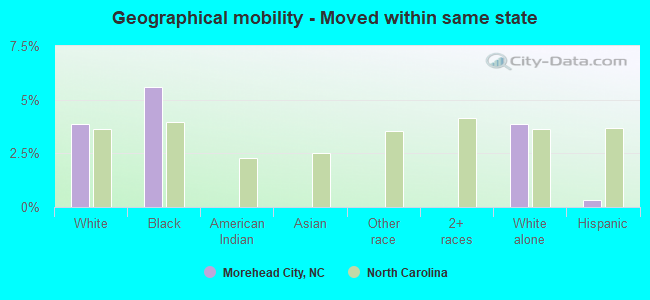
- Moved within same state
- 3003.9%White / Caucasian
- 345.6%Black or African American
- 3003.9%White alone, not Hispanic / Latino
- 20.3%Hispanic or Latino
-
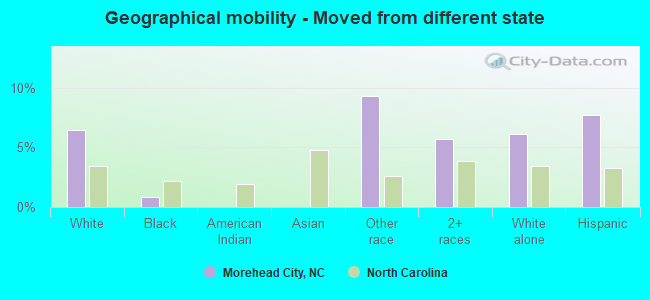
- Moved from different state
- 5016.4%White / Caucasian
- 50.9%Black or African American
- 239.3%Other race
- 585.7%Two or more races
- 4766.2%White alone, not Hispanic / Latino
- 567.7%Hispanic or Latino
-
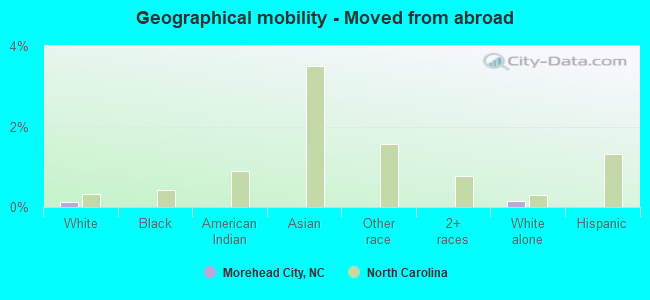
- Moved from abroad
- 90.1%White
- 110.1%White alone, not Hispanic / Latino
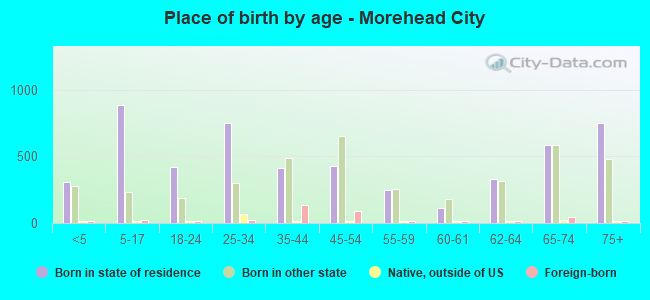
Children Nativity (place of birth) in Morehead City
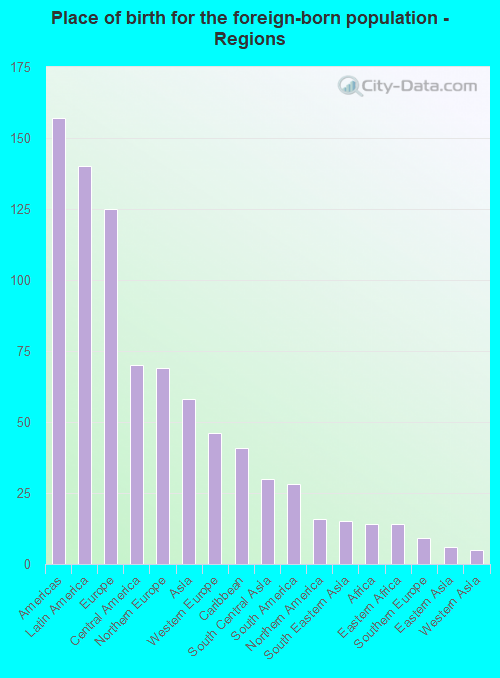
Place of birth for residents in Morehead City
![Place of birth for the foreign-born population - Regions]()
- 157Americas
- 140Latin America
- 125Europe
- 70Central America
- 69Northern Europe
- 58Asia
- 46Western Europe
- 41Caribbean
- 30South Central Asia
- 28South America
- 16Northern America
- 15South Eastern Asia
- 14Africa
- 14Eastern Africa
- 9Southern Europe
- 6Eastern Asia
- 5Western Asia
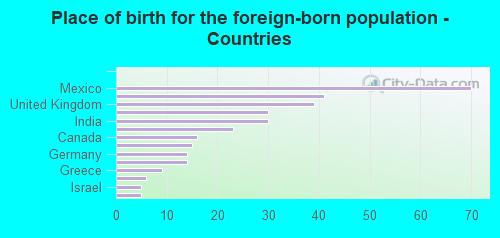
![Place of birth for the foreign-born population - Countries]()
- 70Mexico
- 41Trinidad and Tobago
- 39United Kingdom
- 30England
- 30India
- 23Peru
- 16Canada
- 15Philippines
- 14Germany
- 14Uganda
- 9Greece
- 6Japan
- 5Israel
- 5Uruguay
Grandparents responsible for own grandchildren in Morehead City
Zip codes: 28557.