Races in Mountain Home, Arkansas (AR) Detailed Stats
Data:
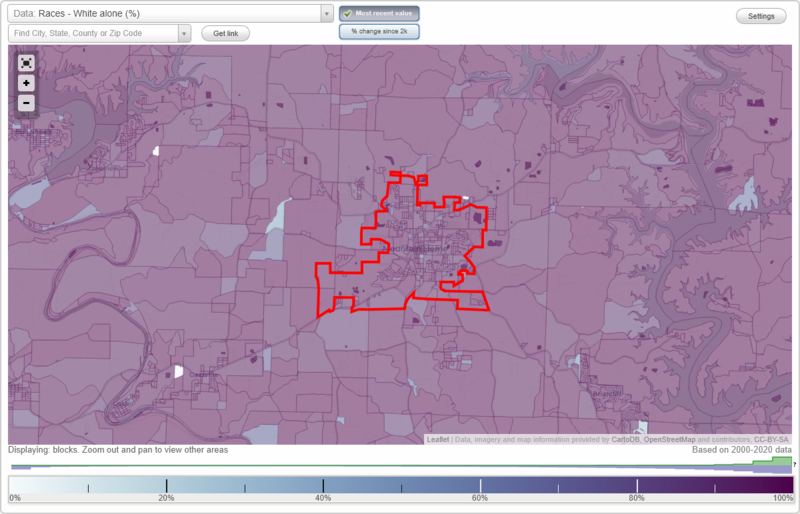
Races - White alone (%)
Races - White alone (% change since 2000)
Races - Black alone (%)
Races - Black alone (% change since 2000)
Races - American Indian alone (%)
Races - American Indian alone (% change since 2000)
Races - Asian alone (%)
Races - Asian alone (% change since 2000)
Races - Hispanic (%)
Races - Hispanic (% change since 2000)
Races - Native Hawaiian and Other Pacific Islander alone (%)
Races - Native Hawaiian and Other Pacific Islander alone (% change since 2000)
Races - Two or more races(%)
Races - Two or more races(% change since 2000)
Races - Other race alone (%)
Races - Other race alone (% change since 2000)
Racial diversity
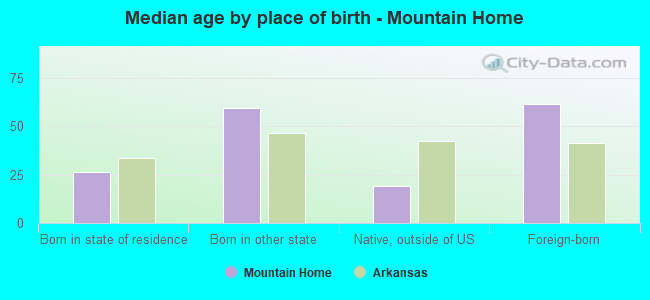
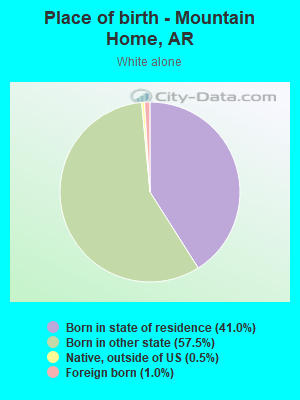
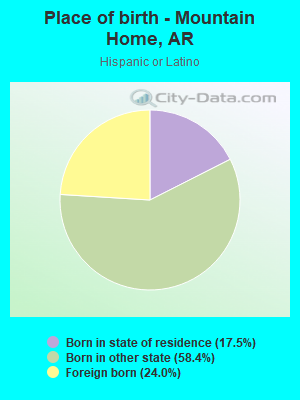
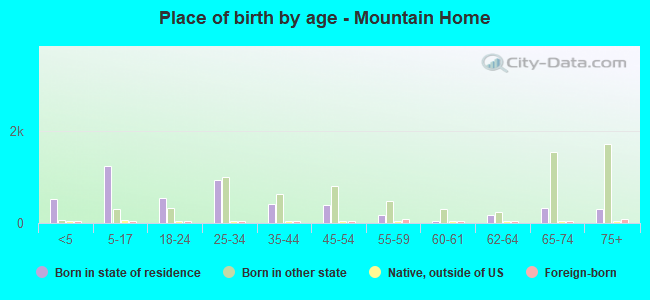
Place of birth - Born in state of residence (%)
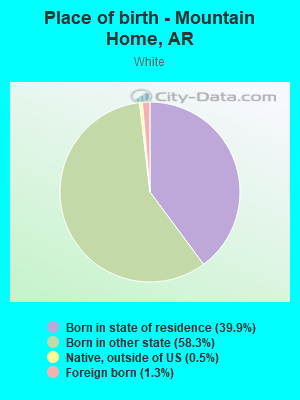
Place of birth - Born in state of residence (%) - White
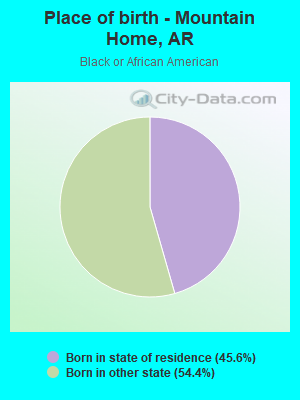
Place of birth - Born in state of residence (%) - Black or African American
Place of birth - Born in state of residence (%) - Asian
Place of birth - Born in state of residence (%) - Hispanic or Latino
Place of birth - Born in state of residence (%) - American Indian and Alaska Native
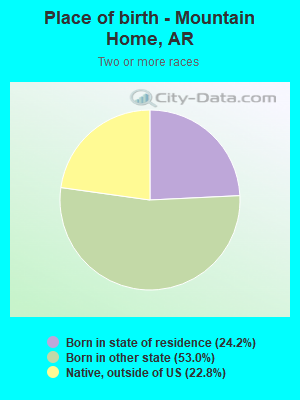
Place of birth - Born in state of residence (%) - Multirace
Place of birth - Born in state of residence (%) - Other Race
Place of birth - Born in other state (%)
Place of birth - Born in other state (%) - White
Place of birth - Born in other state (%) - Black or African American
Place of birth - Born in other state (%) - Asian
Place of birth - Born in other state (%) - Hispanic or Latino
Place of birth - Born in other state (%) - American Indian and Alaska Native
Place of birth - Born in other state (%) - Multirace
Place of birth - Born in other state (%) - Other Race
Place of birth - Native, outside of US (%)
Place of birth - Native, outside of US (%) - White
Place of birth - Native, outside of US (%) - Black or African American
Place of birth - Native, outside of US (%) - Asian
Place of birth - Native, outside of US (%) - Hispanic or Latino
Place of birth - Native, outside of US (%) - American Indian and Alaska Native
Place of birth - Native, outside of US (%) - Multirace
Place of birth - Native, outside of US (%) - Other Race
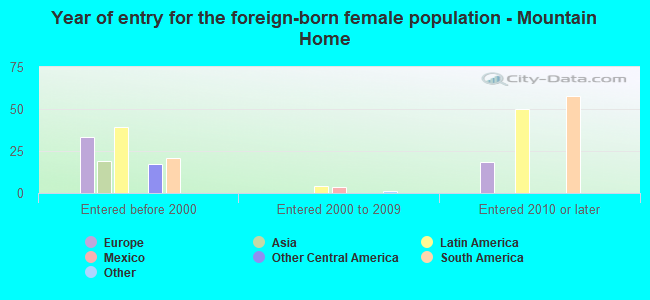
Place of birth - Foreign born (%)
Place of birth - Foreign born (%) - White
Place of birth - Foreign born (%) - Black or African American
Place of birth - Foreign born (%) - Asian
Place of birth - Foreign born (%) - Hispanic or Latino
Place of birth - Foreign born (%) - American Indian and Alaska Native
Place of birth - Foreign born (%) - Multirace
Place of birth - Foreign born (%) - Other Race
Residents speaking English at home (%)
Residents speaking English at home - Born in the United States (%)
Residents speaking English at home - Native, born elsewhere (%)
Residents speaking English at home - Foreign born (%)
Residents speaking Spanish at home (%)
Residents speaking Spanish at home - Born in the United States (%)
Residents speaking Spanish at home - Native, born elsewhere (%)
Residents speaking Spanish at home - Foreign born (%)
Residents speaking other language at home (%)
Residents speaking other language at home - Born in the United States (%)
Residents speaking other language at home - Native, born elsewhere (%)
Residents speaking other language at home - Foreign born (%)
Marital status - Never married (%)
Marital status - Now married (%)
Marital status - Separated (%)
Marital status - Widowed (%)
Marital status - Divorced (%)
Ancestries Reported - Arab (%)
Ancestries Reported - Czech (%)
Ancestries Reported - Danish (%)
Ancestries Reported - Dutch (%)
Ancestries Reported - English (%)
Ancestries Reported - French (%)
Ancestries Reported - French Canadian (%)
Ancestries Reported - German (%)
Ancestries Reported - Greek (%)
Ancestries Reported - Hungarian (%)
Ancestries Reported - Irish (%)
Ancestries Reported - Italian (%)
Ancestries Reported - Lithuanian (%)
Ancestries Reported - Norwegian (%)
Ancestries Reported - Polish (%)
Ancestries Reported - Portuguese (%)
Ancestries Reported - Russian (%)
Ancestries Reported - Scotch-Irish (%)
Ancestries Reported - Scottish (%)
Ancestries Reported - Slovak (%)
Ancestries Reported - Subsaharan African (%)
Ancestries Reported - Swedish (%)
Ancestries Reported - Swiss (%)
Ancestries Reported - Ukrainian (%)
Ancestries Reported - United States (%)
Ancestries Reported - Welsh (%)
Ancestries Reported - West Indian (%)
Ancestries Reported - Other (%)
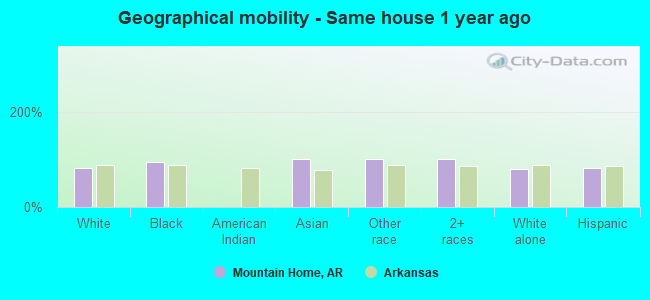
Geographical mobility - Same house 1 year ago (%)
Geographical mobility - Same house 1 year ago (%) - White
Geographical mobility - Same house 1 year ago (%) - Black or African American
Geographical mobility - Same house 1 year ago (%) - Asian
Geographical mobility - Same house 1 year ago (%) - Hispanic or Latino
Geographical mobility - Same house 1 year ago (%) - American Indian and Alaska Native
Geographical mobility - Same house 1 year ago (%) - Multirace
Geographical mobility - Same house 1 year ago (%) - Other Race
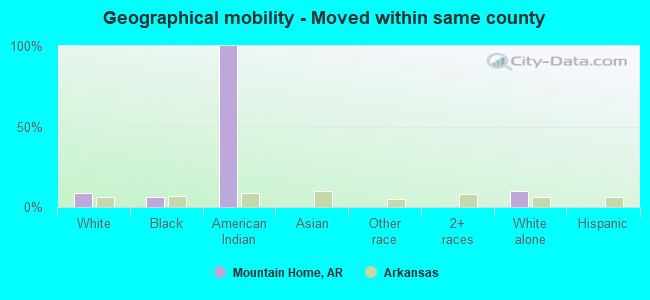
Geographical mobility - Moved within same county (%)
Geographical mobility - Moved within same county (%) - White
Geographical mobility - Moved within same county (%) - Black or African American
Geographical mobility - Moved within same county (%) - Asian
Geographical mobility - Moved within same county (%) - Hispanic or Latino
Geographical mobility - Moved within same county (%) - American Indian and Alaska Native
Geographical mobility - Moved within same county (%) - Multirace
Geographical mobility - Moved within same county (%) - Other Race
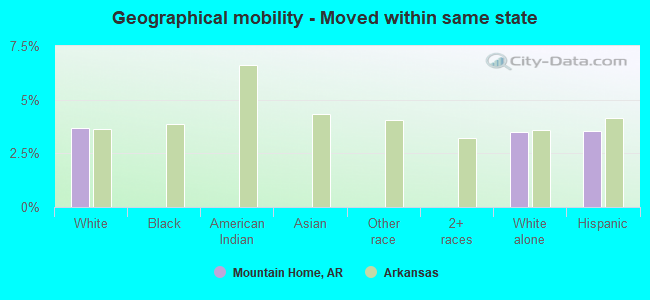
Geographical mobility - Moved from different county within same state (%)
Geographical mobility - Moved from different county within same state (%) - White
Geographical mobility - Moved from different county within same state (%) - Black or African American
Geographical mobility - Moved from different county within same state (%) - Asian
Geographical mobility - Moved from different county within same state (%) - Hispanic or Latino
Geographical mobility - Moved from different county within same state (%) - American Indian and Alaska Native
Geographical mobility - Moved from different county within same state (%) - Multirace
Geographical mobility - Moved from different county within same state (%) - Other Race
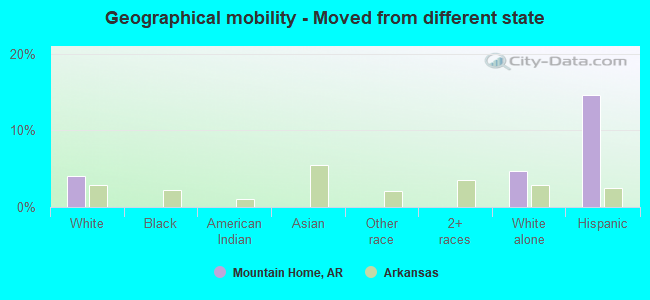
Geographical mobility - Moved from different state (%)
Geographical mobility - Moved from different state (%) - White
Geographical mobility - Moved from different state (%) - Black or African American
Geographical mobility - Moved from different state (%) - Asian
Geographical mobility - Moved from different state (%) - Hispanic or Latino
Geographical mobility - Moved from different state (%) - American Indian and Alaska Native
Geographical mobility - Moved from different state (%) - Multirace
Geographical mobility - Moved from different state (%) - Other Race
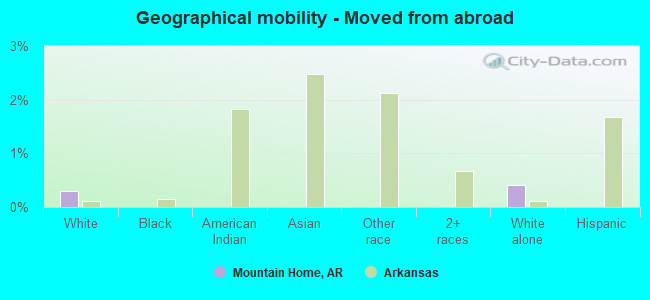
Geographical mobility - Moved from abroad (%)
Geographical mobility - Moved from abroad (%) - White
Geographical mobility - Moved from abroad (%) - Black or African American
Geographical mobility - Moved from abroad (%) - Asian
Geographical mobility - Moved from abroad (%) - Hispanic or Latino
Geographical mobility - Moved from abroad (%) - American Indian and Alaska Native
Geographical mobility - Moved from abroad (%) - Multirace
Geographical mobility - Moved from abroad (%) - Other Race
Place of birth for the foreign-born population - Ireland (%)
Place of birth for the foreign-born population - Denmark (%)
Place of birth for the foreign-born population - Norway (%)
Place of birth for the foreign-born population - Sweden (%)
Place of birth for the foreign-born population - United Kingdom (%)
Place of birth for the foreign-born population - England (%)
Place of birth for the foreign-born population - Scotland (%)
Place of birth for the foreign-born population - Other Northern Europe (%)
Place of birth for the foreign-born population - Austria (%)
Place of birth for the foreign-born population - Belgium (%)
Place of birth for the foreign-born population - France (%)
Place of birth for the foreign-born population - Germany (%)
Place of birth for the foreign-born population - Netherlands (%)
Place of birth for the foreign-born population - Switzerland (%)
Place of birth for the foreign-born population - Other Western Europe (%)
Place of birth for the foreign-born population - Greece (%)
Place of birth for the foreign-born population - Italy (%)
Place of birth for the foreign-born population - Portugal (%)
Place of birth for the foreign-born population - Spain (%)
Place of birth for the foreign-born population - Other Southern Europe (%)
Place of birth for the foreign-born population - Albania (%)
Place of birth for the foreign-born population - Belarus (%)
Place of birth for the foreign-born population - Bosnia and Herzegovina (%)
Place of birth for the foreign-born population - Bulgaria (%)
Place of birth for the foreign-born population - Croatia (%)
Place of birth for the foreign-born population - Czechoslovakia (%)
Place of birth for the foreign-born population - Hungary (%)
Place of birth for the foreign-born population - Latvia (%)
Place of birth for the foreign-born population - Lithuania (%)
Place of birth for the foreign-born population - North Macedonia (Macedonia) (%)
Place of birth for the foreign-born population - Moldova (%)
Place of birth for the foreign-born population - Poland (%)
Place of birth for the foreign-born population - Romania (%)
Place of birth for the foreign-born population - Russia (%)
Place of birth for the foreign-born population - Serbia (%)
Place of birth for the foreign-born population - Ukraine (%)
Place of birth for the foreign-born population - Other Eastern Europe (%)
Place of birth for the foreign-born population - China (%)
Place of birth for the foreign-born population - Hong Kong (%)
Place of birth for the foreign-born population - Taiwan (%)
Place of birth for the foreign-born population - Japan (%)
Place of birth for the foreign-born population - Korea (%)
Place of birth for the foreign-born population - Other Eastern Asia (%)
Place of birth for the foreign-born population - Afghanistan (%)
Place of birth for the foreign-born population - Bangladesh (%)
Place of birth for the foreign-born population - India (%)
Place of birth for the foreign-born population - Iran (%)
Place of birth for the foreign-born population - Kazakhstan (%)
Place of birth for the foreign-born population - Nepal (%)
Place of birth for the foreign-born population - Pakistan (%)
Place of birth for the foreign-born population - Sri Lanka (%)
Place of birth for the foreign-born population - Uzbekistan (%)
Place of birth for the foreign-born population - Other South Central Asia (%)
Place of birth for the foreign-born population - Burma (%)
Place of birth for the foreign-born population - Cambodia (%)
Place of birth for the foreign-born population - Indonesia (%)
Place of birth for the foreign-born population - Laos (%)
Place of birth for the foreign-born population - Malaysia (%)
Place of birth for the foreign-born population - Philippines (%)
Place of birth for the foreign-born population - Singapore (%)
Place of birth for the foreign-born population - Thailand (%)
Place of birth for the foreign-born population - Vietnam (%)
Place of birth for the foreign-born population - Other South Eastern Asia (%)
Place of birth for the foreign-born population - Armenia (%)
Place of birth for the foreign-born population - Iraq (%)
Place of birth for the foreign-born population - Israel (%)
Place of birth for the foreign-born population - Jordan (%)
Place of birth for the foreign-born population - Kuwait (%)
Place of birth for the foreign-born population - Lebanon (%)
Place of birth for the foreign-born population - Saudi Arabia (%)
Place of birth for the foreign-born population - Syria (%)
Place of birth for the foreign-born population - Turkey (%)
Place of birth for the foreign-born population - Yemen (%)
Place of birth for the foreign-born population - Other Western Asia (%)
Place of birth for the foreign-born population - Eritrea (%)
Place of birth for the foreign-born population - Ethiopia (%)
Place of birth for the foreign-born population - Kenya (%)
Place of birth for the foreign-born population - Somalia (%)
Place of birth for the foreign-born population - Uganda (%)
Place of birth for the foreign-born population - Zimbabwe (%)
Place of birth for the foreign-born population - Other Eastern Africa (%)
Place of birth for the foreign-born population - Cameroon (%)
Place of birth for the foreign-born population - Congo (%)
Place of birth for the foreign-born population - Democratic Republic of Congo (Zaire) (%)
Place of birth for the foreign-born population - Other Middle Africa (%)
Place of birth for the foreign-born population - Egypt (%)
Place of birth for the foreign-born population - Morocco (%)
Place of birth for the foreign-born population - Sudan (%)
Place of birth for the foreign-born population - Other Northern Africa (%)
Place of birth for the foreign-born population - South Africa (%)
Place of birth for the foreign-born population - Other Southern Africa (%)
Place of birth for the foreign-born population - Cabo Verde (%)
Place of birth for the foreign-born population - Ghana (%)
Place of birth for the foreign-born population - Liberia (%)
Place of birth for the foreign-born population - Nigeria (%)
Place of birth for the foreign-born population - Senegal (%)
Place of birth for the foreign-born population - Sierra Leone (%)
Place of birth for the foreign-born population - Other Western Africa (%)
Place of birth for the foreign-born population - Australia (%)
Place of birth for the foreign-born population - New Zealand (%)
Place of birth for the foreign-born population - Fiji (%)
Place of birth for the foreign-born population - Micronesia (%)
Place of birth for the foreign-born population - Bahamas (%)
Place of birth for the foreign-born population - Barbados (%)
Place of birth for the foreign-born population - Cuba (%)
Place of birth for the foreign-born population - Dominica (%)
Place of birth for the foreign-born population - Dominican Republic (%)
Place of birth for the foreign-born population - Grenada (%)
Place of birth for the foreign-born population - Haiti (%)
Place of birth for the foreign-born population - Jamaica (%)
Place of birth for the foreign-born population - St. Vincent and the Grenadines (%)
Place of birth for the foreign-born population - Trinidad and Tobago (%)
Place of birth for the foreign-born population - West Indies (%)
Place of birth for the foreign-born population - Other Caribbean (%)
Place of birth for the foreign-born population - Belize (%)
Place of birth for the foreign-born population - Costa Rica (%)
Place of birth for the foreign-born population - El Salvador (%)
Place of birth for the foreign-born population - Guatemala (%)
Place of birth for the foreign-born population - Honduras (%)
Place of birth for the foreign-born population - Mexico (%)
Place of birth for the foreign-born population - Nicaragua (%)
Place of birth for the foreign-born population - Panama (%)
Place of birth for the foreign-born population - Other Central America (%)
Place of birth for the foreign-born population - Argentina (%)
Place of birth for the foreign-born population - Bolivia (%)
Place of birth for the foreign-born population - Brazil (%)
Place of birth for the foreign-born population - Chile (%)
Place of birth for the foreign-born population - Colombia (%)
Place of birth for the foreign-born population - Ecuador (%)
Place of birth for the foreign-born population - Guyana (%)
Place of birth for the foreign-born population - Peru (%)
Place of birth for the foreign-born population - Uruguay (%)
Place of birth for the foreign-born population - Venezuela (%)
Place of birth for the foreign-born population - Other South America (%)
Place of birth for the foreign-born population - Canada (%)
Place of birth for the foreign-born population - Other Northern America (%)
Place of birth for the foreign-born population - Other (%)
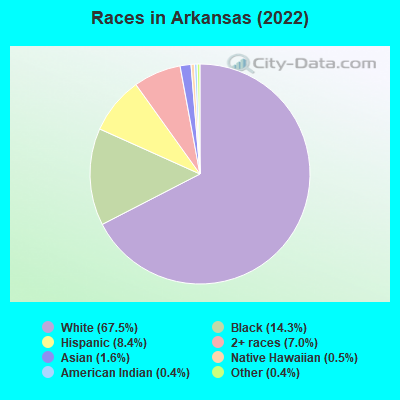
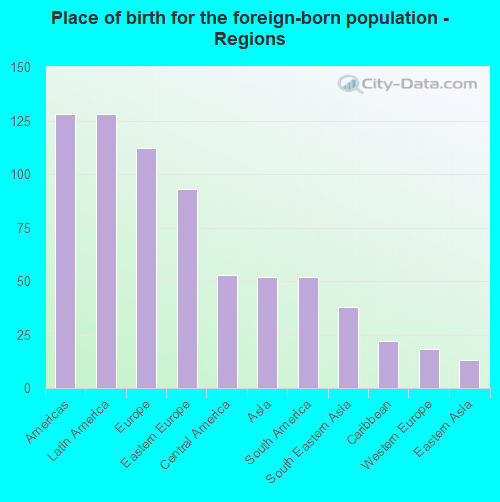
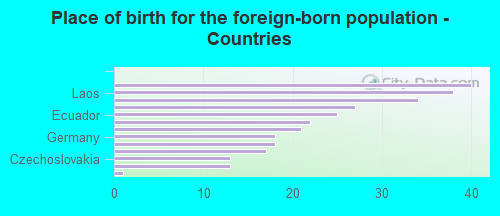
According to 2022 data, the most numerous races in Mountain Home, AR are White alone (11,312 residents), Black alone (9 residents), and Hispanic (550 residents). 97.6% of Mountain Home residents speak English at home. 2.3% of Mountain Home, AR residents are foreign-born (1.0% born in Latin America, 0.9% born in Europe, 0.4% born in Asia), which is 70.7% less than the foreign-born rate of 4.0% across the entire state of Arkansas.
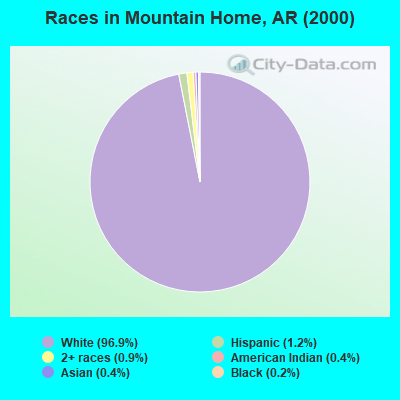
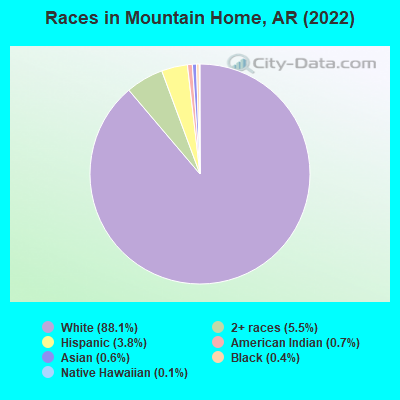
Race distribution in Mountain Home
2000 2022
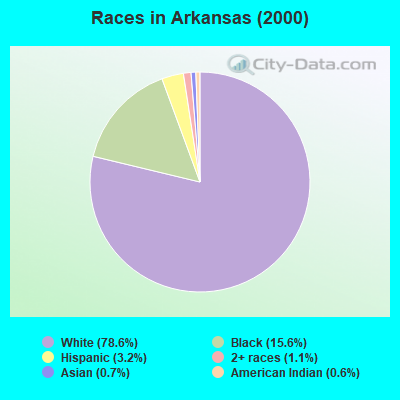
2,100,135 78.6% White alone 416,615 15.6% Black alone 86,866 3.2% Hispanic 30,364 1.1% Two or more races 19,892 0.7% Asian alone 16,702 0.6% American Indian alone 1,494 0.06% Native Hawaiian and Other 1,332 0.05% Other race alone
2,054,922 67.5% White alone 435,637 14.3% Black alone 255,416 8.4% Hispanic 213,684 7.0% Two or more races 47,592 1.6% Asian alone 14,176 0.5% Native Hawaiian and Other 12,680 0.4% American Indian alone 11,530 0.4% Other race alone
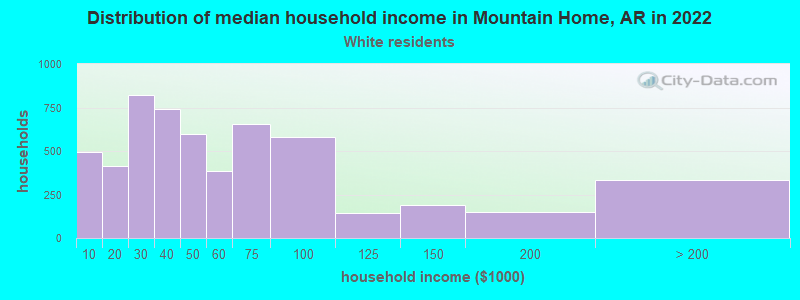
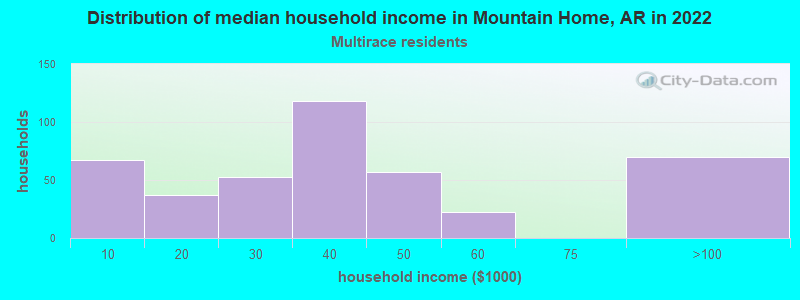
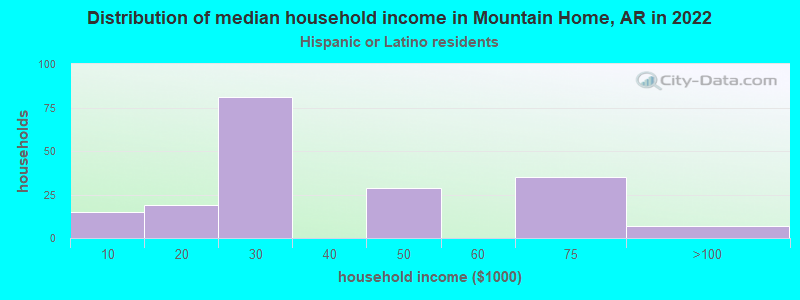
Income and house value in Mountain Home Median household income in 2022 $48,412 White non-Hispanic householders$128,797 American Indian and Alaska Native householders$47,036 Asian householders$98,142 Some other race householders$69,874 Two or more races householders$54,653 Hispanic or Latino race householdersMedian 2022 house value $224,616 White Non-Hispanic householders$366,802 American Indian or Alaska Native householders $260,096 Asian householders$226,750 Some other race householders$163,527 Two or more races householders$233,686 Hispanic or Latino householders
Median age by race in Mountain Home
47.4 Median age for White residents39.3 51.9 57.7 Median age for Black or African American residents43.5 Median age for American Indian / Alaska Native residents56.2 Median age for Asian residents83.0 Median age for Other race residents55.1 Median age for Two or more races residents20.5 62.3 48.0 Median age for White alone residents40.4 52.5 32.4 Median age for Hispanic or Latino residents33.5 32.6
Owner/renter occupied households by race in Mountain Home
House owners and renters - White residents 3,405 61.3% Owner occupied2,152 38.7% Renter occupiedHouse owners and renters - American Indian / Alaska Native residents 4 100.0% Owner occupiedHouse owners and renters - Asian residents 19 100.0% Owner occupiedHouse owners and renters - Other race residents 27 93.5% Owner occupied2 6.5% Renter occupiedHouse owners and renters - Two or more races residents 88 61.4% Owner occupied55 38.6% Renter occupiedHouse owners and renters - White alone residents 3,345 61.2% Owner occupied2,124 38.8% Renter occupiedHouse owners and renters - Hispanic or Latino residents 120 61.8% Owner occupied74 38.2% Renter occupied
Language usage in Mountain Home
English speakers - Total 97.6% of residents of Mountain Home speak English at home.
0.8% of residents speak Spanish at home 34 37.0% Speak English very well58 63.0% Speak English less than very well1.4% of residents speak other language at home 108 63.5% Speak English very well62 36.5% Speak English less than very well
English speakers - Born in the United States 98.9% of residents of Mountain Home speak English at home.
0.3% of residents speak Spanish at home 14 63.6% Speak English very well8 36.4% Speak English less than very well0.7% of residents speak other language at home 26 54.2% Speak English very well22 45.8% Speak English less than very well
English speakers - Native, born elsewhere 97.1% of residents of Mountain Home speak English at home.
English speakers - Foreign-born 46.3% of residents of Mountain Home speak English at home.
17.7% of residents speak Spanish at home 2 3.8% Speak English very well50 96.2% Speak English less than very well36.4% of residents speak other language at home 66 61.7% Speak English very well41 38.3% Speak English less than very well
White (Caucasian) - Speak only English Native:
99.5% (10,916)Foreign-born:
55.2% (86)
White (Caucasian) - Speak another language Native:
0.7% (73)Foreign-born:
47.9% (74)
White alone - Speak only English Native:
99.3% (10,581)Foreign-born:
60.7% (55)
White alone - Speak another language Native:
0.7% (78)Foreign-born:
39.3% (36)
Hispanic or Latino - Speak only English Native:
100.0% (427)Foreign-born:
64.7% (89)
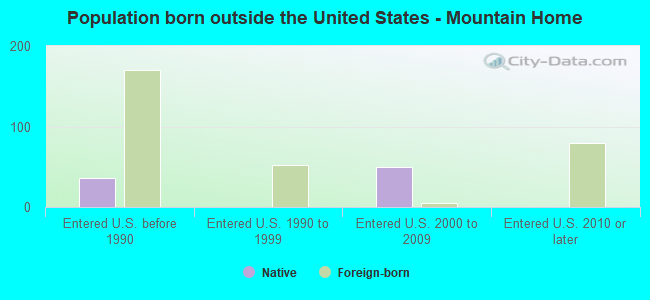
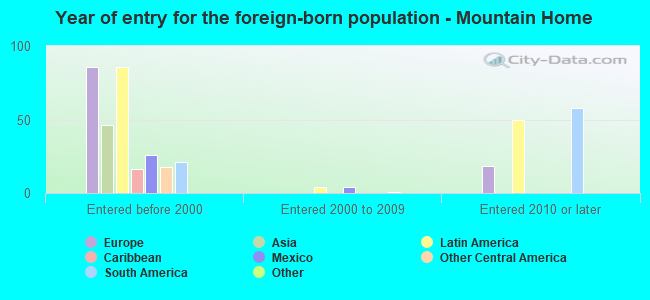
Foreign-born residents in Mountain Home 294 residents are foreign born (1.0% Latin America , 0.9% Europe , 0.4% Asia ).
This city:
2.3%Arkansas:
100.0%
Marital status for residents in Mountain Home Marital status - White (Caucasian) population 15 years and over
Males 25.3% Never married57.6% Now married3.2% Separated4.2% Widowed9.6% DivorcedFemales 13.6% Never married47.6% Now married1.3% Separated19.3% Widowed18.1% DivorcedWomen who gave birth in the past 12 months Now married:
55.1% (71)Unmarried:
44.9% (58)
Women who did not give birth in the past 12 months Now married:
52.8% (1,143)Unmarried:
47.2% (1,023)
Marital status - Asian population 15 years and over
Males 100.0% Never married0.0% Now married0.0% Separated0.0% Widowed0.0% DivorcedFemales 38.1% Never married61.9% Now married0.0% Separated0.0% Widowed0.0% DivorcedWomen who did not give birth in the past 12 months Now married:
0.0% (0)Unmarried:
100.0% (8)
Marital status - Two or more races population 15 years and over
Males 64.9% Never married18.9% Now married0.0% Separated0.0% Widowed16.2% DivorcedFemales 26.8% Never married55.4% Now married0.0% Separated0.0% Widowed17.9% DivorcedWomen who did not give birth in the past 12 months Now married:
51.6% (47)Unmarried:
48.4% (44)
Marital status - White alone, not Hispanic / Latino population 15 years and over
Males 24.1% Never married58.3% Now married3.4% Separated4.4% Widowed9.8% DivorcedFemales 13.6% Never married46.5% Now married1.4% Separated19.6% Widowed18.8% DivorcedWomen who gave birth in the past 12 months Now married:
55.1% (72)Unmarried:
44.9% (58)
Women who did not give birth in the past 12 months Now married:
50.8% (1,041)Unmarried:
49.2% (1,008)
Marital status - Hispanic or Latino population 15 years and over
Males 49.5% Never married44.1% Now married0.0% Separated0.0% Widowed6.3% DivorcedFemales 13.7% Never married76.4% Now married0.0% Separated9.9% Widowed0.0% DivorcedWomen who did not give birth in the past 12 months Now married:
78.3% (139)Unmarried:
21.7% (38)
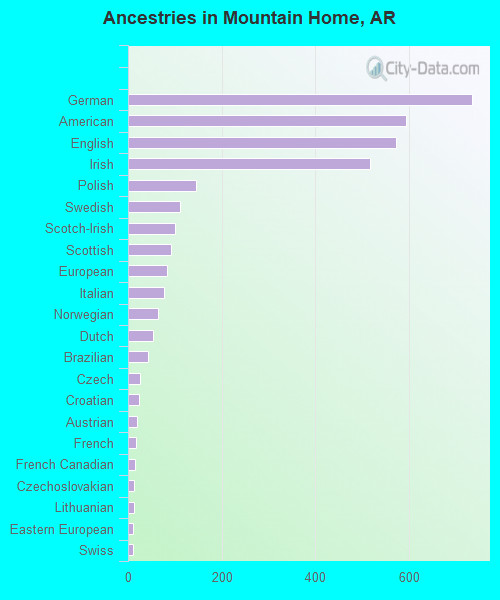
Ancestries in Mountain Home
863 17.3% American858 17.2% English734 14.7% German559 11.2% Irish223 4.5% European192 3.8% Italian178 3.6% Polish173 3.5% Scottish37 0.7% Scotch-Irish30 0.6% Dutch27 0.5% Swedish24 0.5% British23 0.5% Eastern European21 0.4% Romanian14 0.3% Austrian14 0.3% Czech12 0.2% Croatian11 0.2% Yugoslavian8 0.2% French Canadian7 0.1% Welsh3 0.06% Swiss
Children Nativity (place of birth) in Mountain Home
Children under 6 years - Living with two parents Both parents native 533 100.0% NativeChildren under 6 years - Living with one parent Native parent 101 100.0% Native
Children 6 to 17 years - Living with two parents Both parents native 957 100.0% NativeChildren 6 to 17 years - Living with one parent Native parent 282 100.0% Native
Grandparents responsible for own grandchildren in Mountain Home
Grandparents (30 to 59 years) White / Caucasian 19 26.7% Responsible for grandchildren53 73.3% Not responsible for grandchildrenWhite alone, not Hispanic / Latino 19 25.5% Responsible for grandchildren57 74.5% Not responsible for grandchildrenGrandparents (60 years and over) White / Caucasian 43 44.5% Responsible for grandchildren54 55.5% Not responsible for grandchildrenWhite alone, not Hispanic / Latino 43 44.3% Responsible for grandchildren54 55.7% Not responsible for grandchildren