Races in New Haven, Indiana (IN) Detailed Stats
Data:
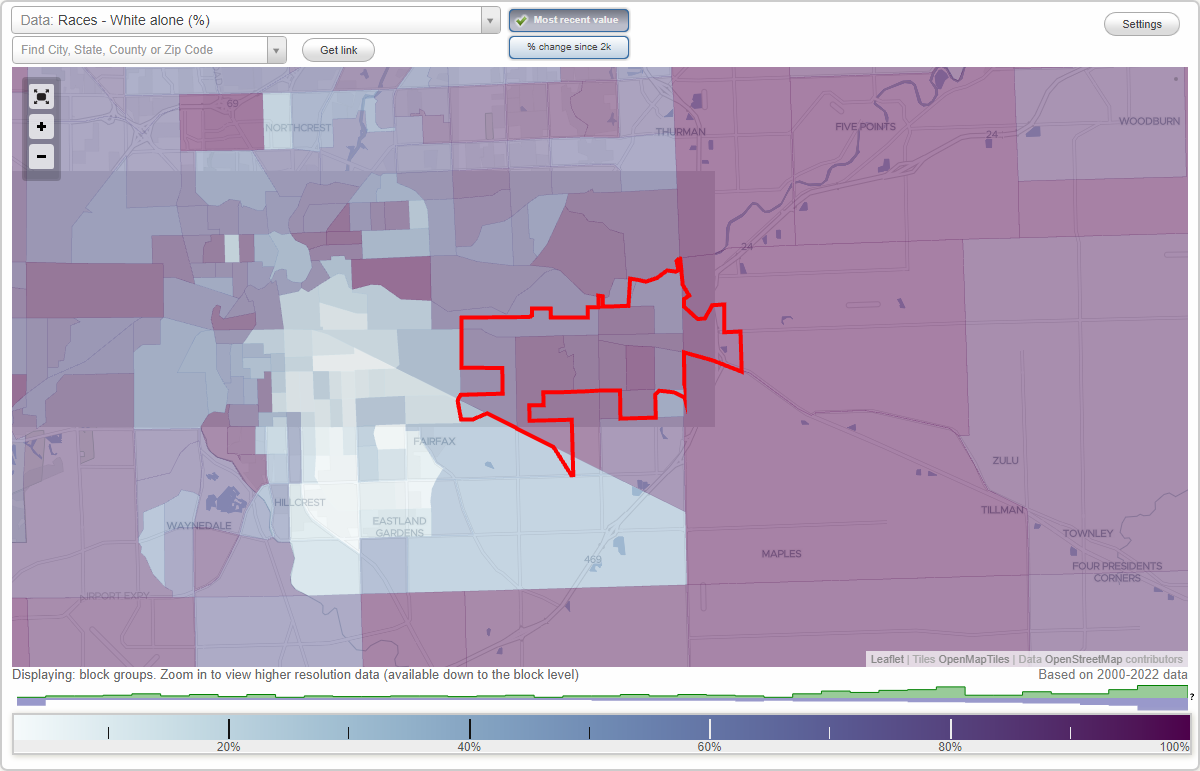
Races - White alone (%)
Races - White alone (% change since 2000)
Races - Black alone (%)
Races - Black alone (% change since 2000)
Races - American Indian alone (%)
Races - American Indian alone (% change since 2000)
Races - Asian alone (%)
Races - Asian alone (% change since 2000)
Races - Hispanic (%)
Races - Hispanic (% change since 2000)
Races - Native Hawaiian and Other Pacific Islander alone (%)
Races - Native Hawaiian and Other Pacific Islander alone (% change since 2000)
Races - Two or more races(%)
Races - Two or more races(% change since 2000)
Races - Other race alone (%)
Races - Other race alone (% change since 2000)
Racial diversity
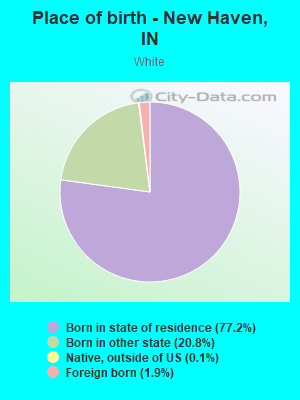
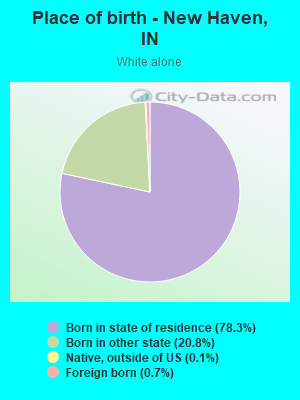
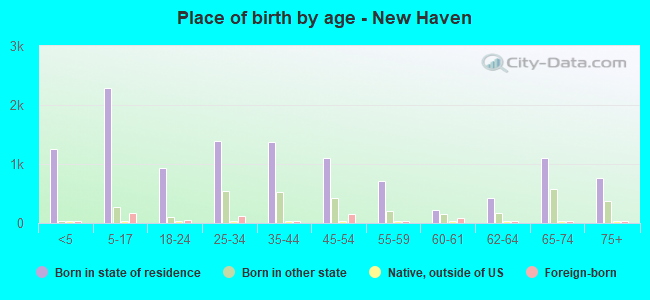
Place of birth - Born in state of residence (%)
Place of birth - Born in state of residence (%) - White
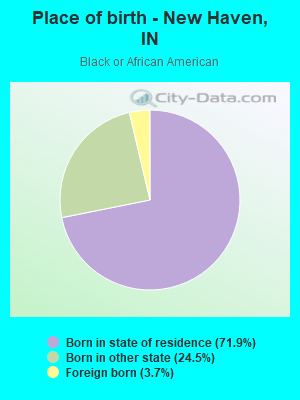
Place of birth - Born in state of residence (%) - Black or African American
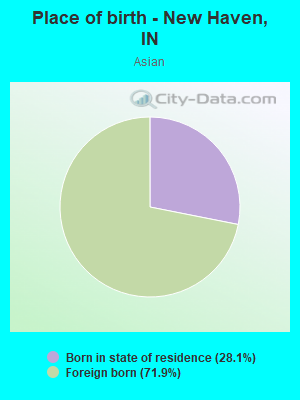
Place of birth - Born in state of residence (%) - Asian
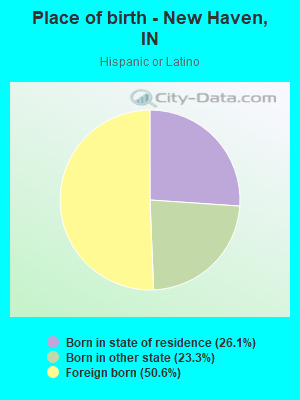
Place of birth - Born in state of residence (%) - Hispanic or Latino
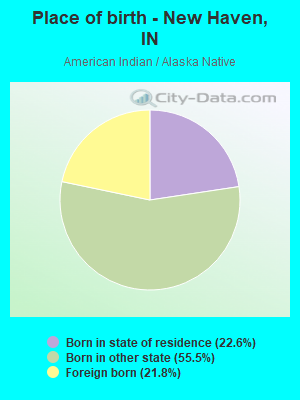
Place of birth - Born in state of residence (%) - American Indian and Alaska Native
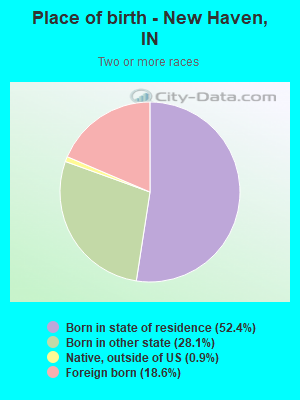
Place of birth - Born in state of residence (%) - Multirace
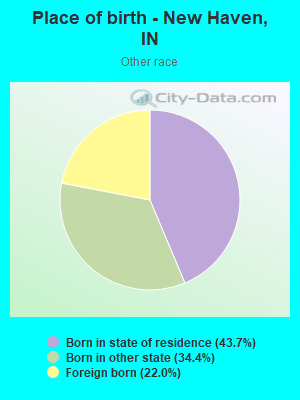
Place of birth - Born in state of residence (%) - Other Race
Place of birth - Born in other state (%)
Place of birth - Born in other state (%) - White
Place of birth - Born in other state (%) - Black or African American
Place of birth - Born in other state (%) - Asian
Place of birth - Born in other state (%) - Hispanic or Latino
Place of birth - Born in other state (%) - American Indian and Alaska Native
Place of birth - Born in other state (%) - Multirace
Place of birth - Born in other state (%) - Other Race
Place of birth - Native, outside of US (%)
Place of birth - Native, outside of US (%) - White
Place of birth - Native, outside of US (%) - Black or African American
Place of birth - Native, outside of US (%) - Asian
Place of birth - Native, outside of US (%) - Hispanic or Latino
Place of birth - Native, outside of US (%) - American Indian and Alaska Native
Place of birth - Native, outside of US (%) - Multirace
Place of birth - Native, outside of US (%) - Other Race
Place of birth - Foreign born (%)
Place of birth - Foreign born (%) - White
Place of birth - Foreign born (%) - Black or African American
Place of birth - Foreign born (%) - Asian
Place of birth - Foreign born (%) - Hispanic or Latino
Place of birth - Foreign born (%) - American Indian and Alaska Native
Place of birth - Foreign born (%) - Multirace
Place of birth - Foreign born (%) - Other Race
Residents speaking English at home (%)
Residents speaking English at home - Born in the United States (%)
Residents speaking English at home - Native, born elsewhere (%)
Residents speaking English at home - Foreign born (%)
Residents speaking Spanish at home (%)
Residents speaking Spanish at home - Born in the United States (%)
Residents speaking Spanish at home - Native, born elsewhere (%)
Residents speaking Spanish at home - Foreign born (%)
Residents speaking other language at home (%)
Residents speaking other language at home - Born in the United States (%)
Residents speaking other language at home - Native, born elsewhere (%)
Residents speaking other language at home - Foreign born (%)
Marital status - Never married (%)
Marital status - Now married (%)
Marital status - Separated (%)
Marital status - Widowed (%)
Marital status - Divorced (%)
Ancestries Reported - Arab (%)
Ancestries Reported - Czech (%)
Ancestries Reported - Danish (%)
Ancestries Reported - Dutch (%)
Ancestries Reported - English (%)
Ancestries Reported - French (%)
Ancestries Reported - French Canadian (%)
Ancestries Reported - German (%)
Ancestries Reported - Greek (%)
Ancestries Reported - Hungarian (%)
Ancestries Reported - Irish (%)
Ancestries Reported - Italian (%)
Ancestries Reported - Lithuanian (%)
Ancestries Reported - Norwegian (%)
Ancestries Reported - Polish (%)
Ancestries Reported - Portuguese (%)
Ancestries Reported - Russian (%)
Ancestries Reported - Scotch-Irish (%)
Ancestries Reported - Scottish (%)
Ancestries Reported - Slovak (%)
Ancestries Reported - Subsaharan African (%)
Ancestries Reported - Swedish (%)
Ancestries Reported - Swiss (%)
Ancestries Reported - Ukrainian (%)
Ancestries Reported - United States (%)
Ancestries Reported - Welsh (%)
Ancestries Reported - West Indian (%)
Ancestries Reported - Other (%)
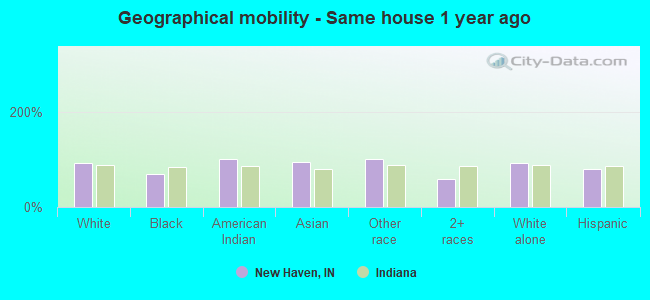
Geographical mobility - Same house 1 year ago (%)
Geographical mobility - Same house 1 year ago (%) - White
Geographical mobility - Same house 1 year ago (%) - Black or African American
Geographical mobility - Same house 1 year ago (%) - Asian
Geographical mobility - Same house 1 year ago (%) - Hispanic or Latino
Geographical mobility - Same house 1 year ago (%) - American Indian and Alaska Native
Geographical mobility - Same house 1 year ago (%) - Multirace
Geographical mobility - Same house 1 year ago (%) - Other Race
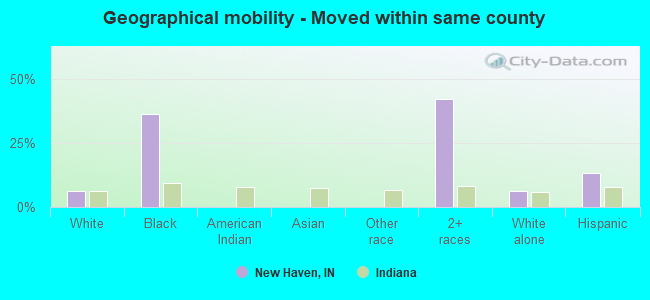
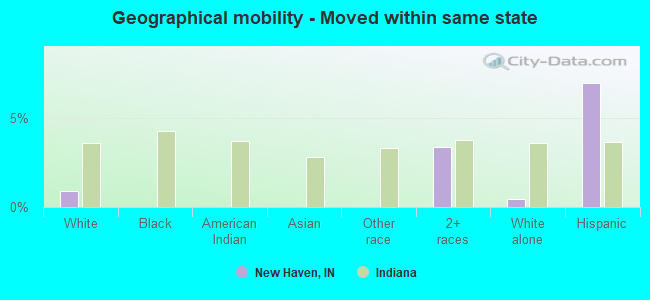
Geographical mobility - Moved within same county (%)
Geographical mobility - Moved within same county (%) - White
Geographical mobility - Moved within same county (%) - Black or African American
Geographical mobility - Moved within same county (%) - Asian
Geographical mobility - Moved within same county (%) - Hispanic or Latino
Geographical mobility - Moved within same county (%) - American Indian and Alaska Native
Geographical mobility - Moved within same county (%) - Multirace
Geographical mobility - Moved within same county (%) - Other Race
Geographical mobility - Moved from different county within same state (%)
Geographical mobility - Moved from different county within same state (%) - White
Geographical mobility - Moved from different county within same state (%) - Black or African American
Geographical mobility - Moved from different county within same state (%) - Asian
Geographical mobility - Moved from different county within same state (%) - Hispanic or Latino
Geographical mobility - Moved from different county within same state (%) - American Indian and Alaska Native
Geographical mobility - Moved from different county within same state (%) - Multirace
Geographical mobility - Moved from different county within same state (%) - Other Race
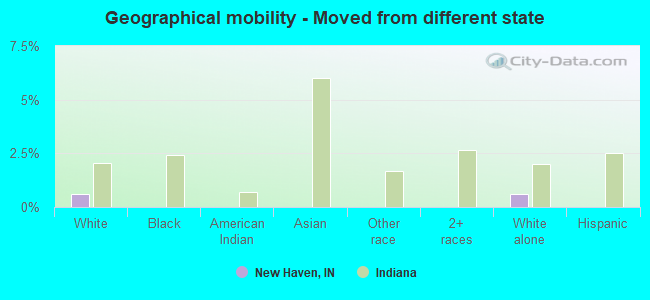
Geographical mobility - Moved from different state (%)
Geographical mobility - Moved from different state (%) - White
Geographical mobility - Moved from different state (%) - Black or African American
Geographical mobility - Moved from different state (%) - Asian
Geographical mobility - Moved from different state (%) - Hispanic or Latino
Geographical mobility - Moved from different state (%) - American Indian and Alaska Native
Geographical mobility - Moved from different state (%) - Multirace
Geographical mobility - Moved from different state (%) - Other Race
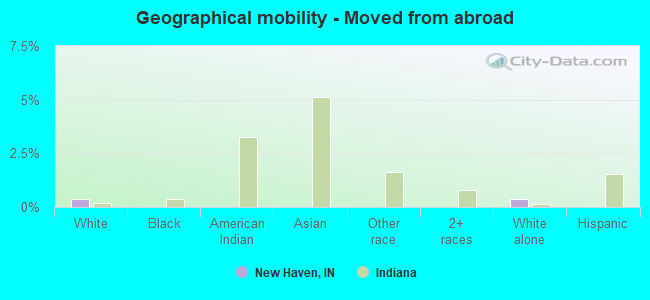
Geographical mobility - Moved from abroad (%)
Geographical mobility - Moved from abroad (%) - White
Geographical mobility - Moved from abroad (%) - Black or African American
Geographical mobility - Moved from abroad (%) - Asian
Geographical mobility - Moved from abroad (%) - Hispanic or Latino
Geographical mobility - Moved from abroad (%) - American Indian and Alaska Native
Geographical mobility - Moved from abroad (%) - Multirace
Geographical mobility - Moved from abroad (%) - Other Race
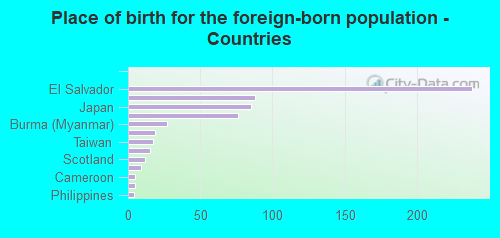
Place of birth for the foreign-born population - Ireland (%)
Place of birth for the foreign-born population - Denmark (%)
Place of birth for the foreign-born population - Norway (%)
Place of birth for the foreign-born population - Sweden (%)
Place of birth for the foreign-born population - United Kingdom (%)
Place of birth for the foreign-born population - England (%)
Place of birth for the foreign-born population - Scotland (%)
Place of birth for the foreign-born population - Other Northern Europe (%)
Place of birth for the foreign-born population - Austria (%)
Place of birth for the foreign-born population - Belgium (%)
Place of birth for the foreign-born population - France (%)
Place of birth for the foreign-born population - Germany (%)
Place of birth for the foreign-born population - Netherlands (%)
Place of birth for the foreign-born population - Switzerland (%)
Place of birth for the foreign-born population - Other Western Europe (%)
Place of birth for the foreign-born population - Greece (%)
Place of birth for the foreign-born population - Italy (%)
Place of birth for the foreign-born population - Portugal (%)
Place of birth for the foreign-born population - Spain (%)
Place of birth for the foreign-born population - Other Southern Europe (%)
Place of birth for the foreign-born population - Albania (%)
Place of birth for the foreign-born population - Belarus (%)
Place of birth for the foreign-born population - Bosnia and Herzegovina (%)
Place of birth for the foreign-born population - Bulgaria (%)
Place of birth for the foreign-born population - Croatia (%)
Place of birth for the foreign-born population - Czechoslovakia (%)
Place of birth for the foreign-born population - Hungary (%)
Place of birth for the foreign-born population - Latvia (%)
Place of birth for the foreign-born population - Lithuania (%)
Place of birth for the foreign-born population - North Macedonia (Macedonia) (%)
Place of birth for the foreign-born population - Moldova (%)
Place of birth for the foreign-born population - Poland (%)
Place of birth for the foreign-born population - Romania (%)
Place of birth for the foreign-born population - Russia (%)
Place of birth for the foreign-born population - Serbia (%)
Place of birth for the foreign-born population - Ukraine (%)
Place of birth for the foreign-born population - Other Eastern Europe (%)
Place of birth for the foreign-born population - China (%)
Place of birth for the foreign-born population - Hong Kong (%)
Place of birth for the foreign-born population - Taiwan (%)
Place of birth for the foreign-born population - Japan (%)
Place of birth for the foreign-born population - Korea (%)
Place of birth for the foreign-born population - Other Eastern Asia (%)
Place of birth for the foreign-born population - Afghanistan (%)
Place of birth for the foreign-born population - Bangladesh (%)
Place of birth for the foreign-born population - India (%)
Place of birth for the foreign-born population - Iran (%)
Place of birth for the foreign-born population - Kazakhstan (%)
Place of birth for the foreign-born population - Nepal (%)
Place of birth for the foreign-born population - Pakistan (%)
Place of birth for the foreign-born population - Sri Lanka (%)
Place of birth for the foreign-born population - Uzbekistan (%)
Place of birth for the foreign-born population - Other South Central Asia (%)
Place of birth for the foreign-born population - Burma (%)
Place of birth for the foreign-born population - Cambodia (%)
Place of birth for the foreign-born population - Indonesia (%)
Place of birth for the foreign-born population - Laos (%)
Place of birth for the foreign-born population - Malaysia (%)
Place of birth for the foreign-born population - Philippines (%)
Place of birth for the foreign-born population - Singapore (%)
Place of birth for the foreign-born population - Thailand (%)
Place of birth for the foreign-born population - Vietnam (%)
Place of birth for the foreign-born population - Other South Eastern Asia (%)
Place of birth for the foreign-born population - Armenia (%)
Place of birth for the foreign-born population - Iraq (%)
Place of birth for the foreign-born population - Israel (%)
Place of birth for the foreign-born population - Jordan (%)
Place of birth for the foreign-born population - Kuwait (%)
Place of birth for the foreign-born population - Lebanon (%)
Place of birth for the foreign-born population - Saudi Arabia (%)
Place of birth for the foreign-born population - Syria (%)
Place of birth for the foreign-born population - Turkey (%)
Place of birth for the foreign-born population - Yemen (%)
Place of birth for the foreign-born population - Other Western Asia (%)
Place of birth for the foreign-born population - Eritrea (%)
Place of birth for the foreign-born population - Ethiopia (%)
Place of birth for the foreign-born population - Kenya (%)
Place of birth for the foreign-born population - Somalia (%)
Place of birth for the foreign-born population - Uganda (%)
Place of birth for the foreign-born population - Zimbabwe (%)
Place of birth for the foreign-born population - Other Eastern Africa (%)
Place of birth for the foreign-born population - Cameroon (%)
Place of birth for the foreign-born population - Congo (%)
Place of birth for the foreign-born population - Democratic Republic of Congo (Zaire) (%)
Place of birth for the foreign-born population - Other Middle Africa (%)
Place of birth for the foreign-born population - Egypt (%)
Place of birth for the foreign-born population - Morocco (%)
Place of birth for the foreign-born population - Sudan (%)
Place of birth for the foreign-born population - Other Northern Africa (%)
Place of birth for the foreign-born population - South Africa (%)
Place of birth for the foreign-born population - Other Southern Africa (%)
Place of birth for the foreign-born population - Cabo Verde (%)
Place of birth for the foreign-born population - Ghana (%)
Place of birth for the foreign-born population - Liberia (%)
Place of birth for the foreign-born population - Nigeria (%)
Place of birth for the foreign-born population - Senegal (%)
Place of birth for the foreign-born population - Sierra Leone (%)
Place of birth for the foreign-born population - Other Western Africa (%)
Place of birth for the foreign-born population - Australia (%)
Place of birth for the foreign-born population - New Zealand (%)
Place of birth for the foreign-born population - Fiji (%)
Place of birth for the foreign-born population - Micronesia (%)
Place of birth for the foreign-born population - Bahamas (%)
Place of birth for the foreign-born population - Barbados (%)
Place of birth for the foreign-born population - Cuba (%)
Place of birth for the foreign-born population - Dominica (%)
Place of birth for the foreign-born population - Dominican Republic (%)
Place of birth for the foreign-born population - Grenada (%)
Place of birth for the foreign-born population - Haiti (%)
Place of birth for the foreign-born population - Jamaica (%)
Place of birth for the foreign-born population - St. Vincent and the Grenadines (%)
Place of birth for the foreign-born population - Trinidad and Tobago (%)
Place of birth for the foreign-born population - West Indies (%)
Place of birth for the foreign-born population - Other Caribbean (%)
Place of birth for the foreign-born population - Belize (%)
Place of birth for the foreign-born population - Costa Rica (%)
Place of birth for the foreign-born population - El Salvador (%)
Place of birth for the foreign-born population - Guatemala (%)
Place of birth for the foreign-born population - Honduras (%)
Place of birth for the foreign-born population - Mexico (%)
Place of birth for the foreign-born population - Nicaragua (%)
Place of birth for the foreign-born population - Panama (%)
Place of birth for the foreign-born population - Other Central America (%)
Place of birth for the foreign-born population - Argentina (%)
Place of birth for the foreign-born population - Bolivia (%)
Place of birth for the foreign-born population - Brazil (%)
Place of birth for the foreign-born population - Chile (%)
Place of birth for the foreign-born population - Colombia (%)
Place of birth for the foreign-born population - Ecuador (%)
Place of birth for the foreign-born population - Guyana (%)
Place of birth for the foreign-born population - Peru (%)
Place of birth for the foreign-born population - Uruguay (%)
Place of birth for the foreign-born population - Venezuela (%)
Place of birth for the foreign-born population - Other South America (%)
Place of birth for the foreign-born population - Canada (%)
Place of birth for the foreign-born population - Other Northern America (%)
Place of birth for the foreign-born population - Other (%)
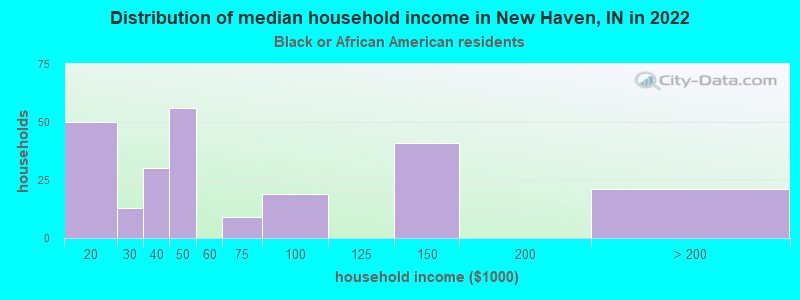
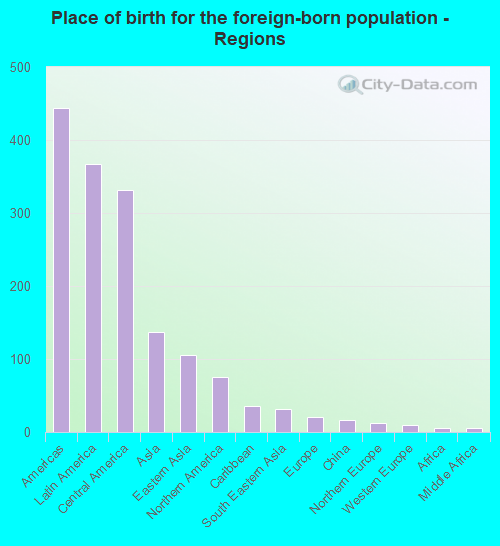
According to 2022 data, the most numerous races in New Haven, IN are White alone (13,493 residents), Black alone (642 residents), and Hispanic (750 residents). 94.1% of New Haven residents speak English at home. 3.8% of New Haven, IN residents are foreign-born (2.2% born in Latin America, 0.8% born in Asia, 0.4% born in North America), which is 55.9% less than the foreign-born rate of 6.0% across the entire state of Indiana.
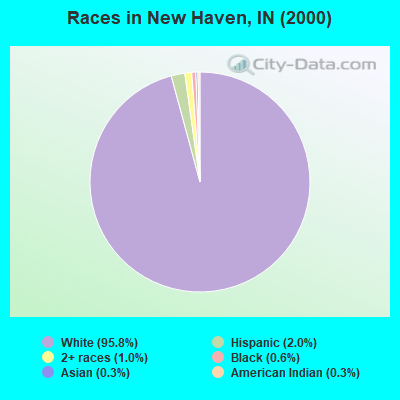
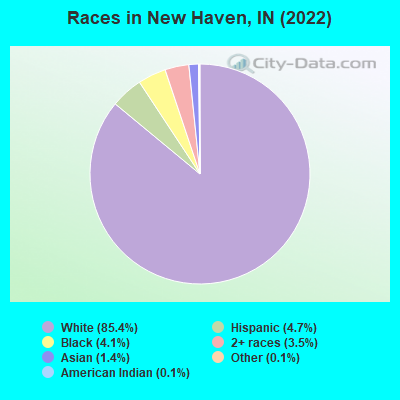
Race distribution in New Haven
2000 2022
5,219,373 85.8% White alone 505,462 8.3% Black alone 214,536 3.5% Hispanic 61,115 1.0% Two or more races 58,424 1.0% Asian alone 13,654 0.2% American Indian alone 6,348 0.1% Other race alone 1,573 0.03% Native Hawaiian and Other
5,192,455 76.0% White alone 628,054 9.2% Black alone 534,528 7.8% Hispanic 263,242 3.9% Two or more races 172,880 2.5% Asian alone 33,467 0.5% Other race alone 5,866 0.09% American Indian alone 2,545 0.04% Native Hawaiian and Other
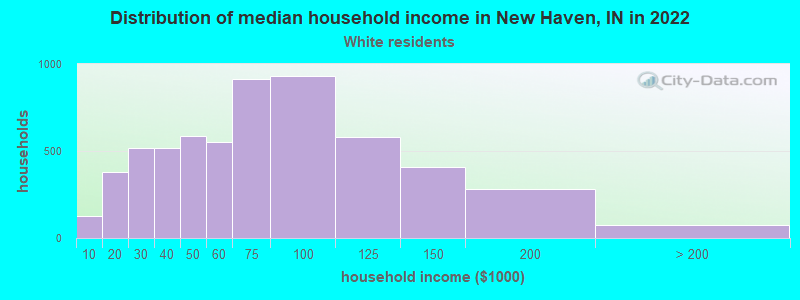
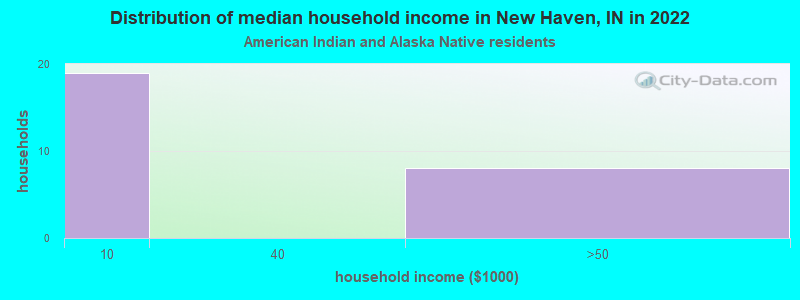
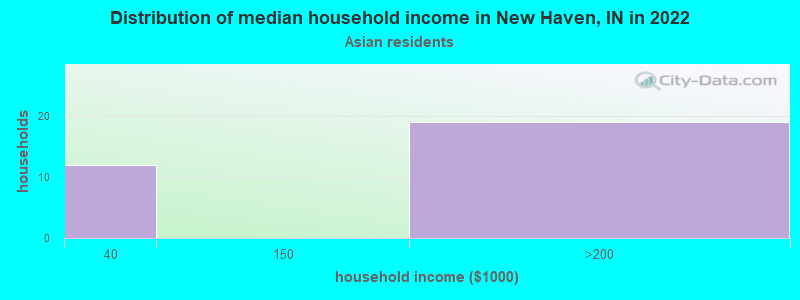
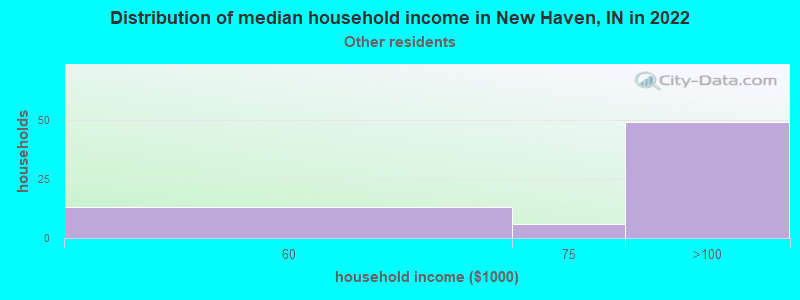
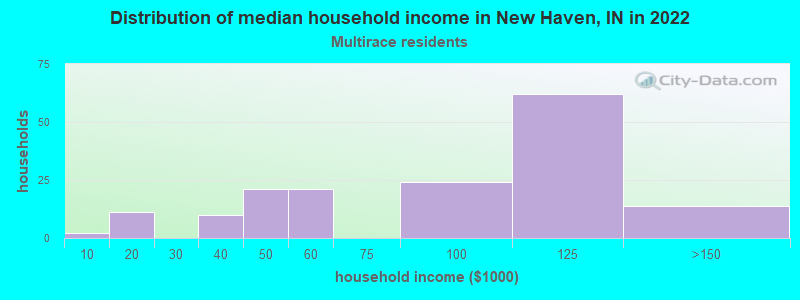
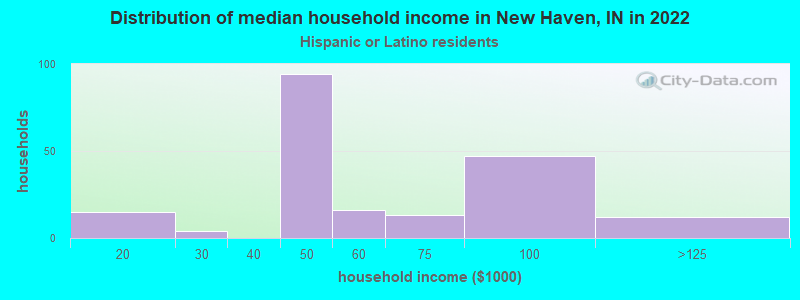
Income and house value in New Haven Median household income in 2022 $63,213 White non-Hispanic householders$40,288 Black householders$60,986 American Indian and Alaska Native householders$143,351 Asian householders$74,971 Some other race householders$95,611 Two or more races householders$72,394 Hispanic or Latino race householdersMedian 2022 house value $172,423 White Non-Hispanic householders$146,649 Black or African American householders $181,089 Asian householders$176,423 Some other race householders$205,530 Two or more races householders$167,979 Hispanic or Latino householders
Median age by race in New Haven
39.4 Median age for White residents38.0 40.6 34.5 Median age for Black or African American residents44.4 25.5 33.8 Median age for American Indian / Alaska Native residents71.4 34.2 37.7 Median age for Asian residents38.8 60.6 -564,683,663.3 Median age for Native Hawaiian / Pacific Islander residents-644,025,156.6 -673,423,422.8 20.0 Median age for Other race residents20.1 -533,769,062.6 26.6 Median age for Two or more races residents34.1 20.4 39.6 Median age for White alone residents38.2 40.8 23.4 Median age for Hispanic or Latino residents24.5 23.5
Owner/renter occupied households by race in New Haven
House owners and renters - White residents 4,614 77.1% Owner occupied1,369 22.9% Renter occupiedHouse owners and renters - Black or African American residents 123 51.9% Owner occupied114 48.1% Renter occupiedHouse owners and renters - American Indian / Alaska Native residents 5 48.4% Owner occupied5 51.6% Renter occupiedHouse owners and renters - Asian residents 45 100.0% Owner occupiedHouse owners and renters - Other race residents 50 70.2% Owner occupied21 29.8% Renter occupiedHouse owners and renters - Two or more races residents 144 79.4% Owner occupied37 20.6% Renter occupiedHouse owners and renters - White alone residents 4,620 76.9% Owner occupied1,385 23.1% Renter occupiedHouse owners and renters - Hispanic or Latino residents 151 80.8% Owner occupied36 19.2% Renter occupied
Language usage in New Haven
English speakers - Total 94.1% of residents of New Haven speak English at home.
3.5% of residents speak Spanish at home 367 71.7% Speak English very well145 28.3% Speak English less than very well2.1% of residents speak other language at home 227 73.0% Speak English very well84 27.0% Speak English less than very well
English speakers - Born in the United States 93.9% of residents of New Haven speak English at home.
2.8% of residents speak Spanish at home 43 45.7% Speak English very well51 54.3% Speak English less than very well1.9% of residents speak other language at home 56 87.5% Speak English very well8 12.5% Speak English less than very well
All residents speak only English at home
English speakers - Foreign-born 30.0% of residents of New Haven speak English at home.
46.8% of residents speak Spanish at home 256 83.4% Speak English very well51 16.6% Speak English less than very well19.5% of residents speak other language at home 85 66.4% Speak English very well43 33.6% Speak English less than very well
White (Caucasian) - Speak only English Native:
99.3% (12,192)Foreign-born:
35.2% (91)
White (Caucasian) - Speak another language Native:
1.2% (151)Foreign-born:
63.9% (166)
Black or African American - Speak only English Native:
99.5% (523)Foreign-born:
14.8% (5)
American Indian / Alaska Native - Speak another language Native:
32.7% (11)Foreign-born:
100.0% (9)
Asian - Speak another language Native:
100.0% (64)Foreign-born:
74.0% (107)
Other race - Speak another language Native:
42.0% (59)Foreign-born:
93.7% (35)
Two or more races - Speak only English Native:
90.7% (496)Foreign-born:
21.6% (32)
Two or more races - Speak another language Native:
5.7% (31)Foreign-born:
79.1% (118)
White alone - Speak only English Native:
99.0% (12,220)Foreign-born:
100.0% (97)
Hispanic or Latino - Speak only English Native:
53.6% (162)Foreign-born:
6.4% (26)
Hispanic or Latino - Speak another language Native:
46.5% (140)Foreign-born:
92.2% (371)
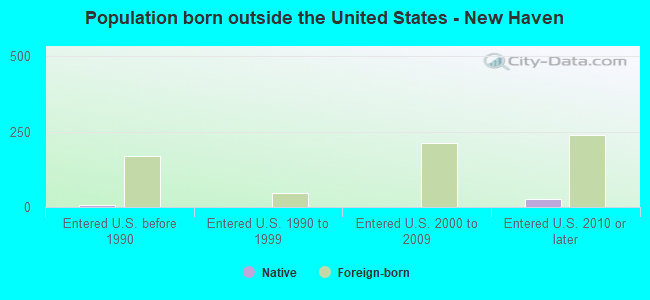
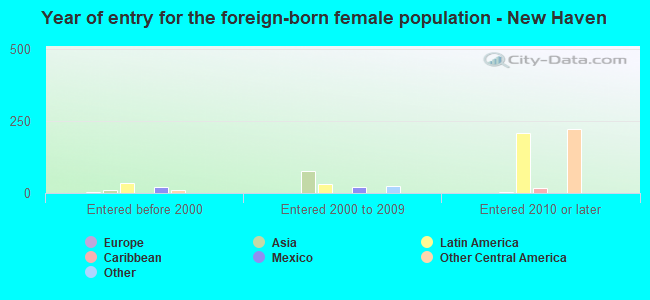
Foreign-born residents in New Haven 608 residents are foreign born (2.2% Latin America , 0.8% Asia , 0.4% North America ).
This city:
3.8%Indiana:
5.6%
Marital status for residents in New Haven Marital status - White (Caucasian) population 15 years and over
Males 24.5% Never married56.0% Now married0.2% Separated4.6% Widowed14.7% DivorcedFemales 22.3% Never married49.9% Now married1.8% Separated10.5% Widowed15.4% DivorcedWomen who gave birth in the past 12 months Now married:
83.5% (214)Unmarried:
16.5% (42)
Women who did not give birth in the past 12 months Now married:
54.0% (1,489)Unmarried:
46.0% (1,268)
Marital status - Black or African American population 15 years and over
Males 28.1% Never married53.9% Now married0.0% Separated6.6% Widowed11.4% DivorcedFemales 74.8% Never married15.5% Now married0.0% Separated0.0% Widowed9.7% DivorcedWomen who did not give birth in the past 12 months Now married:
3.0% (6)Unmarried:
97.0% (192)
Marital status - American Indian / Alaska Native population 15 years and over
Males 38.5% Never married61.5% Now married0.0% Separated0.0% Widowed0.0% DivorcedFemales 11.1% Never married88.9% Now married0.0% Separated0.0% Widowed0.0% DivorcedWomen who did not give birth in the past 12 months Now married:
87.5% (17)Unmarried:
12.5% (2)
Marital status - Asian population 15 years and over
Males 37.3% Never married62.7% Now married0.0% Separated0.0% Widowed0.0% DivorcedFemales 0.0% Never married20.5% Now married0.0% Separated45.2% Widowed34.2% DivorcedWomen who did not give birth in the past 12 months Now married:
7.4% (2)Unmarried:
92.6% (28)
Marital status - Other race population 15 years and over
Males 70.3% Never married21.6% Now married0.0% Separated0.0% Widowed8.1% DivorcedFemales 84.0% Never married16.0% Now married0.0% Separated0.0% Widowed0.0% DivorcedWomen who did not give birth in the past 12 months Now married:
0.0% (0)Unmarried:
100.0% (26)
Marital status - Two or more races population 15 years and over
Males 45.3% Never married27.1% Now married8.9% Separated0.0% Widowed18.8% DivorcedFemales 50.8% Never married44.1% Now married0.0% Separated0.0% Widowed5.1% DivorcedWomen who gave birth in the past 12 months Now married:
100.0% (8)Unmarried:
0.0% (0)
Women who did not give birth in the past 12 months Now married:
30.6% (68)Unmarried:
69.4% (154)
Marital status - White alone, not Hispanic / Latino population 15 years and over
Males 24.7% Never married55.9% Now married0.2% Separated4.7% Widowed14.5% DivorcedFemales 21.7% Never married49.7% Now married1.9% Separated11.0% Widowed15.7% DivorcedWomen who gave birth in the past 12 months Now married:
82.7% (147)Unmarried:
17.3% (31)
Women who did not give birth in the past 12 months Now married:
55.4% (1,524)Unmarried:
44.6% (1,228)
Marital status - Hispanic or Latino population 15 years and over
Males 31.3% Never married51.0% Now married0.0% Separated0.0% Widowed17.7% DivorcedFemales 41.6% Never married53.1% Now married0.0% Separated0.0% Widowed5.2% DivorcedWomen who gave birth in the past 12 months Now married:
86.0% (86)Unmarried:
14.0% (14)
Women who did not give birth in the past 12 months Now married:
26.5% (48)Unmarried:
73.5% (135)
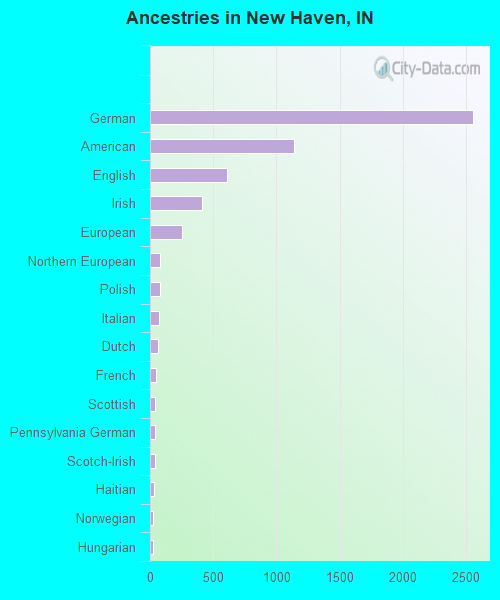
Ancestries in New Haven
2,555 33.9% German1,139 15.1% American606 8.0% English413 5.5% Irish257 3.4% European83 1.1% Northern European78 1.0% Polish73 1.0% Italian63 0.8% Dutch45 0.6% French39 0.5% Scottish38 0.5% Pennsylvania German36 0.5% Scotch-Irish29 0.4% Haitian26 0.3% Norwegian24 0.3% Hungarian22 0.3% Swiss20 0.3% Canadian16 0.2% British11 0.1% Croatian10 0.1% Lebanese10 0.1% French Canadian10 0.1% Macedonian10 0.1% Romanian9 0.1% Danish7 0.09% Portuguese
Children Nativity (place of birth) in New Haven
Children under 6 years - Living with two parents Both parents native 1,107 100.0% NativeBoth parents foreign-born 66 100.0% NativeOne native, one foreign-born parent 4 100.0% NativeChildren under 6 years - Living with one parent Native parent 292 100.0% NativeChildren 6 to 17 years - Living with two parents Both parents native 1,563 100.0% NativeBoth parents foreign-born 21 11.9% Native154 88.1% Foreign-bornOne native, one foreign-born parent 135 100.0% NativeChildren 6 to 17 years - Living with one parent Native parent 677 100.0% NativeForeign-born parent 11 51.9% Native10 48.1% Foreign-born
Grandparents responsible for own grandchildren in New Haven
Grandparents (30 to 59 years) White / Caucasian 7 26.9% Responsible for grandchildren19 73.1% Not responsible for grandchildrenAmerican Indian / Alaska Native 1 100.0% Not responsible for grandchildrenAsian 109 100.0% Not responsible for grandchildrenTwo or more races 24 100.0% Not responsible for grandchildrenWhite alone, not Hispanic / Latino 8 26.3% Responsible for grandchildren22 73.7% Not responsible for grandchildrenHispanic or Latino 18 100.0% Not responsible for grandchildrenGrandparents (60 years and over) White / Caucasian 51 56.2% Responsible for grandchildren40 43.8% Not responsible for grandchildrenAsian 49 100.0% Not responsible for grandchildrenWhite alone, not Hispanic / Latino 24 37.4% Responsible for grandchildren40 62.6% Not responsible for grandchildrenHispanic or Latino 14 100.0% Responsible for grandchildren