Races in Newport, Arkansas (AR) Detailed Stats
Data:
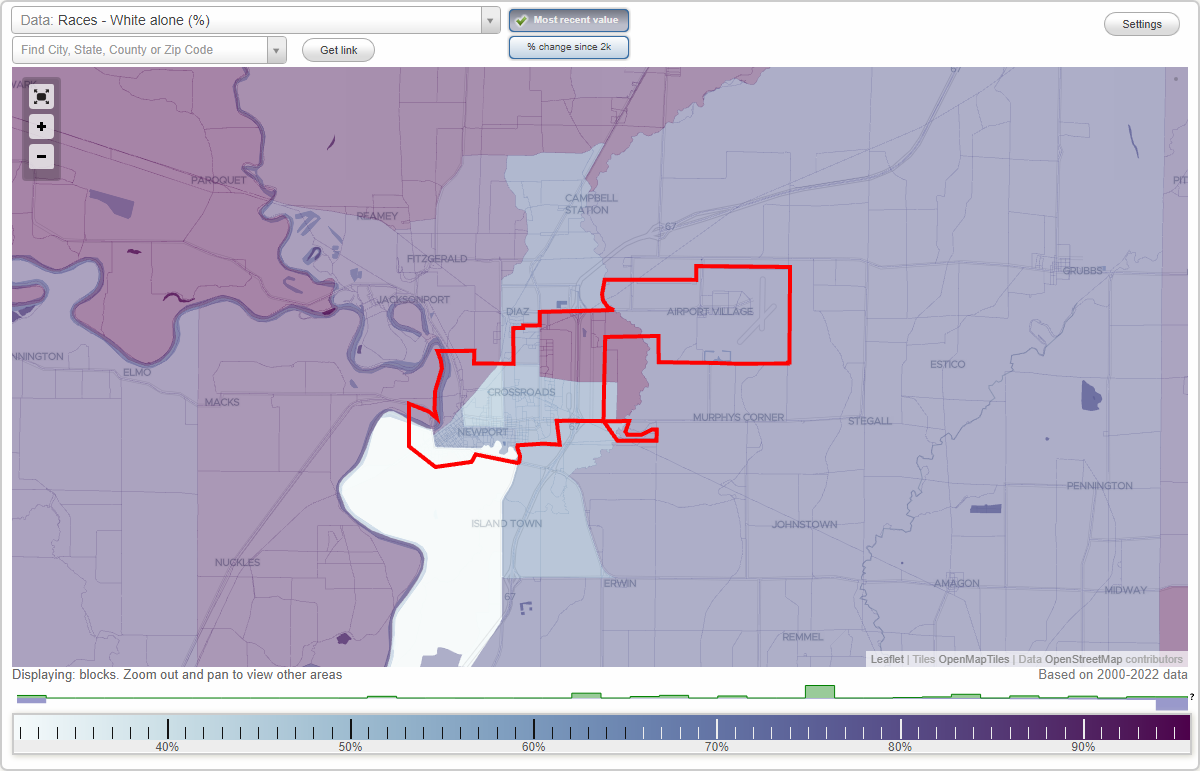
Races - White alone (%)
Races - White alone (% change since 2000)
Races - Black alone (%)
Races - Black alone (% change since 2000)
Races - American Indian alone (%)
Races - American Indian alone (% change since 2000)
Races - Asian alone (%)
Races - Asian alone (% change since 2000)
Races - Hispanic (%)
Races - Hispanic (% change since 2000)
Races - Native Hawaiian and Other Pacific Islander alone (%)
Races - Native Hawaiian and Other Pacific Islander alone (% change since 2000)
Races - Two or more races(%)
Races - Two or more races(% change since 2000)
Races - Other race alone (%)
Races - Other race alone (% change since 2000)
Racial diversity
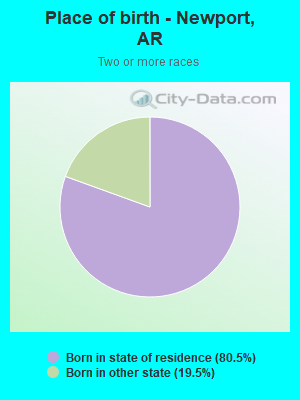
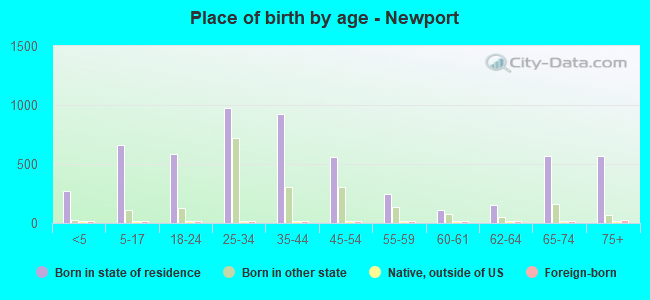
Place of birth - Born in state of residence (%)
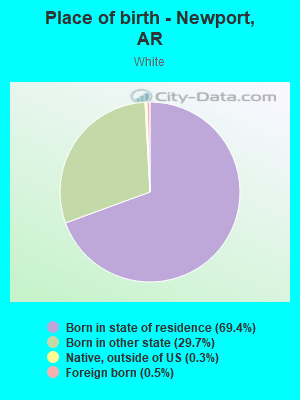
Place of birth - Born in state of residence (%) - White
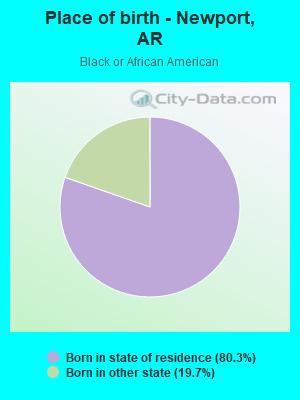
Place of birth - Born in state of residence (%) - Black or African American
Place of birth - Born in state of residence (%) - Asian
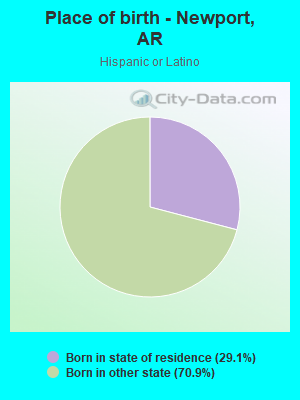
Place of birth - Born in state of residence (%) - Hispanic or Latino
Place of birth - Born in state of residence (%) - American Indian and Alaska Native
Place of birth - Born in state of residence (%) - Multirace
Place of birth - Born in state of residence (%) - Other Race
Place of birth - Born in other state (%)
Place of birth - Born in other state (%) - White
Place of birth - Born in other state (%) - Black or African American
Place of birth - Born in other state (%) - Asian
Place of birth - Born in other state (%) - Hispanic or Latino
Place of birth - Born in other state (%) - American Indian and Alaska Native
Place of birth - Born in other state (%) - Multirace
Place of birth - Born in other state (%) - Other Race
Place of birth - Native, outside of US (%)
Place of birth - Native, outside of US (%) - White
Place of birth - Native, outside of US (%) - Black or African American
Place of birth - Native, outside of US (%) - Asian
Place of birth - Native, outside of US (%) - Hispanic or Latino
Place of birth - Native, outside of US (%) - American Indian and Alaska Native
Place of birth - Native, outside of US (%) - Multirace
Place of birth - Native, outside of US (%) - Other Race
Place of birth - Foreign born (%)
Place of birth - Foreign born (%) - White
Place of birth - Foreign born (%) - Black or African American
Place of birth - Foreign born (%) - Asian
Place of birth - Foreign born (%) - Hispanic or Latino
Place of birth - Foreign born (%) - American Indian and Alaska Native
Place of birth - Foreign born (%) - Multirace
Place of birth - Foreign born (%) - Other Race
Residents speaking English at home (%)
Residents speaking English at home - Born in the United States (%)
Residents speaking English at home - Native, born elsewhere (%)
Residents speaking English at home - Foreign born (%)
Residents speaking Spanish at home (%)
Residents speaking Spanish at home - Born in the United States (%)
Residents speaking Spanish at home - Native, born elsewhere (%)
Residents speaking Spanish at home - Foreign born (%)
Residents speaking other language at home (%)
Residents speaking other language at home - Born in the United States (%)
Residents speaking other language at home - Native, born elsewhere (%)
Residents speaking other language at home - Foreign born (%)
Marital status - Never married (%)
Marital status - Now married (%)
Marital status - Separated (%)
Marital status - Widowed (%)
Marital status - Divorced (%)
Ancestries Reported - Arab (%)
Ancestries Reported - Czech (%)
Ancestries Reported - Danish (%)
Ancestries Reported - Dutch (%)
Ancestries Reported - English (%)
Ancestries Reported - French (%)
Ancestries Reported - French Canadian (%)
Ancestries Reported - German (%)
Ancestries Reported - Greek (%)
Ancestries Reported - Hungarian (%)
Ancestries Reported - Irish (%)
Ancestries Reported - Italian (%)
Ancestries Reported - Lithuanian (%)
Ancestries Reported - Norwegian (%)
Ancestries Reported - Polish (%)
Ancestries Reported - Portuguese (%)
Ancestries Reported - Russian (%)
Ancestries Reported - Scotch-Irish (%)
Ancestries Reported - Scottish (%)
Ancestries Reported - Slovak (%)
Ancestries Reported - Subsaharan African (%)
Ancestries Reported - Swedish (%)
Ancestries Reported - Swiss (%)
Ancestries Reported - Ukrainian (%)
Ancestries Reported - United States (%)
Ancestries Reported - Welsh (%)
Ancestries Reported - West Indian (%)
Ancestries Reported - Other (%)
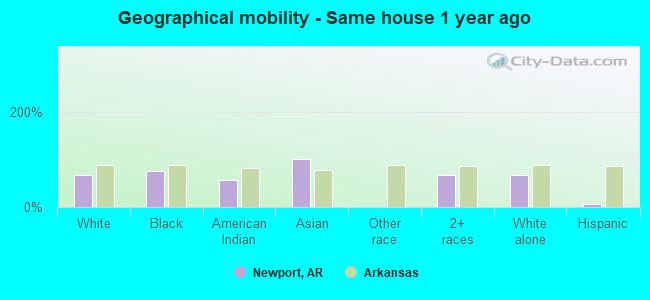
Geographical mobility - Same house 1 year ago (%)
Geographical mobility - Same house 1 year ago (%) - White
Geographical mobility - Same house 1 year ago (%) - Black or African American
Geographical mobility - Same house 1 year ago (%) - Asian
Geographical mobility - Same house 1 year ago (%) - Hispanic or Latino
Geographical mobility - Same house 1 year ago (%) - American Indian and Alaska Native
Geographical mobility - Same house 1 year ago (%) - Multirace
Geographical mobility - Same house 1 year ago (%) - Other Race
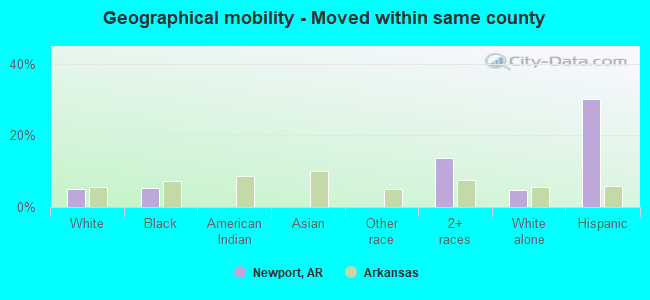
Geographical mobility - Moved within same county (%)
Geographical mobility - Moved within same county (%) - White
Geographical mobility - Moved within same county (%) - Black or African American
Geographical mobility - Moved within same county (%) - Asian
Geographical mobility - Moved within same county (%) - Hispanic or Latino
Geographical mobility - Moved within same county (%) - American Indian and Alaska Native
Geographical mobility - Moved within same county (%) - Multirace
Geographical mobility - Moved within same county (%) - Other Race
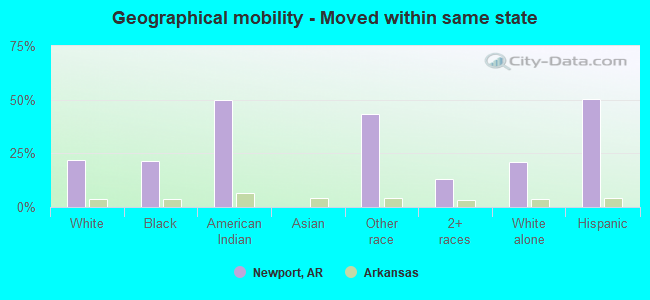
Geographical mobility - Moved from different county within same state (%)
Geographical mobility - Moved from different county within same state (%) - White
Geographical mobility - Moved from different county within same state (%) - Black or African American
Geographical mobility - Moved from different county within same state (%) - Asian
Geographical mobility - Moved from different county within same state (%) - Hispanic or Latino
Geographical mobility - Moved from different county within same state (%) - American Indian and Alaska Native
Geographical mobility - Moved from different county within same state (%) - Multirace
Geographical mobility - Moved from different county within same state (%) - Other Race
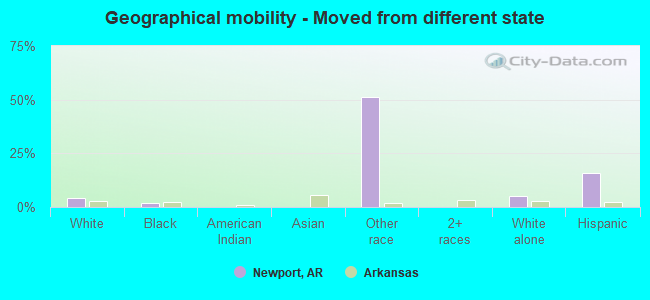
Geographical mobility - Moved from different state (%)
Geographical mobility - Moved from different state (%) - White
Geographical mobility - Moved from different state (%) - Black or African American
Geographical mobility - Moved from different state (%) - Asian
Geographical mobility - Moved from different state (%) - Hispanic or Latino
Geographical mobility - Moved from different state (%) - American Indian and Alaska Native
Geographical mobility - Moved from different state (%) - Multirace
Geographical mobility - Moved from different state (%) - Other Race
Geographical mobility - Moved from abroad (%)
Geographical mobility - Moved from abroad (%) - White
Geographical mobility - Moved from abroad (%) - Black or African American
Geographical mobility - Moved from abroad (%) - Asian
Geographical mobility - Moved from abroad (%) - Hispanic or Latino
Geographical mobility - Moved from abroad (%) - American Indian and Alaska Native
Geographical mobility - Moved from abroad (%) - Multirace
Geographical mobility - Moved from abroad (%) - Other Race
Place of birth for the foreign-born population - Ireland (%)
Place of birth for the foreign-born population - Denmark (%)
Place of birth for the foreign-born population - Norway (%)
Place of birth for the foreign-born population - Sweden (%)
Place of birth for the foreign-born population - United Kingdom (%)
Place of birth for the foreign-born population - England (%)
Place of birth for the foreign-born population - Scotland (%)
Place of birth for the foreign-born population - Other Northern Europe (%)
Place of birth for the foreign-born population - Austria (%)
Place of birth for the foreign-born population - Belgium (%)
Place of birth for the foreign-born population - France (%)
Place of birth for the foreign-born population - Germany (%)
Place of birth for the foreign-born population - Netherlands (%)
Place of birth for the foreign-born population - Switzerland (%)
Place of birth for the foreign-born population - Other Western Europe (%)
Place of birth for the foreign-born population - Greece (%)
Place of birth for the foreign-born population - Italy (%)
Place of birth for the foreign-born population - Portugal (%)
Place of birth for the foreign-born population - Spain (%)
Place of birth for the foreign-born population - Other Southern Europe (%)
Place of birth for the foreign-born population - Albania (%)
Place of birth for the foreign-born population - Belarus (%)
Place of birth for the foreign-born population - Bosnia and Herzegovina (%)
Place of birth for the foreign-born population - Bulgaria (%)
Place of birth for the foreign-born population - Croatia (%)
Place of birth for the foreign-born population - Czechoslovakia (%)
Place of birth for the foreign-born population - Hungary (%)
Place of birth for the foreign-born population - Latvia (%)
Place of birth for the foreign-born population - Lithuania (%)
Place of birth for the foreign-born population - North Macedonia (Macedonia) (%)
Place of birth for the foreign-born population - Moldova (%)
Place of birth for the foreign-born population - Poland (%)
Place of birth for the foreign-born population - Romania (%)
Place of birth for the foreign-born population - Russia (%)
Place of birth for the foreign-born population - Serbia (%)
Place of birth for the foreign-born population - Ukraine (%)
Place of birth for the foreign-born population - Other Eastern Europe (%)
Place of birth for the foreign-born population - China (%)
Place of birth for the foreign-born population - Hong Kong (%)
Place of birth for the foreign-born population - Taiwan (%)
Place of birth for the foreign-born population - Japan (%)
Place of birth for the foreign-born population - Korea (%)
Place of birth for the foreign-born population - Other Eastern Asia (%)
Place of birth for the foreign-born population - Afghanistan (%)
Place of birth for the foreign-born population - Bangladesh (%)
Place of birth for the foreign-born population - India (%)
Place of birth for the foreign-born population - Iran (%)
Place of birth for the foreign-born population - Kazakhstan (%)
Place of birth for the foreign-born population - Nepal (%)
Place of birth for the foreign-born population - Pakistan (%)
Place of birth for the foreign-born population - Sri Lanka (%)
Place of birth for the foreign-born population - Uzbekistan (%)
Place of birth for the foreign-born population - Other South Central Asia (%)
Place of birth for the foreign-born population - Burma (%)
Place of birth for the foreign-born population - Cambodia (%)
Place of birth for the foreign-born population - Indonesia (%)
Place of birth for the foreign-born population - Laos (%)
Place of birth for the foreign-born population - Malaysia (%)
Place of birth for the foreign-born population - Philippines (%)
Place of birth for the foreign-born population - Singapore (%)
Place of birth for the foreign-born population - Thailand (%)
Place of birth for the foreign-born population - Vietnam (%)
Place of birth for the foreign-born population - Other South Eastern Asia (%)
Place of birth for the foreign-born population - Armenia (%)
Place of birth for the foreign-born population - Iraq (%)
Place of birth for the foreign-born population - Israel (%)
Place of birth for the foreign-born population - Jordan (%)
Place of birth for the foreign-born population - Kuwait (%)
Place of birth for the foreign-born population - Lebanon (%)
Place of birth for the foreign-born population - Saudi Arabia (%)
Place of birth for the foreign-born population - Syria (%)
Place of birth for the foreign-born population - Turkey (%)
Place of birth for the foreign-born population - Yemen (%)
Place of birth for the foreign-born population - Other Western Asia (%)
Place of birth for the foreign-born population - Eritrea (%)
Place of birth for the foreign-born population - Ethiopia (%)
Place of birth for the foreign-born population - Kenya (%)
Place of birth for the foreign-born population - Somalia (%)
Place of birth for the foreign-born population - Uganda (%)
Place of birth for the foreign-born population - Zimbabwe (%)
Place of birth for the foreign-born population - Other Eastern Africa (%)
Place of birth for the foreign-born population - Cameroon (%)
Place of birth for the foreign-born population - Congo (%)
Place of birth for the foreign-born population - Democratic Republic of Congo (Zaire) (%)
Place of birth for the foreign-born population - Other Middle Africa (%)
Place of birth for the foreign-born population - Egypt (%)
Place of birth for the foreign-born population - Morocco (%)
Place of birth for the foreign-born population - Sudan (%)
Place of birth for the foreign-born population - Other Northern Africa (%)
Place of birth for the foreign-born population - South Africa (%)
Place of birth for the foreign-born population - Other Southern Africa (%)
Place of birth for the foreign-born population - Cabo Verde (%)
Place of birth for the foreign-born population - Ghana (%)
Place of birth for the foreign-born population - Liberia (%)
Place of birth for the foreign-born population - Nigeria (%)
Place of birth for the foreign-born population - Senegal (%)
Place of birth for the foreign-born population - Sierra Leone (%)
Place of birth for the foreign-born population - Other Western Africa (%)
Place of birth for the foreign-born population - Australia (%)
Place of birth for the foreign-born population - New Zealand (%)
Place of birth for the foreign-born population - Fiji (%)
Place of birth for the foreign-born population - Micronesia (%)
Place of birth for the foreign-born population - Bahamas (%)
Place of birth for the foreign-born population - Barbados (%)
Place of birth for the foreign-born population - Cuba (%)
Place of birth for the foreign-born population - Dominica (%)
Place of birth for the foreign-born population - Dominican Republic (%)
Place of birth for the foreign-born population - Grenada (%)
Place of birth for the foreign-born population - Haiti (%)
Place of birth for the foreign-born population - Jamaica (%)
Place of birth for the foreign-born population - St. Vincent and the Grenadines (%)
Place of birth for the foreign-born population - Trinidad and Tobago (%)
Place of birth for the foreign-born population - West Indies (%)
Place of birth for the foreign-born population - Other Caribbean (%)
Place of birth for the foreign-born population - Belize (%)
Place of birth for the foreign-born population - Costa Rica (%)
Place of birth for the foreign-born population - El Salvador (%)
Place of birth for the foreign-born population - Guatemala (%)
Place of birth for the foreign-born population - Honduras (%)
Place of birth for the foreign-born population - Mexico (%)
Place of birth for the foreign-born population - Nicaragua (%)
Place of birth for the foreign-born population - Panama (%)
Place of birth for the foreign-born population - Other Central America (%)
Place of birth for the foreign-born population - Argentina (%)
Place of birth for the foreign-born population - Bolivia (%)
Place of birth for the foreign-born population - Brazil (%)
Place of birth for the foreign-born population - Chile (%)
Place of birth for the foreign-born population - Colombia (%)
Place of birth for the foreign-born population - Ecuador (%)
Place of birth for the foreign-born population - Guyana (%)
Place of birth for the foreign-born population - Peru (%)
Place of birth for the foreign-born population - Uruguay (%)
Place of birth for the foreign-born population - Venezuela (%)
Place of birth for the foreign-born population - Other South America (%)
Place of birth for the foreign-born population - Canada (%)
Place of birth for the foreign-born population - Other Northern America (%)
Place of birth for the foreign-born population - Other (%)
Latest news about races in Newport, AR collected exclusively by city-data.com from local newspapers, TV, and radio stations
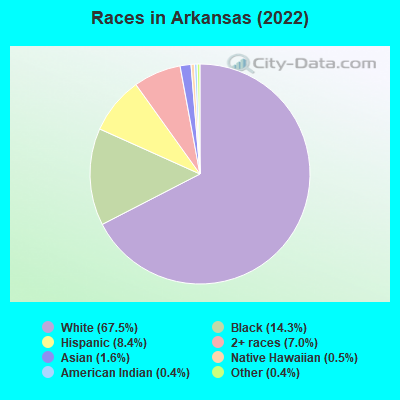
According to 2022 data, the most numerous races in Newport, AR are White alone (5,026 residents), Black alone (1,556 residents), and Hispanic (334 residents). 95.0% of Newport residents speak English at home. 0.6% of Newport, AR residents are foreign-born , which is 601.1% less than the foreign-born rate of 4.0% across the entire state of Arkansas.
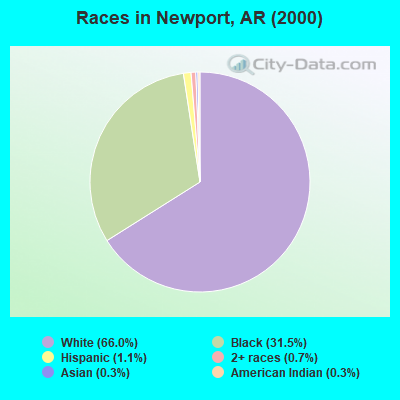
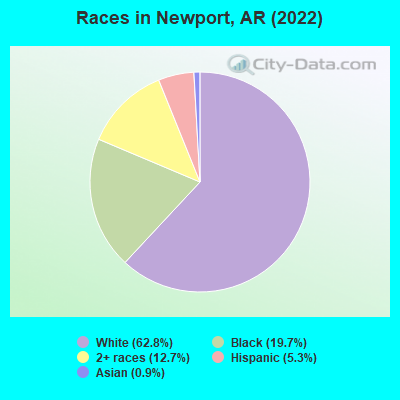
Race distribution in Newport
2000 2022
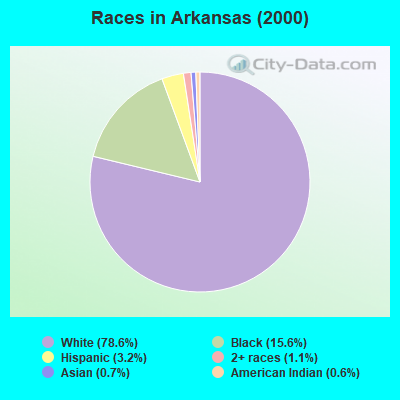
2,100,135 78.6% White alone 416,615 15.6% Black alone 86,866 3.2% Hispanic 30,364 1.1% Two or more races 19,892 0.7% Asian alone 16,702 0.6% American Indian alone 1,494 0.06% Native Hawaiian and Other 1,332 0.05% Other race alone
2,054,922 67.5% White alone 435,637 14.3% Black alone 255,416 8.4% Hispanic 213,684 7.0% Two or more races 47,592 1.6% Asian alone 14,176 0.5% Native Hawaiian and Other 12,680 0.4% American Indian alone 11,530 0.4% Other race alone
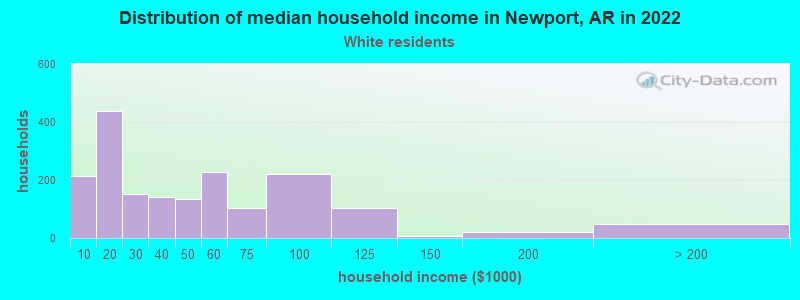
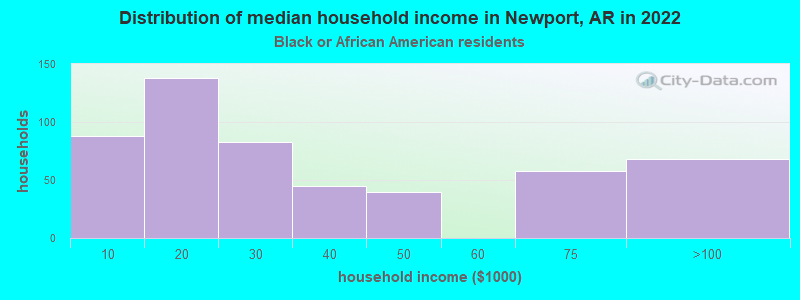
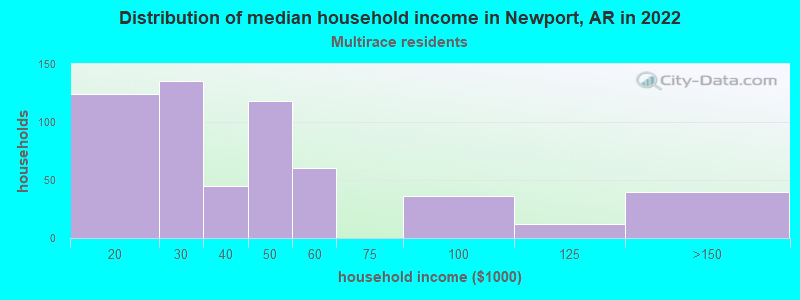
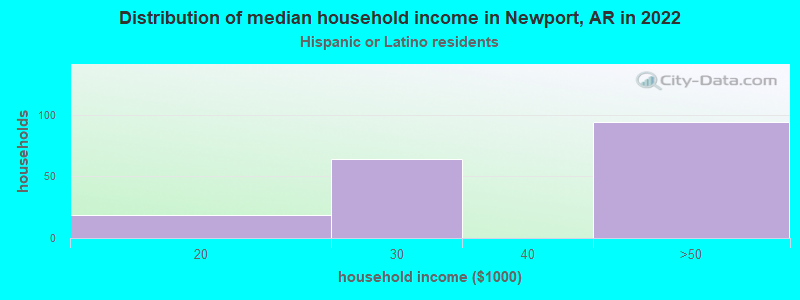
Income and house value in Newport Median household income in 2022 $44,797 White non-Hispanic householders$22,658 Black householders$99,612 American Indian and Alaska Native householders$34,886 Asian householders$19,660 Two or more races householders$40,069 Hispanic or Latino race householdersMedian 2022 house value $169,129 White Non-Hispanic householders$97,369 Black or African American householders $86,698 Asian householders$253,427 Two or more races householders$173,397 Hispanic or Latino householders
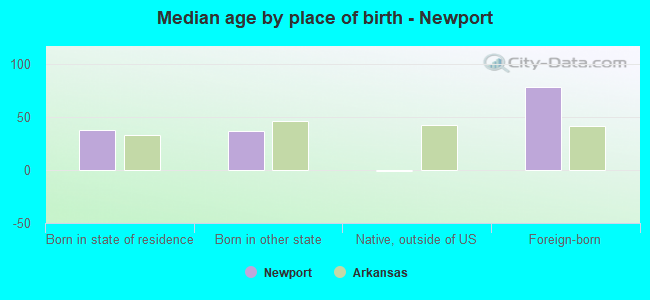
Median age by race in Newport
40.6 Median age for White residents41.8 39.1 38.5 Median age for Black or African American residents38.3 38.3 25.9 Median age for American Indian / Alaska Native residents79.2 Median age for Asian residents32.1 Median age for Other race residents28.3 Median age for Two or more races residents27.3 30.6 40.6 Median age for White alone residents41.1 39.7 29.8 Median age for Hispanic or Latino residents29.2 32.9
Owner/renter occupied households by race in Newport
House owners and renters - White residents 1,028 71.5% Owner occupied411 28.5% Renter occupiedHouse owners and renters - Black or African American residents 102 21.3% Owner occupied378 78.7% Renter occupiedHouse owners and renters - Other race residents 31 100.0% Renter occupiedHouse owners and renters - Two or more races residents 308 42.5% Owner occupied417 57.5% Renter occupiedHouse owners and renters - White alone residents 1,032 71.2% Owner occupied418 28.8% Renter occupiedHouse owners and renters - Hispanic or Latino residents 123 100.0% Renter occupied
Language usage in Newport
English speakers - Total 95.0% of residents of Newport speak English at home.
4.1% of residents speak Spanish at home 279 92.4% Speak English very well23 7.6% Speak English less than very well1.0% of residents speak other language at home 73 100.0% Speak English very well
English speakers - Born in the United States 93.6% of residents of Newport speak English at home.
6.3% of residents speak Spanish at home 107 82.3% Speak English very well23 17.7% Speak English less than very well0.1% of residents speak other language at home 2 100.0% Speak English very well
English speakers - Native, born elsewhere 94.7% of residents of Newport speak English at home.
English speakers - Foreign-born 77.3% of residents of Newport speak English at home.
27.3% of residents speak other language at home 12 100.0% Speak English very well
White (Caucasian) - Speak only English Native:
95.4% (4,693)Foreign-born:
75.7% (20)
White (Caucasian) - Speak another language Native:
4.4% (214)Foreign-born:
30.1% (8)
White alone - Speak only English Native:
95.8% (4,664)Foreign-born:
79.6% (23)
White alone - Speak another language Native:
4.0% (194)Foreign-born:
25.9% (8)
Foreign-born residents in Newport 44 residents are foreign born
This city:
0.6%Arkansas:
100.0%
Marital status for residents in Newport Marital status - White (Caucasian) population 15 years and over
Males 17.9% Never married52.2% Now married1.5% Separated3.2% Widowed25.2% DivorcedFemales 26.8% Never married32.0% Now married6.3% Separated12.4% Widowed22.5% DivorcedWomen who gave birth in the past 12 months Now married:
40.3% (27)Unmarried:
59.7% (41)
Women who did not give birth in the past 12 months Now married:
34.0% (561)Unmarried:
66.0% (1,091)
Marital status - Black or African American population 15 years and over
Males 59.7% Never married15.6% Now married3.3% Separated4.4% Widowed17.0% DivorcedFemales 66.4% Never married7.9% Now married2.2% Separated10.5% Widowed13.1% DivorcedWomen who did not give birth in the past 12 months Now married:
7.9% (33)Unmarried:
92.1% (381)
Marital status - Two or more races population 15 years and over
Males 69.7% Never married20.4% Now married0.0% Separated0.0% Widowed10.0% DivorcedFemales 26.5% Never married32.4% Now married12.3% Separated9.6% Widowed19.2% DivorcedWomen who gave birth in the past 12 months Now married:
25.0% (23)Unmarried:
75.0% (70)
Women who did not give birth in the past 12 months Now married:
60.3% (213)Unmarried:
39.7% (140)
Marital status - White alone, not Hispanic / Latino population 15 years and over
Males 17.9% Never married52.1% Now married1.5% Separated3.2% Widowed25.2% DivorcedFemales 25.4% Never married32.7% Now married6.4% Separated12.7% Widowed22.7% DivorcedWomen who gave birth in the past 12 months Now married:
40.3% (28)Unmarried:
59.7% (41)
Women who did not give birth in the past 12 months Now married:
35.2% (569)Unmarried:
64.8% (1,049)
Marital status - Hispanic or Latino population 15 years and over
Males 72.5% Never married27.5% Now married0.0% Separated0.0% Widowed0.0% DivorcedFemales 88.1% Never married0.0% Now married0.0% Separated0.0% Widowed11.9% DivorcedWomen who did not give birth in the past 12 months Now married:
0.0% (0)Unmarried:
100.0% (84)
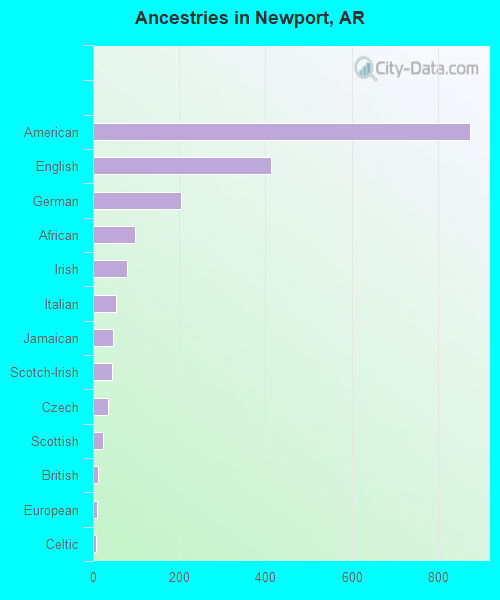
Ancestries in Newport
926 25.2% American300 8.2% English206 5.6% Irish195 5.3% German84 2.3% African68 1.8% Italian40 1.1% Scottish39 1.1% Norwegian26 0.7% Russian21 0.6% British14 0.4% Scotch-Irish12 0.3% European7 0.2% French6 0.2% Dutch4 0.1% Celtic
Geographical mobility in Newport Same house 1 year ago 3,432 68.1% White (Caucasian)1,176 74.6% Black or African American10 57.4% American Indian / Alaska Native9 100.0% Asian1,210 66.7% Two or more races3,425 68.4% White alone, not Hispanic / Latino20 6.1% Hispanic or LatinoMoved within same county 253 5.0% White / Caucasian84 5.3% Black or African American246 13.6% Two or more races243 4.9% White alone, not Hispanic / Latino98 30.3% Hispanic or LatinoMoved within same state 1,112 22.1% White / Caucasian337 21.4% Black or African American9 49.6% American Indian / Alaska Native24 43.4% Other race237 13.0% Two or more races1,039 20.8% White alone, not Hispanic / Latino164 50.4% Hispanic or LatinoMoved from different state 212 4.2% White / Caucasian32 2.1% Black or African American28 51.4% Other race256 5.1% White alone, not Hispanic / Latino51 15.7% Hispanic or Latino
Children Nativity (place of birth) in Newport
Children under 6 years - Living with two parents Both parents native 70 100.0% NativeChildren under 6 years - Living with one parent Native parent 234 100.0% Native
Children 6 to 17 years - Living with two parents Both parents native 261 100.0% NativeChildren 6 to 17 years - Living with one parent Native parent 391 100.0% Native
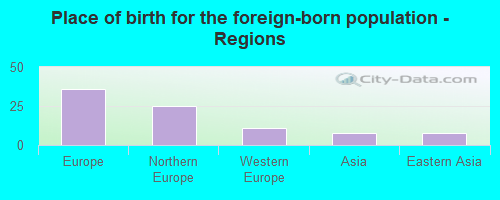
Place of birth for residents in Newport 36 Europe25 Northern Europe11 Western Europe8 Asia8 Eastern Asia
Grandparents responsible for own grandchildren in Newport
Grandparents (30 to 59 years) White / Caucasian 82 88.7% Responsible for grandchildren10 11.3% Not responsible for grandchildrenBlack or African American 2 40.8% Responsible for grandchildren3 59.2% Not responsible for grandchildrenWhite alone, not Hispanic / Latino 82 88.1% Responsible for grandchildren11 11.9% Not responsible for grandchildren
Grandparents (60 years and over) White / Caucasian 21 100.0% Responsible for grandchildrenWhite alone, not Hispanic / Latino 21 100.0% Responsible for grandchildren