Races in North Andrews Gardens, Florida (FL) Detailed Stats
Ancestries, Foreign-born residents, place of birth

Recent posts about races in North Andrews Gardens, Florida on our local forum with over 2,400,000 registered users:
 | Commercial Blvd/North Andrews Gardens for a 20-something professional? (6 replies) |
| objective opinions on North Andrews Gardens area (3 replies) |
| Hollywood , fl ..need help finding safe areas to live (14 replies) |
| What is safe what is not? (10 replies) |
| relocating to... oakland park? (15 replies) |
24.5% of North Andrews Gardens, FL residents are foreign-born (19.3% born in Latin America, 2.9% born in Europe), which is 14.2% greater than the foreign-born rate of 21.0% across the entire state of Florida.
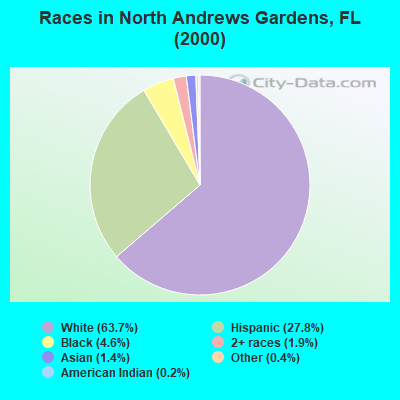
Race distribution in North Andrews Gardens

- 6,14863.7%White alone
- 2,68227.8%Hispanic
- 4444.6%Black alone
- 1861.9%Two or more races
- 1361.4%Asian alone
- 340.4%Other race alone
- 240.2%American Indian alone
- 20.02%Native Hawaiian and Other
Pacific Islander alone
2000
2022
-
- 10,458,50965.4%White alone
- 2,682,71516.8%Hispanic
- 2,264,26814.2%Black alone
- 261,6931.6%Asian alone
- 236,9541.5%Two or more races
- 42,3580.3%American Indian alone
- 28,9940.2%Other race alone
- 6,8870.04%Native Hawaiian and Other
Pacific Islander alone

-
- 11,309,40350.8%White alone
- 6,025,03927.1%Hispanic
- 3,241,01514.6%Black alone
- 861,6303.9%Two or more races
- 623,6922.8%Asian alone
- 152,0540.7%Other race alone
- 22,5040.1%American Indian alone
- 9,4860.04%Native Hawaiian and Other
Pacific Islander alone

Income and house value in North Andrews Gardens
- Median household income in 2022
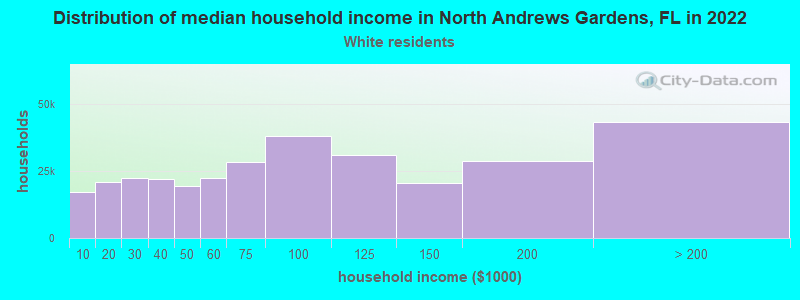
- $76,263White non-Hispanic householders
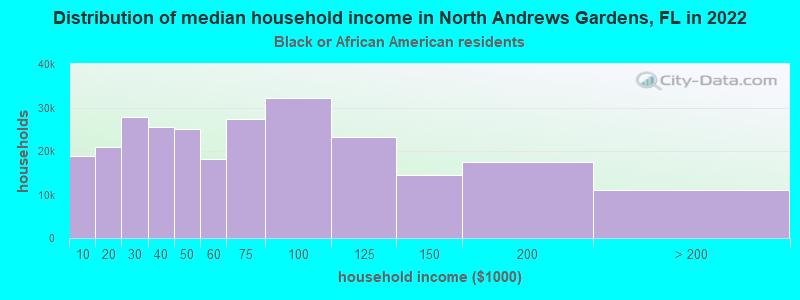
- $80,997Black householders
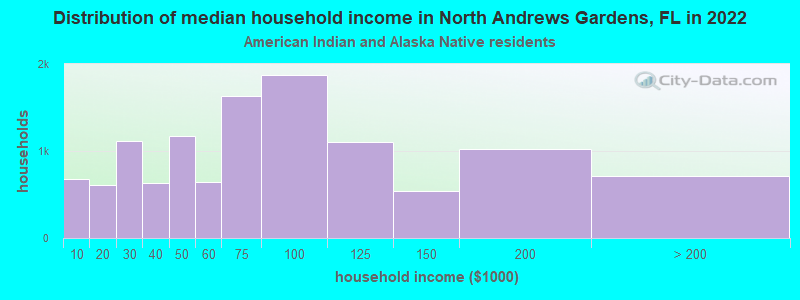
- $38,258American Indian and Alaska Native householders
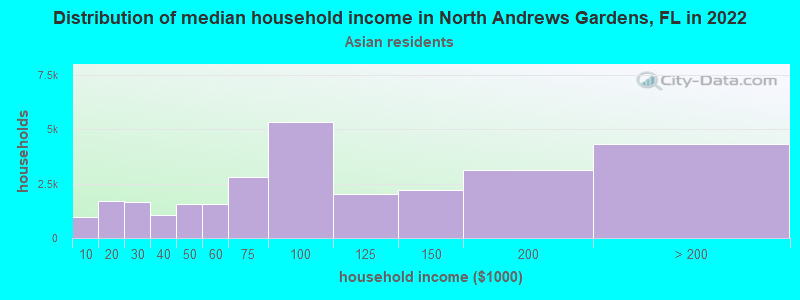
- $103,216Asian householders
- $90,165Some other race householders
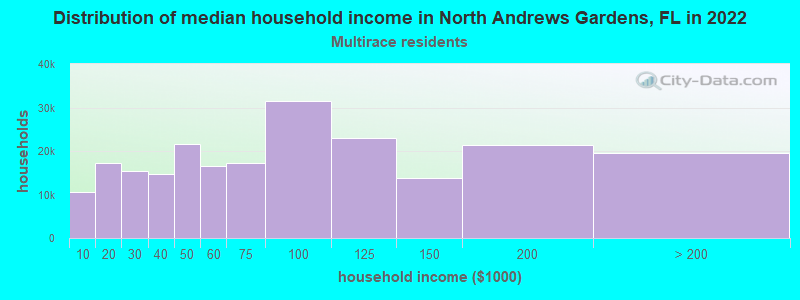
- $99,368Two or more races householders
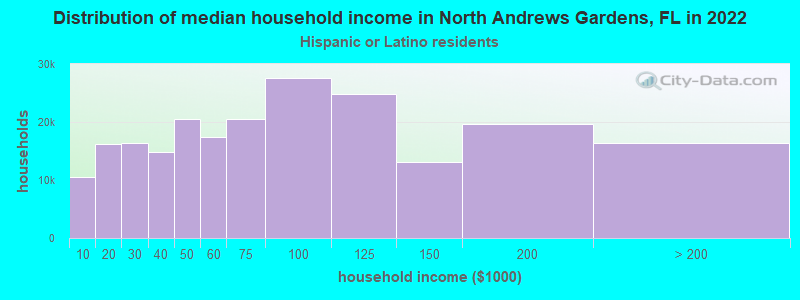
- $67,101Hispanic or Latino race householders
- Median 2022 house value
- $334,125White Non-Hispanic householders
- $375,124Black or African American householders
- $339,489American Indian or Alaska Native householders
- $357,498Asian householders
- $328,377Some other race householders
- $358,648Two or more races householders
- $331,826Hispanic or Latino householders
Household income for White non-Hispanic householders
Household income for Black householders
Household income for American Indian and Alaska Native householders
Household income for Asian householders
Household income for Two or more races householders
Household income for Hispanic or Latino race householders
Foreign-born residents in North Andrews Gardens
2,362 residents are foreign born (19.3% Latin America, 2.9% Europe).
| This city: | 24.5% |
| Florida: | 16.7% |
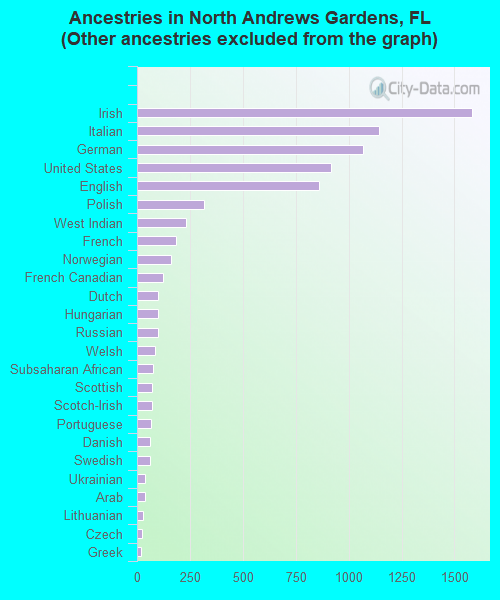
Ancestries in North Andrews Gardens

- 3,28830.4%Other
- 1,58414.6%Irish
- 1,14210.6%Italian
- 1,0709.9%German
- 9158.5%United States
- 8597.9%English
- 3172.9%Polish
- 2332.2%West Indian
- 1831.7%French
- 1601.5%Norwegian
- 1231.1%French Canadian
- 970.9%Dutch
- 970.9%Hungarian
- 970.9%Russian
- 870.8%Welsh
- 750.7%Subsaharan African
- 720.7%Scottish
- 710.7%Scotch-Irish
- 650.6%Portuguese
- 630.6%Danish
- 630.6%Swedish
- 400.4%Ukrainian
- 370.3%Arab
- 260.2%Lithuanian
- 230.2%Czech
- 170.2%Greek
- 70.06%Slovak
- 70.06%Swiss
Zip codes: 33334.