Estimated zip code population in 2022: 31,922 Zip code population in 2010: 28,749 Zip code population in 2000: 30,847
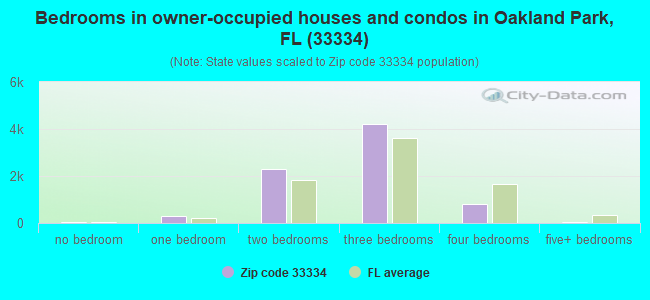
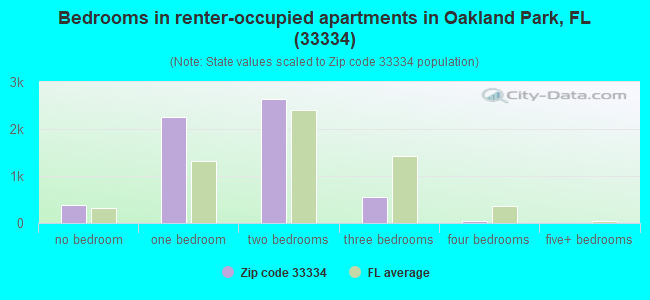
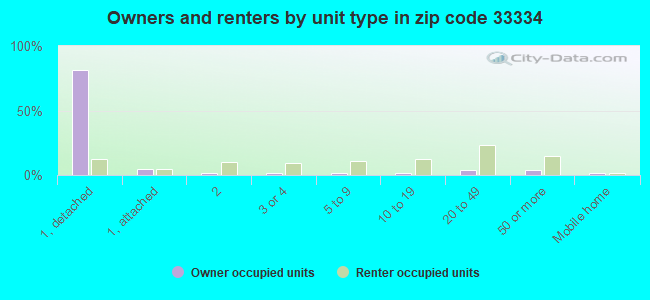
Houses and condos: 14,637 Renter-occupied apartments: 5,846
% of renters here:
43%
State:
33%
March 2022 cost of living index in zip code 33334: 110.5 (more than average, U.S. average is 100)
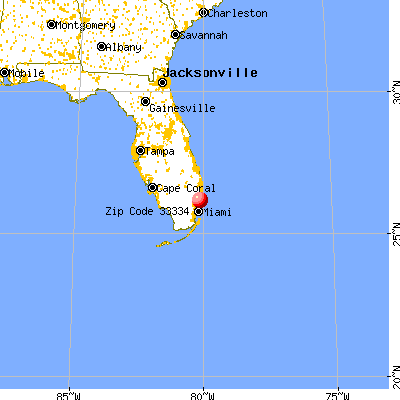
Land area: 4.8 sq. mi. Water area: 0.0 sq. mi.
Population density: 6,667 people per square mile
(high).
OSM Map
General Map
Google Map
MSN Map
OSM Map
General Map
Google Map
MSN Map
OSM Map
General Map
Google Map
MSN Map
OSM Map
General Map
Google Map
MSN Map
Please wait while loading the map...
Real estate property taxes paid for housing units in 2022:
This zip code:
0.7% ($3,471)
Florida:
0.7% ($2,529)
Median real estate property taxes paid for housing units with mortgages in 2022: $3,816 (0.8%) Median real estate property taxes paid for housing units with no mortgage in 2022: $2,950 (0.6%)
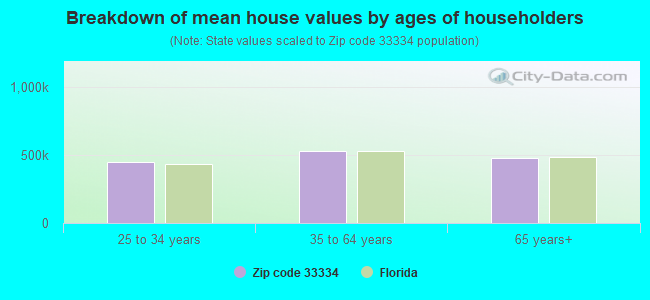
Estimated median house/condo value in 2022: $490,311
33334:
$490,311
Florida:
$354,100
According to our research of Florida and other state lists, there were 21 registered sex offenders living in 33334 zip code as of April 27, 2024. The ratio of all residents to sex offenders in zip code 33334 is 1,464 to 1. The ratio of registered sex offenders to all residents in this zip code is lower than the state average.
Median resident age:
This zip code:
41.0 years
Florida median age:
42.7 years
Average household size:
This zip code:
2.3 people
Florida:
2.5 people
Averages for the 2020 tax year for zip code 33334, filed in 2021:
Average Adjusted Gross Income (AGI) in 2020: $59,188 (Individual Income Tax Returns)
Here:
$59,188
State:
$82,200
Salary/wage: $54,733 (reported on 78.9% of returns)
Here:
$54,733
State:
$58,347
(% of AGI for various income ranges: 1233.1% for AGIs below $25k, 3845.5% for AGIs $25k-50k, 6773.0% for AGIs $50k-75k, 10303.6% for AGIs $75k-100k, 18514.2% for AGIs $100k-200k, 84250.0% for AGIs over 200k)
Taxable interest for individuals: $1,765 (reported on 21.5% of returns)
This zip code:
$1,765
Florida:
$4,272
(% of AGI for various income ranges: 12.9% for AGIs below $25k, 15.8% for AGIs $25k-50k, 45.6% for AGIs $50k-75k, 73.1% for AGIs $75k-100k, 126.6% for AGIs $100k-200k, 1420.0% for AGIs over 200k)
Ordinary dividends: $6,461 (reported on 16.5% of returns)
Here:
$6,461
State:
$15,863
(% of AGI for various income ranges: 24.6% for AGIs below $25k, 41.5% for AGIs $25k-50k, 99.5% for AGIs $50k-75k, 175.8% for AGIs $75k-100k, 398.4% for AGIs $100k-200k, 4431.7% for AGIs over 200k)
Net capital gain/loss in AGI: +$21,083 (reported on 16.2% of returns)
Here:
+$21,083
State:
+$62,983
(% of AGI for various income ranges: 6.6% for AGIs below $25k, 40.5% for AGIs $25k-50k, 114.9% for AGIs $50k-75k, 317.2% for AGIs $75k-100k, 938.9% for AGIs $100k-200k, 22316.7% for AGIs over 200k)
Profit/loss from business: +$7,002 (reported on 27.0% of returns)
Here:
+$7,002
State:
+$9,719
(% of AGI for various income ranges: 275.8% for AGIs below $25k, 116.4% for AGIs $25k-50k, 182.2% for AGIs $50k-75k, 474.5% for AGIs $75k-100k, 412.1% for AGIs $100k-200k, 2455.6% for AGIs over 200k)
Taxable individual retirement arrangement distribution: $19,014 (reported on 5.8% of returns)
33334:
$19,014
Florida:
$24,823
(% of AGI for various income ranges: 33.6% for AGIs below $25k, 58.0% for AGIs $25k-50k, 177.6% for AGIs $50k-75k, 320.4% for AGIs $75k-100k, 630.3% for AGIs $100k-200k, 1735.6% for AGIs over 200k)
Self-employed (Keogh) retirement plans: $16,120 (reported on 0.3% of returns)
33334:
$16,120
Florida:
$29,694
(% of AGI for various income ranges: 80.6% for AGIs $100k-200k)
Total itemized deductions: $27,312 (reported on 9.6% of returns)
Here:
$27,312
State:
$45,393
(% of AGI for various income ranges: 54.7% for AGIs below $25k, 162.5% for AGIs $25k-50k, 413.5% for AGIs $50k-75k, 708.8% for AGIs $75k-100k, 1259.2% for AGIs $100k-200k, 5878.3% for AGIs over 200k)
Charity contributions: $5,286 (reported on 7.4% of returns)
Here:
$5,286
State:
$20,178
(% of AGI for various income ranges: 2.8% for AGIs below $25k, 19.6% for AGIs $25k-50k, 41.6% for AGIs $50k-75k, 111.0% for AGIs $75k-100k, 176.3% for AGIs $100k-200k, 1277.2% for AGIs over 200k)
Taxes paid: $7,039 (reported on 9.3% of returns)
33334:
$7,039
State:
$6,967
(% of AGI for various income ranges: 10.7% for AGIs below $25k, 37.7% for AGIs $25k-50k, 100.1% for AGIs $50k-75k, 179.5% for AGIs $75k-100k, 354.9% for AGIs $100k-200k, 1378.3% for AGIs over 200k)
Earned income credit: $2,192 (reported on 21.1% of returns)
Here:
$2,192
State:
$2,306
(% of AGI for various income ranges: 130.3% for AGIs below $25k, 58.4% for AGIs $25k-50k, 0.7% for AGIs $50k-75k)
Percentage of individuals using paid preparers for their 2020 taxes: 91.0%
Here:
91%
State:
92%
(% for various income ranges: 88.7% for AGIs below $25k, 92.6% for AGIs $25k-50k, 92.2% for AGIs $50k-75k, 90.3% for AGIs $75k-100k, 93.3% for AGIs $100k-200k, 93.7% for AGIs over 200k)
Averages for the 2012 tax year for zip code 33334, filed in 2013:
Average Adjusted Gross Income (AGI) in 2012: $42,152 (Individual Income Tax Returns)
Here:
$42,152
State:
$60,316
Salary/wage: $39,126 (reported on 84.0% of returns)
Here:
$39,126
State:
$45,277
(% of AGI for various income ranges: 79.5% for AGIs below $25k, 87.5% for AGIs $25k-50k, 82.3% for AGIs $50k-75k, 81.8% for AGIs $75k-100k, 77.2% for AGIs $100k-200k, 52.4% for AGIs over 200k)
Taxable interest for individuals: $1,454 (reported on 21.4% of returns)
This zip code:
$1,454
Florida:
$3,587
(% of AGI for various income ranges: 0.7% for AGIs below $25k, 0.6% for AGIs $25k-50k, 0.6% for AGIs $50k-75k, 0.7% for AGIs $75k-100k, 0.8% for AGIs $100k-200k, 1.0% for AGIs over 200k)
Ordinary dividends: $4,713 (reported on 13.5% of returns)
Here:
$4,713
State:
$12,831
(% of AGI for various income ranges: 1.5% for AGIs below $25k, 1.0% for AGIs $25k-50k, 1.2% for AGIs $50k-75k, 1.5% for AGIs $75k-100k, 2.0% for AGIs $100k-200k, 1.9% for AGIs over 200k)
Net capital gain/loss in AGI: +$7,277 (reported on 11.9% of returns)
Here:
+$7,277
State:
+$33,493
(% of AGI for various income ranges: 0.5% for AGIs $50k-75k, 0.6% for AGIs $75k-100k, 1.7% for AGIs $100k-200k, 11.5% for AGIs over 200k)
Profit/loss from business: +$7,719 (reported on 19.8% of returns)
Here:
+$7,719
State:
+$10,012
(% of AGI for various income ranges: 10.7% for AGIs below $25k, 2.6% for AGIs $25k-50k, 2.0% for AGIs $50k-75k, 1.9% for AGIs $75k-100k, 2.3% for AGIs $100k-200k, 3.2% for AGIs over 200k)
Taxable individual retirement arrangement distribution: $14,203 (reported on 5.7% of returns)
33334:
$14,203
Florida:
$21,544
(% of AGI for various income ranges: 1.8% for AGIs below $25k, 1.2% for AGIs $25k-50k, 2.1% for AGIs $50k-75k, 2.4% for AGIs $75k-100k, 2.5% for AGIs $100k-200k, 1.6% for AGIs over 200k)
Self-employment retirement plans: $14,175 (reported on 0.3% of returns)
33334:
$14,175
Florida:
$20,611
Total itemized deductions: $18,690 (23% of AGI, reported on 25.3% of returns)
Here:
$18,690
State:
$25,533
Here:
23.3% of AGI
State:
18.0% of AGI
(% of AGI for various income ranges: 9.3% for AGIs below $25k, 11.8% for AGIs $25k-50k, 12.7% for AGIs $50k-75k, 12.1% for AGIs $75k-100k, 12.0% for AGIs $100k-200k, 8.4% for AGIs over 200k)
Charity contributions: $2,507 (reported on 19.6% of returns)
Here:
$2,507
State:
$5,698
(% of AGI for various income ranges: 0.6% for AGIs below $25k, 1.0% for AGIs $25k-50k, 1.2% for AGIs $50k-75k, 1.4% for AGIs $75k-100k, 1.5% for AGIs $100k-200k, 1.3% for AGIs over 200k)
Taxes paid: $3,801 (reported on 24.4% of returns)
33334:
$3,801
State:
$6,203
(% of AGI for various income ranges: 1.2% for AGIs below $25k, 1.8% for AGIs $25k-50k, 2.4% for AGIs $50k-75k, 2.6% for AGIs $75k-100k, 2.9% for AGIs $100k-200k, 2.2% for AGIs over 200k)
Earned income credit: $2,173 (reported on 24.9% of returns)
Here:
$2,173
State:
$2,372
(% of AGI for various income ranges: 7.5% for AGIs below $25k, 0.8% for AGIs $25k-50k)
Percentage of individuals using paid preparers for their 2012 taxes: 63.4%
Here:
63%
State:
54%
(% for various income ranges: 65.6% for AGIs below $25k, 59.6% for AGIs $25k-50k, 59.9% for AGIs $50k-75k, 62.4% for AGIs $75k-100k, 65.0% for AGIs $100k-200k, 83.3% for AGIs over 200k)
Averages for the 2004 tax year for zip code 33334, filed in 2005:
Average Adjusted Gross Income (AGI) in 2004: $37,913 (Individual Income Tax Returns)
Here:
$37,913
State:
$50,523
Salary/wage: $35,834 (reported on 85.2% of returns)
Here:
$35,834
State:
$39,563
(% of AGI for various income ranges: 150.1% for AGIs below $10k, 83.7% for AGIs $10k-25k, 87.6% for AGIs $25k-50k, 84.1% for AGIs $50k-75k, 82.1% for AGIs $75k-100k, 66.7% for AGIs over 100k)
Taxable interest for individuals: $1,466 (reported on 31.6% of returns)
This zip code:
$1,466
Florida:
$3,211
(% of AGI for various income ranges: 8.9% for AGIs below $10k, 1.3% for AGIs $10k-25k, 1.0% for AGIs $25k-50k, 1.2% for AGIs $50k-75k, 1.1% for AGIs $75k-100k, 1.1% for AGIs over 100k)
Taxable dividends: $2,797 (reported on 17.3% of returns)
Here:
$2,797
State:
$6,129
(% of AGI for various income ranges: 5.5% for AGIs below $10k, 1.0% for AGIs $10k-25k, 0.8% for AGIs $25k-50k, 1.0% for AGIs $50k-75k, 1.3% for AGIs $75k-100k, 1.8% for AGIs over 100k)
Net capital gain/loss: +$11,869 (reported on 15.1% of returns)
Here:
+$11,869
State:
+$27,205
(% of AGI for various income ranges: -2.0% for AGIs below $10k, 0.1% for AGIs $10k-25k, 0.5% for AGIs $25k-50k, 1.5% for AGIs $50k-75k, 4.0% for AGIs $75k-100k, 13.1% for AGIs over 100k)
Profit/loss from business: +$8,386 (reported on 16.6% of returns)
Here:
+$8,386
State:
+$10,634
(% of AGI for various income ranges: 31.3% for AGIs below $10k, 7.4% for AGIs $10k-25k, 2.7% for AGIs $25k-50k, 3.2% for AGIs $50k-75k, 2.7% for AGIs $75k-100k, 2.2% for AGIs over 100k)
IRA payment deduction: $2,726 (reported on 2.8% of returns)
33334:
$2,726
Florida:
$3,082
(% of AGI for various income ranges: 0.7% for AGIs below $10k, 0.2% for AGIs $10k-25k, 0.2% for AGIs $25k-50k, 0.2% for AGIs $50k-75k, 0.2% for AGIs $75k-100k, 0.1% for AGIs over 100k)
Self-employed pension: $9,411 (reported on 0.4% of returns)
Here:
$9,411
Florida:
$15,857
(% of AGI for various income ranges: 0.1% for AGIs $10k-25k, 0.2% for AGIs $50k-75k, 0.2% for AGIs over 100k)
Total itemized deductions: $16,110 (24% of AGI, reported on 30.9% of returns)
Here:
$16,110
State:
$20,370
Here:
24.1% of AGI
State:
20.7% of AGI
(% of AGI for various income ranges: 26.1% for AGIs below $10k, 12.2% for AGIs $10k-25k, 14.2% for AGIs $25k-50k, 16.2% for AGIs $50k-75k, 15.0% for AGIs $75k-100k, 9.4% for AGIs over 100k)
Charity contributions deductions: $2,170 (3% of AGI, reported on 26.0% of returns)
Here:
$2,170
State:
$4,064
Here:
3.0% of AGI
State:
3.8% of AGI
(% of AGI for various income ranges: 1.2% for AGIs below $10k, 1.0% for AGIs $10k-25k, 1.4% for AGIs $25k-50k, 1.8% for AGIs $50k-75k, 2.0% for AGIs $75k-100k, 1.4% for AGIs over 100k)
Total tax: $6,128 (reported on 73.9% of returns)
33334:
$6,128
State:
$9,431
(% of AGI for various income ranges: 7.2% for AGIs below $10k, 4.3% for AGIs $10k-25k, 7.3% for AGIs $25k-50k, 10.3% for AGIs $50k-75k, 11.9% for AGIs $75k-100k, 20.7% for AGIs over 100k)
Earned income credit: $1,583 (reported on 20.4% of returns)
Here:
$1,583
State:
$1,808
Percentage of individuals using paid preparers for their 2004 taxes: 61.8%
Here:
62%
State:
60%
(% for various income ranges: 60.9% for AGIs below $10k, 64.9% for AGIs $10k-25k, 57.7% for AGIs $25k-50k, 60.1% for AGIs $50k-75k, 62.8% for AGIs $75k-100k, 72.4% for AGIs over 100k)
Likely homosexual households (counted as self-reported same-sex unmarried-partner households)
Lesbian couples: 0.1% of all households
Gay men: 3.7% of all households
Household received Food Stamps/SNAP in the past 12 months: 1,994 Household did not receive Food Stamps/SNAP in the past 12 months: 11,589
Women who had a birth in the past 12 months: 495 (235 now married, 248 unmarried) Women who did not have a birth in the past 12 months: 6,207 (2,228 now married, 3,977 unmarried)
Housing units in zip code 33334 with a mortgage: 4,550 (340 second mortgage, 35 home equity loan, 237 both second mortgage and home equity loan) Houses without a mortgage: 81
Median monthly owner costs for units with a mortgage: $2,122 Median monthly owner costs for units without a mortgage: $703
Residents with income below the poverty level in 2022:
This zip code:
14.1%
Whole state:
12.7%
Residents with income below 50% of the poverty level in 2022:
This zip code:
9.5%
Whole state:
6.6%
Median number of rooms in houses and condos:
Here:
5.5
State:
5.9
Median number of rooms in apartments:
Here:
3.6
State:
4.2
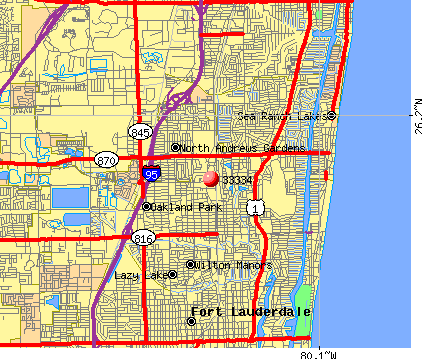
Notable locations in this zip code not listed on our city pages
Notable locations in zip code 33334: Johns Siding Railroad Station (A), The Prado (B), Oakland Park Fire Department Station 9 (C), Oakland Park Police Department (D). Display/hide their locations on the map
Shopping Centers: North Ridge Shopping Center (1), Promenade at Bay Colony Shopping Center (2), Boulevard Shopping Center (3), Central Shopping Center (4). Display/hide their locations on the map
Churches in zip code 33334 include: Hope Lutheran Church Missouri Synod (A), Lutheran Ministries of Floria-Broward (B), Peace Lutheran Church Missouri Synod (C), First Christian Church of Pompano Beach (D), Saint Henry Catholic Church (E), Peace Church (F), Jones Memorial Chapel (G), Christian Life Center (H), Bethany Baptist Church (I). Display/hide their locations on the map
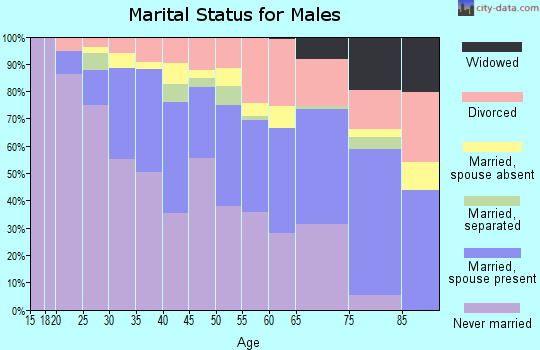
2,429 married couples with children.
2,762 single-parent households (536 men, 2,226 women).
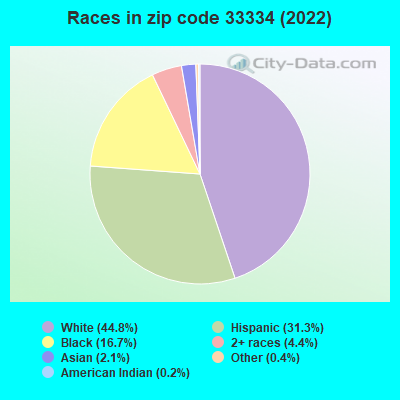
61.6% of residents of 33334 zip code speak English at home.
27.8% of residents speak Spanish at home (43% very well, 17% well, 24% not well, 16% not at all).
10.0% of residents speak other Indo-European language at home (70% very well, 15% well, 14% not well, 1% not at all).
0.8% of residents speak Asian or Pacific Island language at home (48% very well, 45% well, 7% not well).
0.2% of residents speak other language at home (71% very well, 29% well).
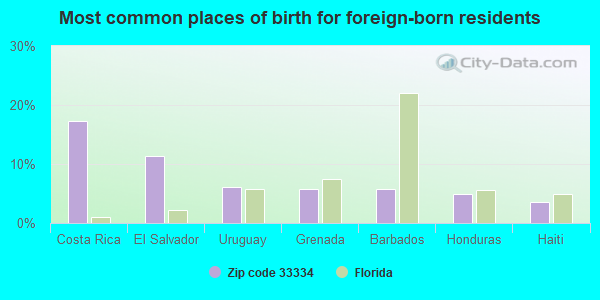
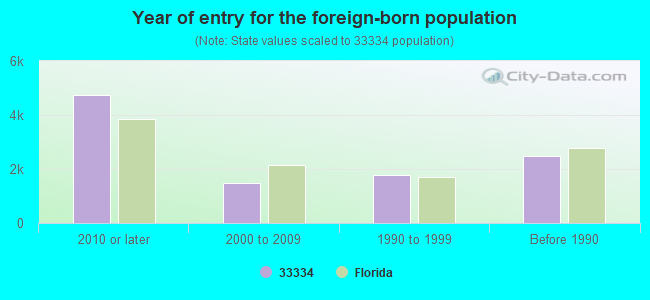
Foreign born population: 9,386 (29.4%) (43.0% of them are naturalized citizens)
Major facilities with environmental interests located in this zip code:
SAL S AUTO REPAIR SHOP (4033 NW 9TH AVE in OAKLAND PARK, FL)
STATE MASTER (FDM) - CHAZ-FL0000053884, HAZARDOUS WASTE REGULATION PROGRAM (Resource Conservation and Recovery Act (tracking hazardous waste)) Small Quantity Generators, between 100 kg and 1000 kg of hazardous waste/month (Resource Conservation and Recovery Act (tracking hazardous waste)) - notification Business SIC classification: GENERAL AUTOMOTIVE REPAIR SHOPS Organizations: SALS TOWING INC, SALS AUTO REPAIR SHOP (CONTACT/OWNER)
, GEORGE MAFFEI, MGR (CONTACT/OWNER)
Alternative names: SALS AUTO REPAIR SHOP, SALS TOWING INC
ATLANTIC RADIATOR (4031 NE 6TH AVE in OAKLAND PARK, FL)
STATE MASTER (FDM) - CHAZ-FLR000088583, HAZARDOUS WASTE REGULATION PROGRAM (Resource Conservation and Recovery Act (tracking hazardous waste)) Business SIC classification: AUTOMOTIVE REPAIR SHOPS Business NAICS classification: OTHER AUTOMOTIVE MECHANICAL AND ELECTRICAL REPAIR AND MAINTENANCE. Organizations: NON NOTIFIER (CONTACT/OWNER)
L D ENTERPRISES OF SOUTH FLORIDA INC (1500 EAST COMMERCIAL BOULEVARD in FORT LAUDERDALE, FL)
AIR MINOR (AIRS/AFS) (Resource Conservation and Recovery Act (tracking hazardous waste)) Business SIC classification: DRYCLEANING PLANTS, EXCEPT RUG CLEANING Organizations: L D ENTERPRISES OF SOUTH FL INC (CONTACT/OWNER)
Alternative names: IMPERIAL CLEANERS, IMPERIAL CLEANERS AND LAUNDRY, KASSAM INCORPORATED
ACRY-TECH COATINGS, INC. (3601 N.E. 5TH AVENUE in OAKLAND PARK, FL)
(Integrated Compliance Information System) - ICIS-04-1996-0446, FORMAL ENFORCEMENT ACTION COMPLIANCE ACTIVITY (Tracking inspections of insecticide, fungicide, and rodenticide, and toxic substances) Business SIC classification: LAWN AND GARDEN SERVICES Alternative names: INSECTA SALES INC
INSECTA MARKETING INC (3601 NE 5TH AVE in OAKLAND PARK, FL)
COMPLIANCE ACTIVITY (Tracking inspections of insecticide, fungicide, and rodenticide, and toxic substances) STATE MASTER (New Jersey environmental info) - NJEMS-000986, PESTICIDES - MANUFACTURE Alternative names: INSECTA SALES AND RESEARCH INC
OAKLAND PARK ELEMENTARY SCHOOL (936 NE 33RD ST in OAKLAND PARK, FL)
(Geographic Names Information System) (National Center for Education Statistics) - STATE ID-0031 Organizations: BROWARD COUNTY SCHOOL DISTRICT (SCHOOL DISTRICT)
NORTH ANDREWS GARDENS ELEMENTARY SCHOOL (345 NE 56TH ST in FORT LAUDERDALE, FL)
(National Center for Education Statistics) - STATE ID-0521 Organizations: BROWARD COUNTY SCHOOL DISTRICT (SCHOOL DISTRICT)
JAMES S. RICKARDS MIDDLE SCHOOL (6000 NE 9TH AVE in OAKLAND PARK, FL)
(National Center for Education Statistics) - STATE ID-2121 Organizations: BROWARD COUNTY SCHOOL DISTRICT (SCHOOL DISTRICT)
MAACO AUTO PAINTING (3070 NE 12TH TERRACE in OAKLAND PARK, FL)
(Resource Conservation and Recovery Act (tracking hazardous waste)) Small Quantity Generators, between 100 kg and 1000 kg of hazardous waste/month (Resource Conservation and Recovery Act (tracking hazardous waste)) - notification Organizations: SCOTT KNIGHT, OWNER (CONTACT/OWNER)
, PETER PHILIPS (CONTACT/OWNER)
ATLANTIC COAST (887 NE 30TH CT in OAKLAND PARK, FL)
AIR MINOR (AIRS/AFS) Small Quantity Generators, between 100 kg and 1000 kg of hazardous waste/month (Resource Conservation and Recovery Act (tracking hazardous waste)) - notification Business SIC classification: ELECTROPLATING, PLATING, POLISHING, ANODIZING, AND COLORING Organizations: AL PAPIERSKI, PRES (CONTACT/OWNER)
Alternative names: ATLANTIC COAST PLATING INC
AERKO INTERNATIONAL (516 NE 34TH ST in FORT LAUDERDALE, FL)
COMPLIANCE ACTIVITY (Tracking inspections of insecticide, fungicide, and rodenticide, and toxic substances) (Resource Conservation and Recovery Act (tracking hazardous waste)) Business SIC classification: CHEMICALS AND CHEMICAL PREPARATIONS Organizations: KEVIN DALLETT (CONTACT/OWNER)
Alternative names: D.P. PACKAGING D/B/A AERKO INTERNATIONAL
CYPRESS CREEK CLEANERS (CHUN HA PAK) (821 NE 62ND STREET in FORT LAUDERDALE, FL)
AIR MINOR (AIRS/AFS) Small Quantity Generators, between 100 kg and 1000 kg of hazardous waste/month (Resource Conservation and Recovery Act (tracking hazardous waste)) - notification Business SIC classification: DRYCLEANING PLANTS, EXCEPT RUG CLEANING Organizations: CHUN PAK, OWNER (CONTACT/OWNER)
SOUTH SAILS CLEANERS INC (1305 E COMMERCIAL BLVD in FORT LAUDERDALE, FL)
AIR MINOR (AIRS/AFS) Small Quantity Generators, between 100 kg and 1000 kg of hazardous waste/month (Resource Conservation and Recovery Act (tracking hazardous waste)) - notification Business SIC classification: DRYCLEANING PLANTS, EXCEPT RUG CLEANING Organizations: SAVAS KALAITZIDIS, OWNER (CONTACT/OWNER)
Alternative names: EUROPEAN DRY CLEANERS, EUROPEAN DRY CLEANING & TAILORING INCORPORATED
Housing units lacking complete plumbing facilities: 0.6% Housing units lacking complete kitchen facilities: 1.2%
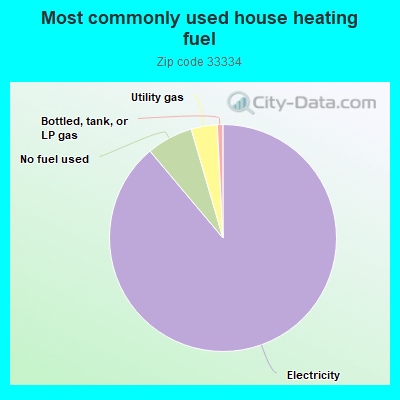
88.7%Electricity
6.6%No fuel used
3.7%Utility gas
0.8%Bottled, tank, or LP gas
Population in 1990: 29,072. Population change in the 1990s: +1,775 (+6.1%).
Place of birth for U.S.-born residents:
This state: 10,381
Northeast: 5,574
Midwest: 2,451
South: 2,707
West: 621
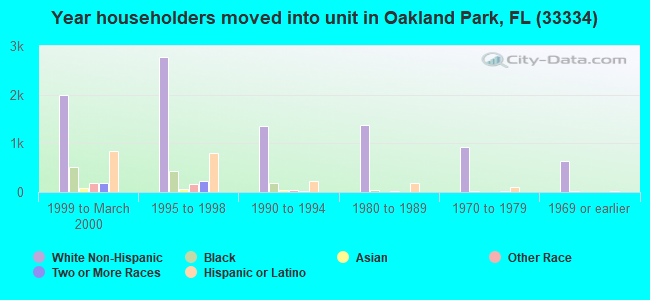
51% of the 33334 zip code residents lived in the same house 5 years ago. Out of people who lived in different houses, 71% lived in this county. Out of people who lived in different counties, 50% lived in Florida.
85% of the 33334 zip code residents lived in the same house 1 year ago. Out of people who lived in different houses, 63% moved from this county. Out of people who lived in different houses, 7% moved from different county within same state. Out of people who lived in different houses, 17% moved from different state. Out of people who lived in different houses, 7% moved from abroad.
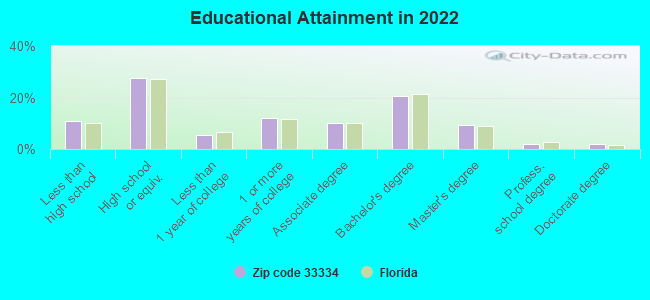
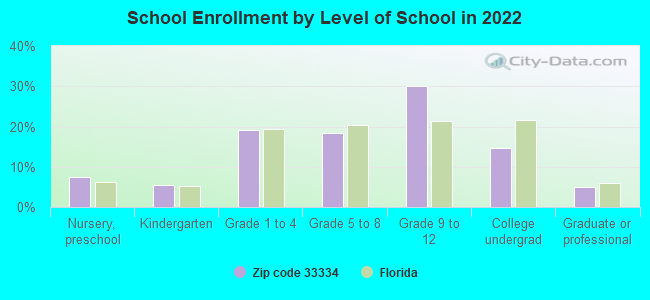
Private vs. public school enrollment:
Students in private schools in grades 1 to 8 (elementary and middle school): 357
Here:
15.7%
Florida:
15.8%
Students in private schools in grades 9 to 12 (high school): 294
Here:
16.3%
Florida:
12.9%
Students in private undergraduate colleges: 216
Here:
24.5%
Florida:
23.6%
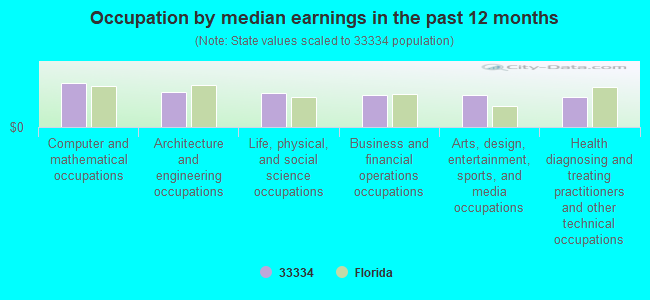
Occupation by median earnings in the past 12 months ($)
108,500Computer and mathematical occupations
85,334Architecture and engineering occupations
84,775Life, physical, and social science occupations
79,624Business and financial operations occupations
78,596Arts, design, entertainment, sports, and media occupations
73,030Health diagnosing and treating practitioners and other technical occupations
Companies with federal contracts located in this zip code:
FISCHER PANDA GENERATORS INC (4345 N E 12TH TERRACE in OAKLAND PARK, FL; small business) : $1,811,748 in 36 contractsfrom 2001 to 2006
Contracts for Generators and Generators Sets, Electrical, Wallboard, Building Paper, and Thermal Insulation Materials, Miscellaneous Items, Miscellaneous Engine Accessories, Nonaircraft, and moreby Army, Navy, Air Force, U.S. Special Operations Command, and others Signed by year:2000: $0; 2001: $57,221; 2002: $124,390; 2003: $257,784; 2004: $700,226; 2005: $625,152; 2006: $46,975.
Biggest contracts:
$374,998 with Army for Generators and Generators Sets, Electrical. Signed on 2004-11-05. Completion date: 2005-03-11.
$231,400, same as above.Signed on 2005-02-04. Completion date: 2005-03-01.
$111,300, same as above.Signed on 2005-08-24. Completion date: 2005-08-29.
$111,300, same as above.Signed on 2005-06-07. Completion date: 2005-08-29.
ATLANTIC SCIENTIFIC DEVELOPMEN (1511 E COMMERCIAL BLVD in FORT LAUDERDAL, FL; small business) : $1,235,247 in 4 contractsfrom 2002 to 2003
$394,587 with Navy for Other Research and Development -- Advanced Development (R&D). Signed on 2003-04-17. Completion date: 2003-09-30.
$391,623, same as above.Signed on 2003-02-13. Completion date: 2003-09-30.
$349,037, same as above.Signed on 2002-06-21. Completion date: 2003-06-29.
$100,000, same as above.Signed on 2003-09-09. Completion date: 2003-12-30.
ARGOTEC INC (4750 DIXIE HIGHWAY, STE 4 in FORT LAUDERDAL, FL; small business) 750 employees, $0 revenue. : $939,936 in 30 contractsfrom 2000 to 2006
Contracts for Maintenance, Repair and Rebuilding of Equipment -- Communication, Detection, and Coherent Radiation Equipment, Underwater Sound Equipment, Miscellaneous Communication Equipment, Electronic Countermeasures, Counter-Countermeasures and Quick Reaction Capability Equipment by Navy Signed by year:2000: $92,300; 2001: $0; 2002: $78,060; 2003: $413,526; 2004: $49,675; 2005: $174,685; 2006: $131,690.
Biggest contracts:
$211,749 with Navy for Maintenance, Repair and Rebuilding of Equipment -- Communication, Detection, and Coherent Radiation Equipment. Signed on 2003-03-20. Completion date: 2003-09-04.
$92,300 with Navy for Underwater Sound Equipment. Signed on 2000-12-04. Completion date: 2001-01-26.
$79,110, same as above.Signed on 2006-01-04. Completion date: 2006-05-04.
$78,060, same as above.Signed on 2002-04-26. Completion date: 2002-08-05.
APEX MACHINE CO INC (3000 NE 12TH TER in FORT LAUDERDAL, FL; small business)
$218,262 with Army for Industrial Marking Machines. Signed on 2002-06-28. Completion date: 2002-12-26.
BUSINESS INFORMATION SYSTEMS I (1350 NE 56TH STREET in FORT LAUDERDAL, FL; small business) : $177,829 in 6 contractsfrom 2002 to 2006
Contracts for Installation of Equipment -- Office Machines, Text Processing Systems and Visible Record Equipment, Maintenance, Repair and Rebuilding of Equipment -- Office Machines, Text Processing Systems and Visible Record Equipment, Guard Services, ADP Input/Output and Storage Devices, and moreby Department of Veterans Affairs, Navy, Public Buildings Service, Army, and others Signed by year:2000: $0; 2001: $0; 2002: $118,631; 2003: $24,963; 2004: $16,702; 2005: $831; 2006: $16,702.
Biggest contracts:
$118,631 with Department of Veterans Affairs for Installation of Equipment -- Office Machines, Text Processing Systems and Visible Record Equipment. Taking place in MI. Signed on 2002-11-15. Completion date: 2003-11-15.
$16,702 with Navy for Maintenance, Repair and Rebuilding of Equipment -- Office Machines, Text Processing Systems and Visible Record Equipment. Signed on 2006-01-25. Completion date: 2006-09-30.
$16,702, same as above.Signed on 2004-10-01. Completion date: 2005-09-30.
$14,268 with Public Buildings Service for Guard Services. Taking place in MI. Signed on 2003-05-15. Completion date: 2003-07-15.
OPTOELECTRONICS, INC (5821 NE 14TH AVENUE in FORT LAUDERDAL, FL; small business) : $74,323 in 4 contractsfrom 2002 to 2004
$38,140 with Navy for Miscellaneous Communication Equipment. Signed on 2002-04-30. Completion date: 2002-06-28.
$19,725 with Navy for Antennas, Waveguides, and Related Equipment. Signed on 2004-09-14. Completion date: 2004-10-18.
$11,213 with Navy for Radio and Television Communication Equipment, Except Airborne. Taking place in MD. Signed on 2004-08-03. Completion date: 2004-09-20.
$5,245 with National Oceanic and Atmospheric Administration/Under Secretary for Oceans and Atmosphere for Fire Control Transmitting and Receiving Equipment, except Airborne. Signed on 2004-07-14. Completion date: 2004-07-30.
TAPEX CORP (3034 NE 12TH TERRACE in FORT LAUDERDAL, FL; small business)
$13,735 with Army for Industrial Marking Machines. Signed on 2002-08-22. Completion date: 2002-10-15.
EVANGELISM EXPLOSION INTERNATI (4709 NE 12TH AVE in FORT LAUDERDAL, FL)
$3,960 with Air Force for Training Aids. Signed on 2003-07-30. Completion date: 2004-06-30.
CADILLAC GRAPHICS INC (4521 NE 5TH TER in FORT LAUDERDAL, FL; small business)
$3,691 with Army for Signs, Advertising Displays, and Identification Plates. Signed on 2004-06-18. Completion date: 2004-07-19.
Top industries in this zip code by the number of employees in 2005:
Health Care and Social Assistance: General Medical and Surgical Hospitals (500-999 employees: 1 establishment)
2002 - 2018 National Fire Incident Reporting System (NFIRS) incidents
Based on the data from the years 2002 - 2018 the average number of fire incidents per year is 63. The highest number of reported fire incidents - 78 took place in 2013, and the least - 24 in 2005. The data has an increasing trend.
When looking into fire subcategories, the most reports belonged to: Structure Fires (37.6%), and Outside Fires (31.4%).
Fire incident types reported to NFIRS in Zip Code 33334


 Nearest zip codes: 33306, 33308, 33305, 33309, 33304, 33060.


 Based on the data from the years 2002 - 2018 the average number of fire incidents per year is 63. The highest number of reported fire incidents - 78 took place in 2013, and the least - 24 in 2005. The data has an increasing trend.
 When looking into fire subcategories, the most reports belonged to: Structure Fires (37.6%), and Outside Fires (31.4%).