Estimated zip code population in 2022: 29,207 Zip code population in 2010: 28,217 Zip code population in 2000: 28,554
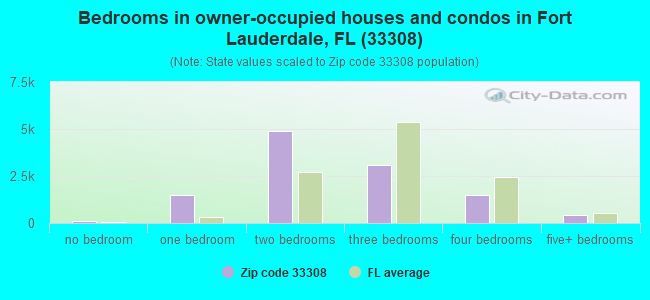
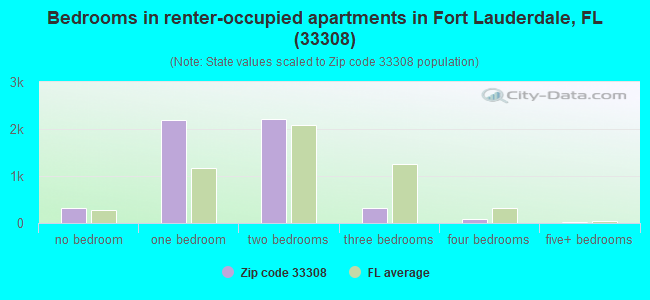
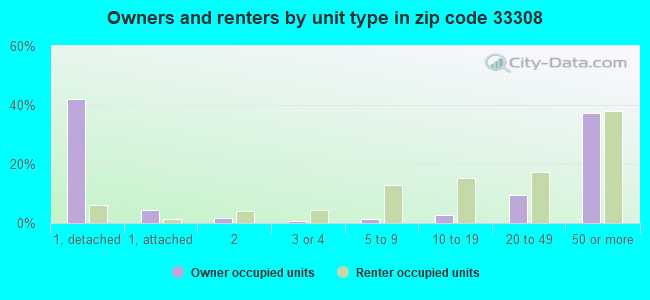
Houses and condos: 24,407 Renter-occupied apartments: 5,098
% of renters here:
31%
State:
33%
March 2022 cost of living index in zip code 33308: 111.2 (more than average, U.S. average is 100)
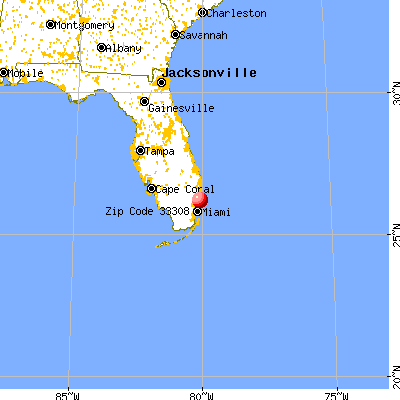
Land area: 4.5 sq. mi. Water area: 1.1 sq. mi.
Population density: 6,422 people per square mile
(high).
OSM Map
General Map
Google Map
MSN Map
OSM Map
General Map
Google Map
MSN Map
OSM Map
General Map
Google Map
MSN Map
OSM Map
General Map
Google Map
MSN Map
Please wait while loading the map...
Real estate property taxes paid for housing units in 2022:
This zip code:
0.9% ($5,184)
Florida:
0.7% ($2,529)
Median real estate property taxes paid for housing units with mortgages in 2022: $5,724 (0.9%) Median real estate property taxes paid for housing units with no mortgage in 2022: $4,895 (0.9%)
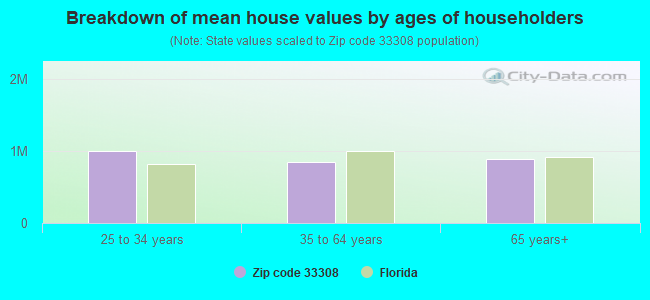
Estimated median house/condo value in 2022: $593,560
33308:
$593,560
Florida:
$354,100
According to our research of Florida and other state lists, there were 21 registered sex offenders living in 33308 zip code as of April 27, 2024. The ratio of all residents to sex offenders in zip code 33308 is 1,336 to 1. The ratio of registered sex offenders to all residents in this zip code is lower than the state average.
Median resident age:
This zip code:
56.9 years
Florida median age:
42.7 years
Average household size:
This zip code:
1.8 people
Florida:
2.5 people
Averages for the 2020 tax year for zip code 33308, filed in 2021:
Average Adjusted Gross Income (AGI) in 2020: $189,180 (Individual Income Tax Returns)
Here:
$189,180
State:
$82,200
Salary/wage: $119,119 (reported on 63.8% of returns)
Here:
$119,119
State:
$58,347
(% of AGI for various income ranges: 1125.4% for AGIs below $25k, 3598.3% for AGIs $25k-50k, 6325.6% for AGIs $50k-75k, 9348.5% for AGIs $75k-100k, 17826.9% for AGIs $100k-200k, 140788.4% for AGIs over 200k)
Taxable interest for individuals: $7,330 (reported on 47.6% of returns)
This zip code:
$7,330
Florida:
$4,272
(% of AGI for various income ranges: 97.9% for AGIs below $25k, 137.0% for AGIs $25k-50k, 226.3% for AGIs $50k-75k, 383.9% for AGIs $75k-100k, 699.5% for AGIs $100k-200k, 6810.7% for AGIs over 200k)
Ordinary dividends: $29,308 (reported on 42.2% of returns)
Here:
$29,308
State:
$15,863
(% of AGI for various income ranges: 168.3% for AGIs below $25k, 254.5% for AGIs $25k-50k, 519.3% for AGIs $50k-75k, 925.6% for AGIs $75k-100k, 2169.9% for AGIs $100k-200k, 27487.2% for AGIs over 200k)
Net capital gain/loss in AGI: +$84,172 (reported on 42.2% of returns)
Here:
+$84,172
State:
+$62,983
(% of AGI for various income ranges: 37.2% for AGIs below $25k, 167.4% for AGIs $25k-50k, 375.6% for AGIs $50k-75k, 744.8% for AGIs $75k-100k, 2434.5% for AGIs $100k-200k, 95317.4% for AGIs over 200k)
Profit/loss from business: +$19,320 (reported on 21.8% of returns)
Here:
+$19,320
State:
+$9,719
(% of AGI for various income ranges: 321.4% for AGIs below $25k, 272.7% for AGIs $25k-50k, 438.1% for AGIs $50k-75k, 477.8% for AGIs $75k-100k, 1021.2% for AGIs $100k-200k, 6326.7% for AGIs over 200k)
Taxable individual retirement arrangement distribution: $32,552 (reported on 15.5% of returns)
33308:
$32,552
Florida:
$24,823
(% of AGI for various income ranges: 142.3% for AGIs below $25k, 277.5% for AGIs $25k-50k, 486.4% for AGIs $50k-75k, 974.2% for AGIs $75k-100k, 1713.3% for AGIs $100k-200k, 7250.2% for AGIs over 200k)
Self-employed (Keogh) retirement plans: $25,585 (reported on 1.2% of returns)
33308:
$25,585
Florida:
$29,694
(% of AGI for various income ranges: 22.7% for AGIs $50k-75k, 80.7% for AGIs $100k-200k, 665.5% for AGIs over 200k)
Total itemized deductions: $62,969 (reported on 18.3% of returns)
Here:
$62,969
State:
$45,393
(% of AGI for various income ranges: 182.7% for AGIs below $25k, 383.2% for AGIs $25k-50k, 664.5% for AGIs $50k-75k, 1074.6% for AGIs $75k-100k, 2045.0% for AGIs $100k-200k, 24332.6% for AGIs over 200k)
Charity contributions: $18,730 (reported on 15.6% of returns)
Here:
$18,730
State:
$20,178
(% of AGI for various income ranges: 13.6% for AGIs below $25k, 35.8% for AGIs $25k-50k, 100.0% for AGIs $50k-75k, 168.5% for AGIs $75k-100k, 341.5% for AGIs $100k-200k, 7168.8% for AGIs over 200k)
Taxes paid: $7,884 (reported on 18.3% of returns)
33308:
$7,884
State:
$6,967
(% of AGI for various income ranges: 41.8% for AGIs below $25k, 79.2% for AGIs $25k-50k, 146.8% for AGIs $50k-75k, 242.2% for AGIs $75k-100k, 505.6% for AGIs $100k-200k, 2067.6% for AGIs over 200k)
Earned income credit: $1,311 (reported on 7.5% of returns)
Here:
$1,311
State:
$2,306
(% of AGI for various income ranges: 53.1% for AGIs below $25k, 21.0% for AGIs $25k-50k)
Percentage of individuals using paid preparers for their 2020 taxes: 90.8%
Here:
91%
State:
92%
(% for various income ranges: 89.7% for AGIs below $25k, 90.8% for AGIs $25k-50k, 91.0% for AGIs $50k-75k, 90.0% for AGIs $75k-100k, 90.8% for AGIs $100k-200k, 93.2% for AGIs over 200k)
Averages for the 2012 tax year for zip code 33308, filed in 2013:
Average Adjusted Gross Income (AGI) in 2012: $120,782 (Individual Income Tax Returns)
Here:
$120,782
State:
$60,316
Salary/wage: $82,997 (reported on 65.5% of returns)
Here:
$82,997
State:
$45,277
(% of AGI for various income ranges: 54.8% for AGIs below $25k, 64.5% for AGIs $25k-50k, 59.6% for AGIs $50k-75k, 54.5% for AGIs $75k-100k, 54.3% for AGIs $100k-200k, 37.3% for AGIs over 200k)
Taxable interest for individuals: $8,142 (reported on 50.7% of returns)
This zip code:
$8,142
Florida:
$3,587
(% of AGI for various income ranges: 5.0% for AGIs below $25k, 2.6% for AGIs $25k-50k, 2.7% for AGIs $50k-75k, 2.9% for AGIs $75k-100k, 2.5% for AGIs $100k-200k, 3.8% for AGIs over 200k)
Ordinary dividends: $23,268 (reported on 40.6% of returns)
Here:
$23,268
State:
$12,831
(% of AGI for various income ranges: 8.6% for AGIs below $25k, 5.0% for AGIs $25k-50k, 5.0% for AGIs $50k-75k, 5.2% for AGIs $75k-100k, 5.7% for AGIs $100k-200k, 9.2% for AGIs over 200k)
Net capital gain/loss in AGI: +$46,309 (reported on 38.2% of returns)
Here:
+$46,309
State:
+$33,493
(% of AGI for various income ranges: 0.5% for AGIs $25k-50k, 1.4% for AGIs $50k-75k, 3.2% for AGIs $75k-100k, 3.4% for AGIs $100k-200k, 22.7% for AGIs over 200k)
Profit/loss from business: +$18,743 (reported on 17.9% of returns)
Here:
+$18,743
State:
+$10,012
(% of AGI for various income ranges: 11.2% for AGIs below $25k, 4.2% for AGIs $25k-50k, 3.0% for AGIs $50k-75k, 2.9% for AGIs $75k-100k, 3.3% for AGIs $100k-200k, 2.0% for AGIs over 200k)
Taxable individual retirement arrangement distribution: $29,772 (reported on 18.8% of returns)
33308:
$29,772
Florida:
$21,544
(% of AGI for various income ranges: 6.7% for AGIs below $25k, 4.8% for AGIs $25k-50k, 4.7% for AGIs $50k-75k, 5.8% for AGIs $75k-100k, 6.8% for AGIs $100k-200k, 3.8% for AGIs over 200k)
Self-employment retirement plans: $19,860 (reported on 1.0% of returns)
33308:
$19,860
Florida:
$20,611
(% of AGI for various income ranges: 0.2% for AGIs $25k-50k, 0.2% for AGIs $100k-200k, 0.2% for AGIs over 200k)
Total itemized deductions: $34,693 (16% of AGI, reported on 42.9% of returns)
Here:
$34,693
State:
$25,533
Here:
15.6% of AGI
State:
18.0% of AGI
(% of AGI for various income ranges: 22.5% for AGIs below $25k, 15.8% for AGIs $25k-50k, 14.9% for AGIs $50k-75k, 15.2% for AGIs $75k-100k, 15.4% for AGIs $100k-200k, 10.0% for AGIs over 200k)
Charity contributions: $5,977 (reported on 36.4% of returns)
Here:
$5,977
State:
$5,698
(% of AGI for various income ranges: 1.2% for AGIs below $25k, 1.4% for AGIs $25k-50k, 1.7% for AGIs $50k-75k, 1.7% for AGIs $75k-100k, 1.9% for AGIs $100k-200k, 1.9% for AGIs over 200k)
Taxes paid: $10,569 (reported on 42.0% of returns)
33308:
$10,569
State:
$6,203
(% of AGI for various income ranges: 5.1% for AGIs below $25k, 3.7% for AGIs $25k-50k, 3.9% for AGIs $50k-75k, 4.2% for AGIs $75k-100k, 4.7% for AGIs $100k-200k, 3.2% for AGIs over 200k)
Earned income credit: $1,387 (reported on 8.1% of returns)
Here:
$1,387
State:
$2,372
(% of AGI for various income ranges: 2.4% for AGIs below $25k, 0.3% for AGIs $25k-50k)
Percentage of individuals using paid preparers for their 2012 taxes: 67.9%
Here:
68%
State:
54%
(% for various income ranges: 63.7% for AGIs below $25k, 62.8% for AGIs $25k-50k, 64.1% for AGIs $50k-75k, 69.3% for AGIs $75k-100k, 74.1% for AGIs $100k-200k, 86.9% for AGIs over 200k)
Averages for the 2004 tax year for zip code 33308, filed in 2005:
Average Adjusted Gross Income (AGI) in 2004: $95,113 (Individual Income Tax Returns)
Here:
$95,113
State:
$50,523
Salary/wage: $66,253 (reported on 63.1% of returns)
Here:
$66,253
State:
$39,563
(% of AGI for various income ranges: 53.8% for AGIs $10k-25k, 62.8% for AGIs $25k-50k, 56.1% for AGIs $50k-75k, 55.6% for AGIs $75k-100k, 35.1% for AGIs over 100k)
Taxable interest for individuals: $7,494 (reported on 63.3% of returns)
This zip code:
$7,494
Florida:
$3,211
(% of AGI for various income ranges: 9.0% for AGIs $10k-25k, 5.2% for AGIs $25k-50k, 5.1% for AGIs $50k-75k, 4.6% for AGIs $75k-100k, 4.0% for AGIs over 100k)
Taxable dividends: $13,814 (reported on 48.1% of returns)
Here:
$13,814
State:
$6,129
(% of AGI for various income ranges: 7.8% for AGIs $10k-25k, 5.1% for AGIs $25k-50k, 5.3% for AGIs $50k-75k, 5.7% for AGIs $75k-100k, 6.5% for AGIs over 100k)
Net capital gain/loss: +$45,210 (reported on 46.6% of returns)
Here:
+$45,210
State:
+$27,205
(% of AGI for various income ranges: 0.5% for AGIs $10k-25k, 1.9% for AGIs $25k-50k, 3.1% for AGIs $50k-75k, 4.0% for AGIs $75k-100k, 27.4% for AGIs over 100k)
Profit/loss from business: +$24,577 (reported on 17.1% of returns)
Here:
+$24,577
State:
+$10,634
(% of AGI for various income ranges: 8.8% for AGIs $10k-25k, 4.5% for AGIs $25k-50k, 3.9% for AGIs $50k-75k, 3.2% for AGIs $75k-100k, 4.0% for AGIs over 100k)
IRA payment deduction: $3,511 (reported on 4.3% of returns)
33308:
$3,511
Florida:
$3,082
(% of AGI for various income ranges: 0.5% for AGIs $10k-25k, 0.4% for AGIs $25k-50k, 0.3% for AGIs $50k-75k, 0.3% for AGIs $75k-100k, 0.1% for AGIs over 100k)
Self-employed pension: $16,935 (reported on 1.3% of returns)
Here:
$16,935
Florida:
$15,857
(% of AGI for various income ranges: 0.1% for AGIs $25k-50k, 0.2% for AGIs $50k-75k, 0.2% for AGIs $75k-100k, 0.2% for AGIs over 100k)
Total itemized deductions: $27,231 (16% of AGI, reported on 47.4% of returns)
Here:
$27,231
State:
$20,370
Here:
16.2% of AGI
State:
20.7% of AGI
(% of AGI for various income ranges: 25.0% for AGIs $10k-25k, 19.0% for AGIs $25k-50k, 19.2% for AGIs $50k-75k, 18.6% for AGIs $75k-100k, 10.1% for AGIs over 100k)
Charity contributions deductions: $6,726 (4% of AGI, reported on 41.8% of returns)
Here:
$6,726
State:
$4,064
Here:
3.8% of AGI
State:
3.8% of AGI
(% of AGI for various income ranges: 2.0% for AGIs $10k-25k, 2.0% for AGIs $25k-50k, 2.2% for AGIs $50k-75k, 2.6% for AGIs $75k-100k, 3.0% for AGIs over 100k)
Total tax: $22,795 (reported on 81.3% of returns)
33308:
$22,795
State:
$9,431
(% of AGI for various income ranges: 4.9% for AGIs $10k-25k, 8.6% for AGIs $25k-50k, 11.3% for AGIs $50k-75k, 12.4% for AGIs $75k-100k, 21.4% for AGIs over 100k)
Earned income credit: $909 (reported on 5.6% of returns)
Here:
$909
State:
$1,808
Percentage of individuals using paid preparers for their 2004 taxes: 70.8%
Here:
71%
State:
60%
(% for various income ranges: 70.5% for AGIs below $10k, 66.8% for AGIs $10k-25k, 64.5% for AGIs $25k-50k, 69.6% for AGIs $50k-75k, 72.8% for AGIs $75k-100k, 82.0% for AGIs over 100k)
Likely homosexual households (counted as self-reported same-sex unmarried-partner households)
Lesbian couples: 0.2% of all households
Gay men: 1.5% of all households
Household received Food Stamps/SNAP in the past 12 months: 489 Household did not receive Food Stamps/SNAP in the past 12 months: 16,180
Women who had a birth in the past 12 months: 248 (235 now married, 22 unmarried) Women who did not have a birth in the past 12 months: 4,445 (1,828 now married, 2,617 unmarried)
Housing units in zip code 33308 with a mortgage: 5,401 (667 second mortgage, 622 both second mortgage and home equity loan) Houses without a mortgage: 106
Median monthly owner costs for units with a mortgage: $2,829 Median monthly owner costs for units without a mortgage: $1,147
Residents with income below the poverty level in 2022:
This zip code:
7.3%
Whole state:
12.7%
Residents with income below 50% of the poverty level in 2022:
This zip code:
2.5%
Whole state:
6.6%
Median number of rooms in houses and condos:
Here:
5.0
State:
5.9
Median number of rooms in apartments:
Here:
3.4
State:
4.2
Notable locations in this zip code not listed on our city pages
Notable locations in zip code 33308: Coral Ridge Country Club (A), Imperial Shopping Plaza (B), Coral Ridge Shopping Plaza (C), Delray Dunes Golf and Country Club (D), Mercy Manor North (E), Manor Oaks Nursing and Rehabilitation Center (F), Imperial Point Branch Library (G), Fort Lauderdale Health and Rehabilitation Center (H), Galt Ocean Mile Reading Center (I), Fire Station Number 35 (J), Fire Station Number 54 (K), Fort Lauderdale Fire Rescue Station 35 (L), Fort Lauderdale Fire Rescue Station 54 (M), Broward County Sheriffs Office Department of Fire Rescue and Emergency Services Station 12 (N), Lauderdale by the Sea Police Department (O), Sea Ranch Lakes Police Department (P). Display/hide their locations on the map
Shopping Centers: Imperial Square Shopping Center (1), Benefit Mall (2), Sea Ranch Village Shopping Center (3), The Galleria at Fort Lauderdale Shopping Center (4). Display/hide their locations on the map
Churches in zip code 33308 include: Methodist Church Parkway United (A), Coral Ridge Presbyterian Church (B), Saint Johns Christian Church (C), Second Presbyterian Church (D). Display/hide their locations on the map
2,311 married couples with children.
481 single-parent households (254 men, 227 women).
76.1% of residents of 33308 zip code speak English at home.
13.0% of residents speak Spanish at home (78% very well, 16% well, 4% not well, 2% not at all).
8.5% of residents speak other Indo-European language at home (75% very well, 22% well, 3% not well).
2.1% of residents speak Asian or Pacific Island language at home (74% very well, 14% well, 6% not well, 6% not at all).
0.7% of residents speak other language at home (85% very well, 15% well).
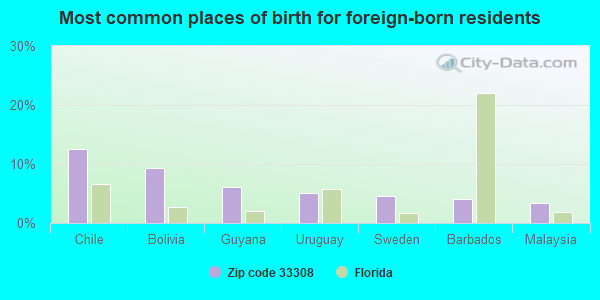
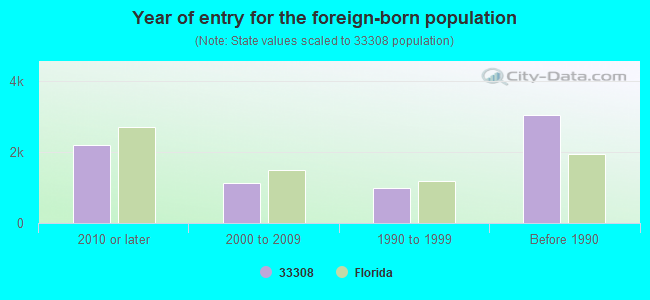
Foreign born population: 6,915 (23.7%) (63.3% of them are naturalized citizens)
Major facilities with environmental interests located in this zip code:
SAAB OF FT LAUDERDALE (5810 NORTH FEDERAL HWY in FORT LAUDERDALE, FL)
(Integrated Compliance Information System) - ICIS-HQ-1980-0023, FORMAL ENFORCEMENT ACTION Small Quantity Generators, between 100 kg and 1000 kg of hazardous waste/month (Resource Conservation and Recovery Act (tracking hazardous waste)) - notification Business SIC classification: MOTOR VEHICLE DEALERS (NEW AND USED) Organizations: SHALLA RICHARD, GM (CONTACT/OWNER)
ALEX-PHIL CLEANERS INC (5780 NORTH FEDERAL HIGHWAY in FORT LAUDERDALE, FL)
AIR MINOR (AIRS/AFS) Small Quantity Generators, between 100 kg and 1000 kg of hazardous waste/month (Resource Conservation and Recovery Act (tracking hazardous waste)) - notification Business SIC classification: DRYCLEANING PLANTS, EXCEPT RUG CLEANING Organizations: NICK ARPAJIAN, VP (CONTACT/OWNER)
Alternative names: FASHION CLEANERS INC
GOLDBERG CLEANERS INC (2300 NE 62ND ST in FT LAUDERDALE, FL)
AIR MINOR (AIRS/AFS) (Resource Conservation and Recovery Act (tracking hazardous waste)) Business SIC classification: DRYCLEANING PLANTS, EXCEPT RUG CLEANING Organizations: MARCO LASPRILLA (CONTACT/OWNER)
Alternative names: EXECUTIVE CLEANERS
JADE OCEAN CLEANERS INC (3928 N OCEAN AVE in FORT LAUDERDALE, FL)
AIR MINOR (AIRS/AFS) (Resource Conservation and Recovery Act (tracking hazardous waste)) Business SIC classification: DRYCLEANING PLANTS, EXCEPT RUG CLEANING Organizations: LAWRENCE TODOKER, PRES (CONTACT/OWNER)
SARA JEANNE CORPORATION (6604 N FEDERAL HWY in FORT LAUDERDALE, FL)
AIR MINOR (AIRS/AFS) (Resource Conservation and Recovery Act (tracking hazardous waste)) Business SIC classification: DRYCLEANING PLANTS, EXCEPT RUG CLEANING Alternative names: NU LOOK 1HR CLEANERS #8, NULOOK ONE HOUR NUMBER 08
HOLY CROSS HOSPITAL (4725 N FEDERAL HWY in FORT LAUDERDALE, FL)
AIR MINOR (AIRS/AFS) CRITERIA AND HAZARDOUS AIR POLLUTANT INVENTORY (Inventory of air pollution sources) Small Quantity Generators, between 100 kg and 1000 kg of hazardous waste/month (Resource Conservation and Recovery Act (tracking hazardous waste)) - notification Business SIC and NAICS classification: GENERAL MEDICAL AND SURGICAL HOSPITALS Organizations: ROBERT J MILLER, DIR OF ENG (CONTACT/OWNER)
HANDCRAFT CUSTOM DRY CLEANERS, INC. (2720 E. COMMERCIAL BLVD in FORT LAUDERDALE, FL)
AIR MINOR (AIRS/AFS) Small Quantity Generators, between 100 kg and 1000 kg of hazardous waste/month (Resource Conservation and Recovery Act (tracking hazardous waste)) - notification Business SIC classification: DRYCLEANING PLANTS, EXCEPT RUG CLEANING Organizations: ANTHONY CHOUVALIS (CONTACT/OWNER)
Alternative names: HANDCRAFT CLEANERS
HESS #09539 (3053 N OCEAN BLVD in FORT LAUDERDALE, FL)
National Pollutant Discharge Elimination System NON-MAJOR (Tracking pollutant discharge elimination systems) - permit Business SIC classification: GASOLINE SERVICE STATIONS Organizations: GEOFFREY BEARDALL (CONTACT/OWNER)
LOOK-ON THE BEACH CLEANERS (3341 E OAKLAND PARK BLVD in FORT LAUDERDALE, FL)
AIR MINOR (AIRS/AFS) Small Quantity Generators, between 100 kg and 1000 kg of hazardous waste/month (Resource Conservation and Recovery Act (tracking hazardous waste)) - notification Business SIC classification: DRYCLEANING PLANTS, EXCEPT RUG CLEANING Organizations: ARNOLD N SILVA, PRESIDENT (CONTACT/OWNER)
ONE HOUR MARTINIZING (6239 NORTH FEDERAL HIGHWAY in FORT LAUDERDALE, FL)
AIR MINOR (AIRS/AFS) Small Quantity Generators, between 100 kg and 1000 kg of hazardous waste/month (Resource Conservation and Recovery Act (tracking hazardous waste)) - notification Business SIC classification: DRYCLEANING PLANTS, EXCEPT RUG CLEANING Organizations: ROBERT KRUSE (CONTACT/OWNER)
REGAL CLEANERS (3318 NE 34TH STREET in FORT LAUDERDALE, FL)
AIR MINOR (AIRS/AFS) Small Quantity Generators, between 100 kg and 1000 kg of hazardous waste/month (Resource Conservation and Recovery Act (tracking hazardous waste)) - notification Business SIC classification: DRYCLEANING PLANTS, EXCEPT RUG CLEANING Organizations: HERNANDO VIDAL, MANAGER (CONTACT/OWNER)
1930 BUILDING AT HOLY CROSS HO (1930 NE 47TH ST in FT LAUDERDALE, FL)
National Pollutant Discharge Elimination System NON-MAJOR (Tracking pollutant discharge elimination systems) - permit Organizations: GEORGE SPADAFORA (CONTACT/OWNER)
J & H KOAM CORP (4306 N FEDERAL HWY in FORT LAUDERDALE, FL)
(Resource Conservation and Recovery Act (tracking hazardous waste)) Alternative names: NU LOOK 1 HOUR CLEANERS #52
Housing units lacking complete plumbing facilities: 0.3% Housing units lacking complete kitchen facilities: 0.6%
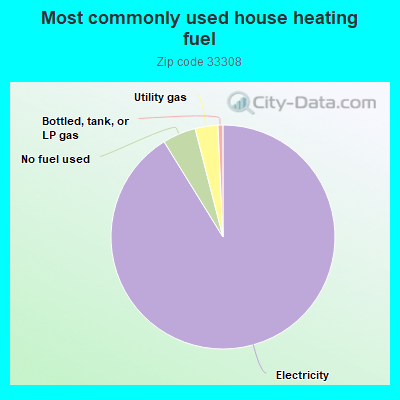
91.1%Electricity
4.8%No fuel used
3.3%Utility gas
0.7%Bottled, tank, or LP gas
Population in 1990: 28,624.
Place of birth for U.S.-born residents:
This state: 6,016
Northeast: 8,552
Midwest: 3,802
South: 2,258
West: 1,226
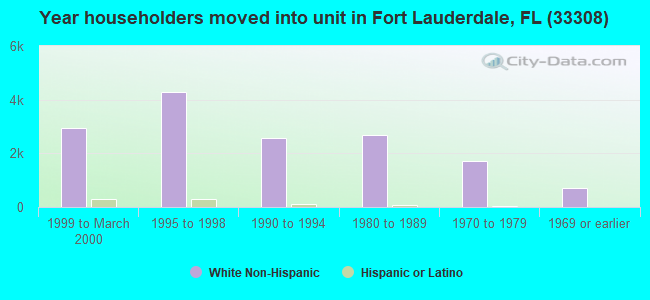
54% of the 33308 zip code residents lived in the same house 5 years ago. Out of people who lived in different houses, 57% lived in this county. Out of people who lived in different counties, 50% lived in Florida.
85% of the 33308 zip code residents lived in the same house 1 year ago. Out of people who lived in different houses, 41% moved from this county. Out of people who lived in different houses, 13% moved from different county within same state. Out of people who lived in different houses, 41% moved from different state. Out of people who lived in different houses, 6% moved from abroad.
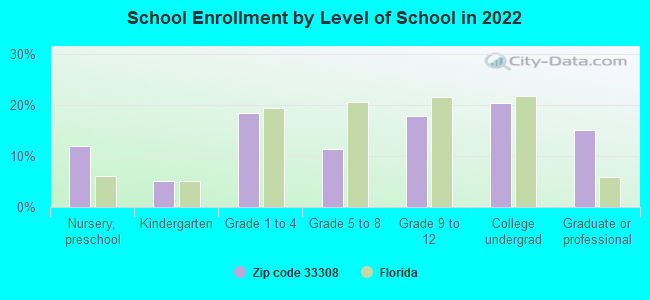
Private vs. public school enrollment:
Students in private schools in grades 1 to 8 (elementary and middle school): 528
Here:
49.4%
Florida:
15.8%
Students in private schools in grades 9 to 12 (high school): 439
Here:
68.6%
Florida:
12.9%
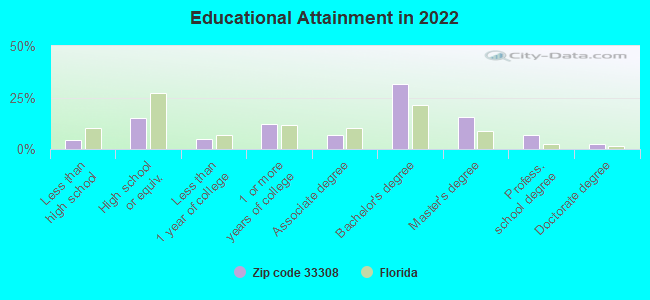
Students in private undergraduate colleges: 341
Here:
45.9%
Florida:
23.6%
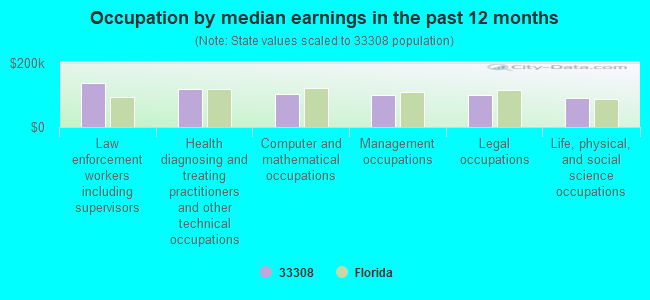
Occupation by median earnings in the past 12 months ($)
137,139Law enforcement workers including supervisors
116,959Health diagnosing and treating practitioners and other technical occupations
102,067Computer and mathematical occupations
98,432Management occupations
98,291Legal occupations
91,280Life, physical, and social science occupations
Companies with biggest federal contracts located in this zip code:
ACT II MANAGEMENT CONSULTANT & (5100 DUPONT BLVD APT 2A in FORT LAUDERDAL, FL) : $531,605 in 25 contractsfrom 2000 to 2005
Contracts for Education Services, Other Education and Training Services, Other Professional Services, Lectures For Training, and moreby Army, U.S. Army Corps of Engineers - civil program financing only Signed by year:2000: $319,352; 2001: $128,884; 2002: -$5,840; 2003: $20,639; 2004: $24,800; 2005: $43,770; 2006: $0.
Biggest contracts:
$172,948 with Army for Education Services. Signed on 2000-01-08. Completion date: 2000-07-31.
$119,004, same as above.Signed on 2000-01-10. Completion date: 2000-06-30.
$86,634 with U.S. Army Corps of Engineers - civil program financing only for Education Services. Signed on 2001-03-16. Completion date: 2001-07-13.
$42,750 with U.S. Army Corps of Engineers - civil program financing only for Education Services. Taking place in AL. Signed on 2001-11-26. Completion date: 2002-09-30.
QUALITEST USA LLC (3415 GALT OCEAN DRIVE, UNI in FORT LAUDERDAL, FL; small business) : $153,406 in 12 contractsfrom 2004 to 2006
Contracts for Electrical and Ultrasonic Erosion Machines, Laboratory Equipment and Supplies, Physical Properties Testing and Inspection, Miscellaneous Electrical and Electronic Components, and moreby Air Force, Navy, Forest Service, National Institute of Standards and Technology, and others Signed by year:2000: $0; 2001: $0; 2002: $0; 2003: $0; 2004: $54,027; 2005: $35,245; 2006: $64,134.
Biggest contracts:
$40,695 with Air Force for Electrical and Ultrasonic Erosion Machines. Signed on 2006-06-20. Completion date: 2006-08-29.
$36,588, same as above.Signed on 2004-12-01. Completion date: 2005-02-28.
$15,034 with Navy for Laboratory Equipment and Supplies. Signed on 2005-11-23. Completion date: 2006-09-30.
$14,830 with Forest Service for Laboratory Equipment and Supplies. Signed on 2006-09-15. Completion date: 2006-12-18.
IBIS AVATION INCORPORATED (5300 N FEDERAL HWY in FORT LAUDERDAL, FL; small business) : $139,691 in 6 contractsfrom 2003 to 2005
Contracts for Airframe Structural Components, Pipe, Tube and Rigid Tubing by Air Force Signed by year:2000: $0; 2001: $0; 2002: $0; 2003: $132,271; 2004: $0; 2005: $7,420; 2006: $0.
Biggest contracts:
$45,911 with Air Force for Airframe Structural Components. Signed on 2003-10-22. Completion date: 2003-11-06.
$43,000, same as above.Signed on 2003-09-18. Completion date: 2003-10-03.
$37,310, same as above.Signed on 2003-09-04. Completion date: 2003-09-19.
$26,960 with Air Force for Pipe, Tube and Rigid Tubing. Signed on 2003-07-22. Completion date: 2003-08-06.
GULF COMPONENTS INC (5100 N FEDERAL HWY in FORT LAUDERDAL, FL; small business) : $118,651 in 2 contractsfrom 1999 to 2000
$83,201 with Navy for ADP Components. Taking place in CA. Signed on 1999-10-21. Completion date: 1999-10-29.
$35,450 with Navy for Automated Information System Design and Integration Services. Signed on 2000-07-12. Completion date: 2000-08-01.
CIM CONCEPTS INC (2400 E COML BLVE STE 424 in FORT LAUDERDAL, FL; small business) : $98,685 in 2 contractsfrom 2004 to 2005
$87,685 with Navy for ADP Data Conversion Services. Taking place in CA. Signed on 2004-08-05. Completion date: 2004-11-04.
$11,000 with Navy for Other ADP and Telecommunications Services (includes data storage on tapes, compact disks, etc.). Taking place in CA. Signed on 2005-06-16. Completion date: 2006-07-11.
ASAP MEDS INC (5100 N FEDERAL HWY 3RD FL in FORT LAUDERDAL, FL; small business) : $60,950 in 2 contractsin 2006
$42,750 with Air Force for Drugs and Biologicals. Signed on 2006-03-09. Completion date: 2006-03-09.
$18,200, same as above.Signed on 2006-05-02. Completion date: 2006-05-02.
THE BILLFISH FOUNDATION INC (2161 E COML BLVD FL 2 in FORT LAUDERDALE, FL) 7 employees, $1000000 revenue. Nonprofit Organization
$60,000 with National Oceanic and Atmospheric Administration/Under Secretary for Oceans and Atmosphere for Animal and Fisheries Studies. Signed on 2002-06-15. Completion date: 2003-06-15.
OCEAN MACHINERY, INC (3081 E COMMERCIAL BLVD in FORT LAUDERDAL, FL; small business) : $54,143 in 4 contractsfrom 2003 to 2004
$37,123 with Navy for Taps, Dies, and Collets; Hand and Machine. Signed on 2003-08-14. Completion date: 2003-09-30.
$6,579 with Navy for Cutting Tools for Machine Tools. Signed on 2004-12-10. Completion date: 2005-02-18.
$5,836 with Navy for Industrial Size Reduction Machinery. Signed on 2004-08-19. Completion date: 2004-08-19.
$4,605 with Army for Bending and Forming Machines. Signed on 2004-01-29. Completion date: 2004-02-09.
CONNECTIVITY INC. (240 COMMERCIAL BLVD in LAUDERDALE BY, FL; small business)
$26,085 with Army for Radio and Television Communication Equipment, Except Airborne. Signed on 1999-12-09. Completion date: 1999-09-14.
INTERCOMP INC USA (275 COMMERCIAL BLVD in FORT LAUDERDAL, FL; small business)
$17,804 with Navy for Miscellaneous Items. Signed on 2004-03-25. Completion date: 2004-06-30.
Top industries in this zip code by the number of employees in 2005:
Health Care and Social Assistance: General Medical and Surgical Hospitals (over 1000 employees: 1 establishment, 500-999 employees: 1 establishment)
Health Care and Social Assistance: Offices of Physicians (except Mental Health Specialists) (50-99: 1, 20-49: 7, 10-19: 13, 5-9: 28, 1-4: 89)
Other Services (except Public Administration): Other Similar Organizations (except Business, Professional, Labor, and Political Organizations) (50-99: 1, 20-49: 14, 10-19: 4, 5-9: 7, 1-4: 25)
Other Services (except Public Administration): Religious Organizations (250-499: 1, 100-249: 1, 20-49: 2, 5-9: 3, 1-4: 4)
2002 - 2018 National Fire Incident Reporting System (NFIRS) incidents
Based on the data from the years 2002 - 2018 the average number of fires per year is 49. The highest number of fire incidents - 92 took place in 2009, and the least - 10 in 2002. The data has an increasing trend.
When looking into fire subcategories, the most incidents belonged to: Structure Fires (44.8%), and Outside Fires (34.5%).
Fire incident types reported to NFIRS in Zip Code 33308


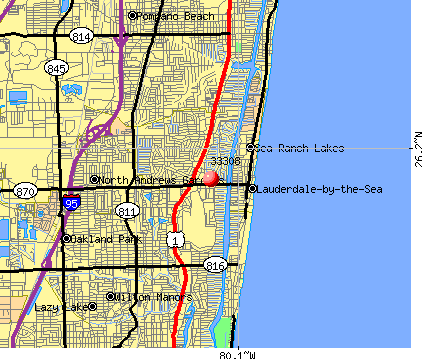 Nearest zip codes: 33306, 33334, 33305, 33060, 33304, 33062.


 Based on the data from the years 2002 - 2018 the average number of fires per year is 49. The highest number of fire incidents - 92 took place in 2009, and the least - 10 in 2002. The data has an increasing trend.
 When looking into fire subcategories, the most incidents belonged to: Structure Fires (44.8%), and Outside Fires (34.5%).