Estimated zip code population in 2022: 25,504 Zip code population in 2010: 23,948 Zip code population in 2000: 25,514
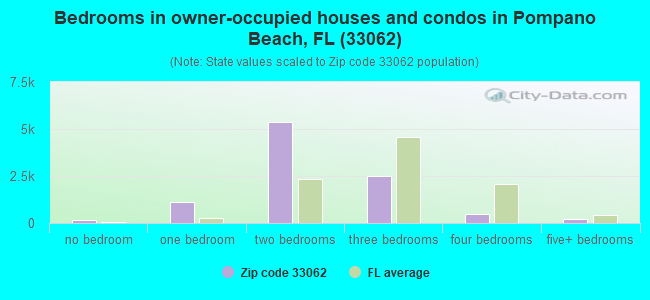
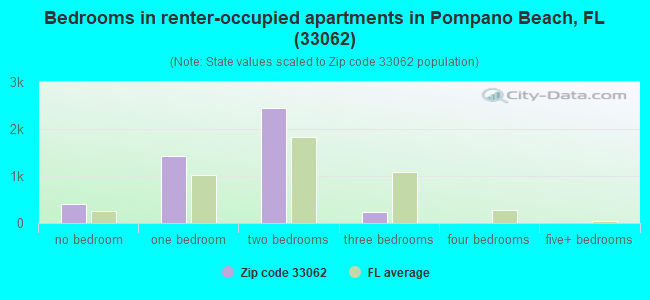
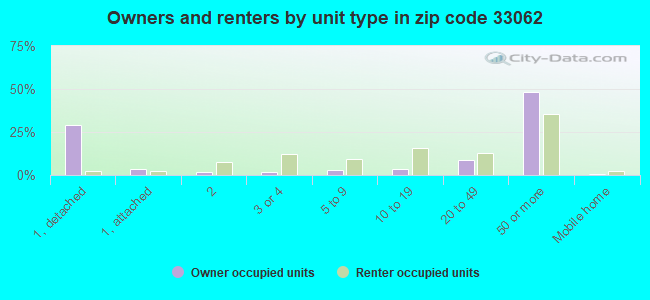
Houses and condos: 22,960 Renter-occupied apartments: 4,473
% of renters here:
31%
State:
33%
March 2022 cost of living index in zip code 33062: 111.0 (more than average, U.S. average is 100)
Land area: 3.8 sq. mi. Water area: 2.3 sq. mi.
Population density: 6,708 people per square mile
(high).
OSM Map
General Map
Google Map
MSN Map
OSM Map
General Map
Google Map
MSN Map
OSM Map
General Map
Google Map
MSN Map
OSM Map
General Map
Google Map
MSN Map
Please wait while loading the map...
Real estate property taxes paid for housing units in 2022:
This zip code:
0.9% ($5,204)
Florida:
0.7% ($2,529)
Median real estate property taxes paid for housing units with mortgages in 2022: $5,706 (1.0%) Median real estate property taxes paid for housing units with no mortgage in 2022: $5,013 (0.9%)
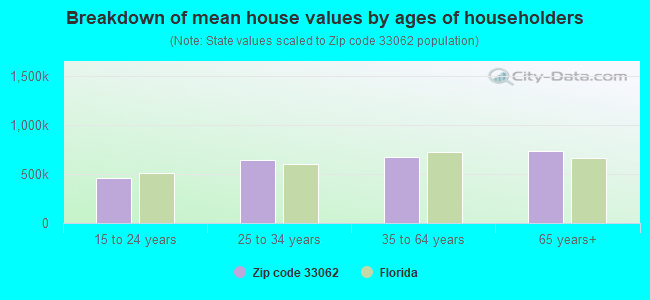
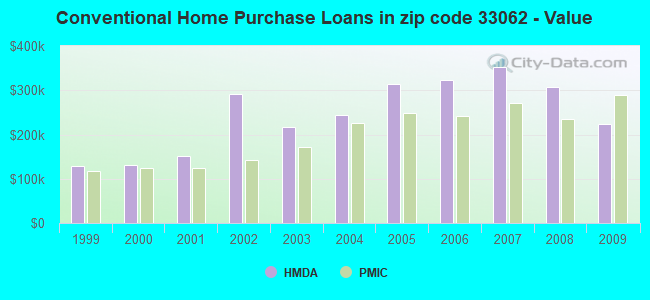
Estimated median house/condo value in 2022: $563,506
33062:
$563,506
Florida:
$354,100
According to our research of Florida and other state lists, there were 14 registered sex offenders living in 33062 zip code as of April 26, 2024. The ratio of all residents to sex offenders in zip code 33062 is 1,555 to 1. The ratio of registered sex offenders to all residents in this zip code is much lower than the state average.
Median resident age:
This zip code:
59.6 years
Florida median age:
42.7 years
Average household size:
This zip code:
1.8 people
Florida:
2.5 people
Averages for the 2020 tax year for zip code 33062, filed in 2021:
Average Adjusted Gross Income (AGI) in 2020: $191,769 (Individual Income Tax Returns)
Here:
$191,769
State:
$82,200
Salary/wage: $96,318 (reported on 62.9% of returns)
Here:
$96,318
State:
$58,347
(% of AGI for various income ranges: 1091.4% for AGIs below $25k, 3493.3% for AGIs $25k-50k, 6028.1% for AGIs $50k-75k, 9245.3% for AGIs $75k-100k, 16391.3% for AGIs $100k-200k, 117772.6% for AGIs over 200k)
Taxable interest for individuals: $10,219 (reported on 46.1% of returns)
This zip code:
$10,219
Florida:
$4,272
(% of AGI for various income ranges: 80.4% for AGIs below $25k, 114.2% for AGIs $25k-50k, 213.2% for AGIs $50k-75k, 381.1% for AGIs $75k-100k, 695.1% for AGIs $100k-200k, 12730.0% for AGIs over 200k)
Ordinary dividends: $25,268 (reported on 41.0% of returns)
Here:
$25,268
State:
$15,863
(% of AGI for various income ranges: 140.2% for AGIs below $25k, 252.4% for AGIs $25k-50k, 481.4% for AGIs $50k-75k, 797.0% for AGIs $75k-100k, 1929.3% for AGIs $100k-200k, 27135.1% for AGIs over 200k)
Net capital gain/loss in AGI: +$112,444 (reported on 40.8% of returns)
Here:
+$112,444
State:
+$62,983
(% of AGI for various income ranges: 51.4% for AGIs below $25k, 166.4% for AGIs $25k-50k, 303.9% for AGIs $50k-75k, 575.4% for AGIs $75k-100k, 1938.5% for AGIs $100k-200k, 155912.1% for AGIs over 200k)
Profit/loss from business: +$15,099 (reported on 21.1% of returns)
Here:
+$15,099
State:
+$9,719
(% of AGI for various income ranges: 311.1% for AGIs below $25k, 338.5% for AGIs $25k-50k, 339.6% for AGIs $50k-75k, 493.4% for AGIs $75k-100k, 751.0% for AGIs $100k-200k, 4407.4% for AGIs over 200k)
Taxable individual retirement arrangement distribution: $30,423 (reported on 16.6% of returns)
33062:
$30,423
Florida:
$24,823
(% of AGI for various income ranges: 132.3% for AGIs below $25k, 271.0% for AGIs $25k-50k, 490.3% for AGIs $50k-75k, 913.7% for AGIs $75k-100k, 2004.2% for AGIs $100k-200k, 7765.4% for AGIs over 200k)
Self-employed (Keogh) retirement plans: $35,533 (reported on 0.9% of returns)
33062:
$35,533
Florida:
$29,694
(% of AGI for various income ranges: 76.3% for AGIs $100k-200k, 885.9% for AGIs over 200k)
Total itemized deductions: $75,782 (reported on 16.1% of returns)
Here:
$75,782
State:
$45,393
(% of AGI for various income ranges: 163.1% for AGIs below $25k, 298.4% for AGIs $25k-50k, 664.0% for AGIs $50k-75k, 869.1% for AGIs $75k-100k, 1691.8% for AGIs $100k-200k, 33535.9% for AGIs over 200k)
Charity contributions: $32,380 (reported on 13.3% of returns)
Here:
$32,380
State:
$20,178
(% of AGI for various income ranges: 9.5% for AGIs below $25k, 24.9% for AGIs $25k-50k, 69.7% for AGIs $50k-75k, 126.1% for AGIs $75k-100k, 252.2% for AGIs $100k-200k, 14175.4% for AGIs over 200k)
Taxes paid: $7,905 (reported on 15.9% of returns)
33062:
$7,905
State:
$6,967
(% of AGI for various income ranges: 33.4% for AGIs below $25k, 67.9% for AGIs $25k-50k, 148.1% for AGIs $50k-75k, 216.6% for AGIs $75k-100k, 434.2% for AGIs $100k-200k, 2043.1% for AGIs over 200k)
Earned income credit: $1,300 (reported on 8.1% of returns)
Here:
$1,300
State:
$2,306
(% of AGI for various income ranges: 54.0% for AGIs below $25k, 21.0% for AGIs $25k-50k)
Percentage of individuals using paid preparers for their 2020 taxes: 91.0%
Here:
91%
State:
92%
(% for various income ranges: 89.2% for AGIs below $25k, 91.4% for AGIs $25k-50k, 91.7% for AGIs $50k-75k, 93.3% for AGIs $75k-100k, 91.4% for AGIs $100k-200k, 91.0% for AGIs over 200k)
Averages for the 2012 tax year for zip code 33062, filed in 2013:
Average Adjusted Gross Income (AGI) in 2012: $104,730 (Individual Income Tax Returns)
Here:
$104,730
State:
$60,316
Salary/wage: $65,537 (reported on 65.8% of returns)
Here:
$65,537
State:
$45,277
(% of AGI for various income ranges: 61.1% for AGIs below $25k, 62.9% for AGIs $25k-50k, 58.6% for AGIs $50k-75k, 54.2% for AGIs $75k-100k, 52.1% for AGIs $100k-200k, 29.1% for AGIs over 200k)
Taxable interest for individuals: $7,765 (reported on 47.9% of returns)
This zip code:
$7,765
Florida:
$3,587
(% of AGI for various income ranges: 4.7% for AGIs below $25k, 2.7% for AGIs $25k-50k, 2.5% for AGIs $50k-75k, 2.9% for AGIs $75k-100k, 2.9% for AGIs $100k-200k, 4.0% for AGIs over 200k)
Ordinary dividends: $18,258 (reported on 37.3% of returns)
Here:
$18,258
State:
$12,831
(% of AGI for various income ranges: 7.5% for AGIs below $25k, 5.4% for AGIs $25k-50k, 5.0% for AGIs $50k-75k, 5.6% for AGIs $75k-100k, 6.1% for AGIs $100k-200k, 7.0% for AGIs over 200k)
Net capital gain/loss in AGI: +$43,312 (reported on 35.4% of returns)
Here:
+$43,312
State:
+$33,493
(% of AGI for various income ranges: 0.8% for AGIs $25k-50k, 1.6% for AGIs $50k-75k, 1.5% for AGIs $75k-100k, 2.8% for AGIs $100k-200k, 24.9% for AGIs over 200k)
Profit/loss from business: +$17,585 (reported on 18.3% of returns)
Here:
+$17,585
State:
+$10,012
(% of AGI for various income ranges: 11.4% for AGIs below $25k, 5.2% for AGIs $25k-50k, 3.8% for AGIs $50k-75k, 2.2% for AGIs $75k-100k, 2.7% for AGIs $100k-200k, 2.3% for AGIs over 200k)
Taxable individual retirement arrangement distribution: $25,618 (reported on 19.4% of returns)
33062:
$25,618
Florida:
$21,544
(% of AGI for various income ranges: 6.5% for AGIs below $25k, 5.1% for AGIs $25k-50k, 5.3% for AGIs $50k-75k, 6.4% for AGIs $75k-100k, 7.8% for AGIs $100k-200k, 3.3% for AGIs over 200k)
Self-employment retirement plans: $22,282 (reported on 0.8% of returns)
33062:
$22,282
Florida:
$20,611
(% of AGI for various income ranges: 0.2% for AGIs $25k-50k, 0.4% for AGIs $75k-100k, 0.2% for AGIs over 200k)
Total itemized deductions: $34,976 (17% of AGI, reported on 39.1% of returns)
Here:
$34,976
State:
$25,533
Here:
17.4% of AGI
State:
18.0% of AGI
(% of AGI for various income ranges: 20.8% for AGIs below $25k, 15.7% for AGIs $25k-50k, 15.5% for AGIs $50k-75k, 14.3% for AGIs $75k-100k, 14.6% for AGIs $100k-200k, 11.2% for AGIs over 200k)
Charity contributions: $6,202 (reported on 32.5% of returns)
Here:
$6,202
State:
$5,698
(% of AGI for various income ranges: 1.1% for AGIs below $25k, 1.3% for AGIs $25k-50k, 1.4% for AGIs $50k-75k, 1.5% for AGIs $75k-100k, 1.7% for AGIs $100k-200k, 2.3% for AGIs over 200k)
Taxes paid: $10,169 (reported on 38.4% of returns)
33062:
$10,169
State:
$6,203
(% of AGI for various income ranges: 5.1% for AGIs below $25k, 3.8% for AGIs $25k-50k, 4.0% for AGIs $50k-75k, 4.2% for AGIs $75k-100k, 4.7% for AGIs $100k-200k, 3.2% for AGIs over 200k)
Earned income credit: $1,473 (reported on 10.5% of returns)
Here:
$1,473
State:
$2,372
(% of AGI for various income ranges: 3.2% for AGIs below $25k, 0.3% for AGIs $25k-50k)
Percentage of individuals using paid preparers for their 2012 taxes: 67.3%
Here:
67%
State:
54%
(% for various income ranges: 63.5% for AGIs below $25k, 64.2% for AGIs $25k-50k, 65.3% for AGIs $50k-75k, 68.9% for AGIs $75k-100k, 72.5% for AGIs $100k-200k, 85.4% for AGIs over 200k)
Averages for the 2004 tax year for zip code 33062, filed in 2005:
Average Adjusted Gross Income (AGI) in 2004: $86,691 (Individual Income Tax Returns)
Here:
$86,691
State:
$50,523
Salary/wage: $61,178 (reported on 63.3% of returns)
Here:
$61,178
State:
$39,563
(% of AGI for various income ranges: 53.8% for AGIs $10k-25k, 62.6% for AGIs $25k-50k, 56.3% for AGIs $50k-75k, 54.2% for AGIs $75k-100k, 36.5% for AGIs over 100k)
Taxable interest for individuals: $8,404 (reported on 61.7% of returns)
This zip code:
$8,404
Florida:
$3,211
(% of AGI for various income ranges: 8.6% for AGIs $10k-25k, 4.6% for AGIs $25k-50k, 4.9% for AGIs $50k-75k, 4.7% for AGIs $75k-100k, 5.8% for AGIs over 100k)
Taxable dividends: $8,324 (reported on 45.4% of returns)
Here:
$8,324
State:
$6,129
(% of AGI for various income ranges: 6.8% for AGIs $10k-25k, 5.0% for AGIs $25k-50k, 4.8% for AGIs $50k-75k, 4.8% for AGIs $75k-100k, 3.6% for AGIs over 100k)
Net capital gain/loss: +$30,252 (reported on 43.4% of returns)
Here:
+$30,252
State:
+$27,205
(% of AGI for various income ranges: -0.3% for AGIs $10k-25k, 1.6% for AGIs $25k-50k, 3.4% for AGIs $50k-75k, 4.2% for AGIs $75k-100k, 20.5% for AGIs over 100k)
Profit/loss from business: +$15,048 (reported on 17.6% of returns)
Here:
+$15,048
State:
+$10,634
(% of AGI for various income ranges: 8.8% for AGIs $10k-25k, 4.0% for AGIs $25k-50k, 3.4% for AGIs $50k-75k, 2.6% for AGIs $75k-100k, 2.3% for AGIs over 100k)
IRA payment deduction: $3,586 (reported on 3.9% of returns)
33062:
$3,586
Florida:
$3,082
(% of AGI for various income ranges: 0.5% for AGIs $10k-25k, 0.4% for AGIs $25k-50k, 0.2% for AGIs $50k-75k, 0.3% for AGIs $75k-100k, 0.1% for AGIs over 100k)
Self-employed pension: $16,395 (reported on 1.0% of returns)
Here:
$16,395
Florida:
$15,857
(% of AGI for various income ranges: 0.1% for AGIs $25k-50k, 0.1% for AGIs $50k-75k, 0.2% for AGIs $75k-100k, 0.2% for AGIs over 100k)
Total itemized deductions: $25,476 (19% of AGI, reported on 47.0% of returns)
Here:
$25,476
State:
$20,370
Here:
19.3% of AGI
State:
20.7% of AGI
(% of AGI for various income ranges: 24.3% for AGIs $10k-25k, 20.3% for AGIs $25k-50k, 19.1% for AGIs $50k-75k, 18.7% for AGIs $75k-100k, 10.0% for AGIs over 100k)
Charity contributions deductions: $5,220 (3% of AGI, reported on 40.9% of returns)
Here:
$5,220
State:
$4,064
Here:
3.4% of AGI
State:
3.8% of AGI
(% of AGI for various income ranges: 1.7% for AGIs $10k-25k, 1.8% for AGIs $25k-50k, 2.0% for AGIs $50k-75k, 2.1% for AGIs $75k-100k, 2.6% for AGIs over 100k)
Total tax: $18,402 (reported on 81.3% of returns)
33062:
$18,402
State:
$9,431
(% of AGI for various income ranges: 4.8% for AGIs $10k-25k, 8.3% for AGIs $25k-50k, 10.9% for AGIs $50k-75k, 11.9% for AGIs $75k-100k, 20.2% for AGIs over 100k)
Earned income credit: $1,002 (reported on 7.1% of returns)
Here:
$1,002
State:
$1,808
Percentage of individuals using paid preparers for their 2004 taxes: 70.0%
Here:
70%
State:
60%
(% for various income ranges: 68.3% for AGIs below $10k, 67.4% for AGIs $10k-25k, 65.7% for AGIs $25k-50k, 69.8% for AGIs $50k-75k, 70.6% for AGIs $75k-100k, 81.7% for AGIs over 100k)
Likely homosexual households (counted as self-reported same-sex unmarried-partner households)
Lesbian couples: 0.1% of all households
Gay men: 0.4% of all households
Household received Food Stamps/SNAP in the past 12 months: 561 Household did not receive Food Stamps/SNAP in the past 12 months: 13,826
Women who had a birth in the past 12 months: 93 (82 now married, 14 unmarried) Women who did not have a birth in the past 12 months: 3,617 (1,267 now married, 2,349 unmarried)
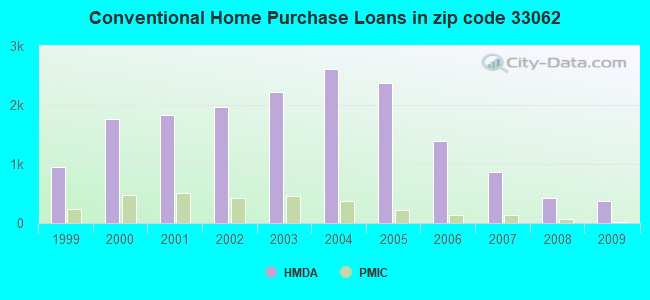
Housing units in zip code 33062 with a mortgage: 3,636 (365 second mortgage, 321 both second mortgage and home equity loan) Houses without a mortgage: 220
Median monthly owner costs for units with a mortgage: $2,714 Median monthly owner costs for units without a mortgage: $1,155
Residents with income below the poverty level in 2022:
This zip code:
9.6%
Whole state:
12.7%
Residents with income below 50% of the poverty level in 2022:
This zip code:
4.2%
Whole state:
6.6%
Median number of rooms in houses and condos:
Here:
4.5
State:
5.9
Median number of rooms in apartments:
Here:
3.5
State:
4.2
Notable locations in this zip code not listed on our city pages
Notable locations in zip code 33062: Hillsboro Inlet Light (A), Seminole Lakes Golf Course (B), Pompano Center (C), Atlantic Square (D), Oceanside Plaza (E), Pompano Square (F), Lakeside Shoppes (G), Sea View Nursing and Rehabilitation (H), Beach Branch Library (I), Broward County Sheriffs Office Department of Fire Rescue and Emergency Services Station 36 (J), Hillsboro Beach Police Department (K), Pompano Beach Fire Rescue Station 11 (L). Display/hide their locations on the map
Shopping Centers: Beach Mart Shopping Center (1), Pompano Square Mall (2), Bel-Crest Shopping Center (3), Pandanus Place Shopping Center (4). Display/hide their locations on the map
Churches in zip code 33062 include: Assumption Church (A), Saint Martin-in-the-Fields Episcopal Church (B), Saint Paul the Apostle Catholic Church (C). Display/hide their locations on the map
In group quarters: 241 (-1 institutionalized population)
Size of family households: 4,952 2-persons, 981 3-persons, 653 4-persons, 84 5-persons, 7 6-persons
Size of nonfamily households: 6,283 1-person, 1,269 2-persons, 73 3-persons
1,409 married couples with children.
682 single-parent households (286 men, 396 women).
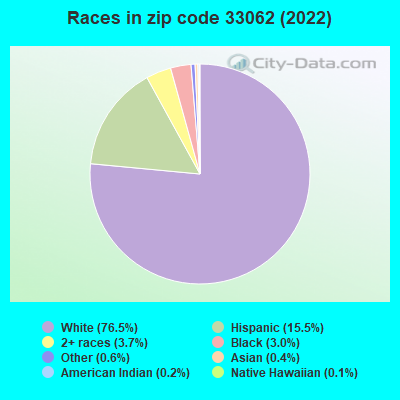
73.9% of residents of 33062 zip code speak English at home.
13.7% of residents speak Spanish at home (71% very well, 18% well, 8% not well, 2% not at all).
10.7% of residents speak other Indo-European language at home (68% very well, 20% well, 10% not well, 2% not at all).
1.3% of residents speak Asian or Pacific Island language at home (92% very well, 8% well).
0.9% of residents speak other language at home (93% very well, 7% well).
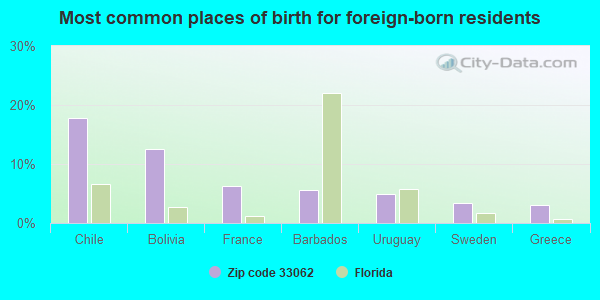
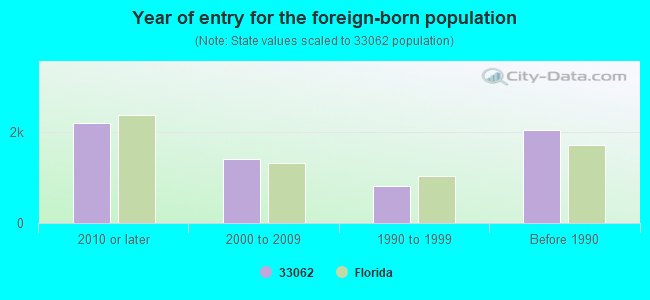
Foreign born population: 5,764 (22.6%) (61.1% of them are naturalized citizens)
Major facilities with environmental interests located in this zip code:
GRANADA HOUSE (201 NORTH OCEAN BOULEVARD in POMPANO BEACH, FL)
STATE MASTER (FDM) - WAFR-FL0002844, INDUSTRIAL WASTEWATER PROGRAM National Pollutant Discharge Elimination System NON-MAJOR (Tracking pollutant discharge elimination systems) - permit Business SIC classification: OPERATORS OF APARTMENT BUILDINGS Organizations: S.E. ENVIRONMENTAL CONSULTANTS, INC., GRANADA HOUSE ASSOCIATION, INC., BEVERLY KOERBER (CONTACT/OWNER)
, GRANADA HOUSE ASSOCIATION, INC (CONTACT/PERMIT)
Alternative names: GRANADA HOUSE ASSOCIATION,INC., GRANADA HOUSE AT POMPANO BEACH, GRANADA HOUSE POMPANO BEACH
BOAS DRY CLEANERS (2668 E ATLANTIC BLVD in POMPANO BEACH, FL)
STATE MASTER (FDM) - CHAZ-FLD981004161, HAZARDOUS WASTE REGULATION PROGRAM, CHAZ-FLD981749351, Small Quantity Generators, between 100 kg and 1000 kg of hazardous waste/month (Resource Conservation and Recovery Act (tracking hazardous waste)) - notification Small Quantity Generators, between 100 kg and 1000 kg of hazardous waste/month (Resource Conservation and Recovery Act (tracking hazardous waste)) Business SIC classification: GARMENT PRESSING, AND AGENTS FOR LAUNDRIES AND DRYCLEANERS; COIN-OPERATED LAUNDRIES AND DRYCLEANING Organizations: KWALITY PROFESSIONAL CLEANERS, BRAS CLEANERS, MARGO BERGERON, PRESIDENT (CONTACT/OWNER)
, MARILDA ALVES (CONTACT/OWNER)
Alternative names: BRAS CLEANERS, KWALITY & PROFESSIONAL DRY CLEANERS, KWALITY PROFESSIONAL CLEANERS
ARMSTRONG FORD OF POMPANO BEACH (1000 N FEDERAL HWY in POMPANO BEACH, FL)
STATE MASTER (FDM) - CHAZ-FLD982110595, HAZARDOUS WASTE REGULATION PROGRAM Small Quantity Generators, between 100 kg and 1000 kg of hazardous waste/month (Resource Conservation and Recovery Act (tracking hazardous waste)) - notification Business SIC classification: AUTOMOTIVE DEALERS Business NAICS classification: ALL OTHER MOTOR VEHICLE DEALERS. Organizations: WILLIAM ARMSTRONG (CONTACT/OWNER)
MARINEMAX POMPANO (700 SOUTH FEDERAL HIGHWAY in POMPANO BEACH, FL)
National Pollutant Discharge Elimination System NON-MAJOR (Tracking pollutant discharge elimination systems) - permit Organizations: SUSAN KINGSTON (CONTACT/OWNER)
HONSELL ENTERPRISES INC (2608 N OCEAN BLVD in POMPANO BEACH, FL)
AIR MINOR (AIRS/AFS) Small Quantity Generators, between 100 kg and 1000 kg of hazardous waste/month (Resource Conservation and Recovery Act (tracking hazardous waste)) - notification Business SIC classification: DRYCLEANING PLANTS, EXCEPT RUG CLEANING Organizations: SID WEITZ, VP (CONTACT/OWNER)
Alternative names: A1A CLEANERS INC
POMPANO BUSINESS PARK--PARCEL (2500 NE 19TH ST in POMPANO BEACH, FL)
National Pollutant Discharge Elimination System NON-MAJOR (Tracking pollutant discharge elimination systems) - permit Organizations: RICHARD ZEHL (CONTACT/OWNER)
KARIS KRISTO, INC (2667 E ATLANTIC BLVD in POMPANO BEACH, FL)
AIR MINOR (AIRS/AFS) Small Quantity Generators, between 100 kg and 1000 kg of hazardous waste/month (Resource Conservation and Recovery Act (tracking hazardous waste)) - notification Business SIC classification: DRYCLEANING PLANTS, EXCEPT RUG CLEANING Organizations: CARL CARLSON (CONTACT/OWNER)
Alternative names: 1 HOUR MARTINIZING
POMPANO PLAZA FRENCH CLEANERS (435 NORTH FEDERAL HWY in POMPANO BEACH, FL)
AIR MINOR (AIRS/AFS) Small Quantity Generators, between 100 kg and 1000 kg of hazardous waste/month (Resource Conservation and Recovery Act (tracking hazardous waste)) - notification Business SIC classification: DRYCLEANING PLANTS, EXCEPT RUG CLEANING Organizations: RALPH EREZ (CONTACT/OWNER)
Alternative names: POMPANO FRENCH CLEANERS
POMPANO DRY CLEANERS (207 S FEDERAL HWY in POMPANO BEACH, FL)
AIR MINOR (AIRS/AFS) Small Quantity Generators, between 100 kg and 1000 kg of hazardous waste/month (Resource Conservation and Recovery Act (tracking hazardous waste)) - notification Business SIC classification: DRYCLEANING PLANTS, EXCEPT RUG CLEANING Organizations: FELIX KARAVASILIS, OWNER (CONTACT/OWNER)
ARNST MOTORS (1015 S FEDERAL HWY in POMPANO BEACH, FL)
(Resource Conservation and Recovery Act (tracking hazardous waste)) Business NAICS classification: OTHER AUTOMOTIVE MECHANICAL AND ELECTRICAL REPAIR AND MAINTENANCE. Organizations: JACK ARNST, OWNER (CONTACT/OWNER)
SEARS AUTO CENTER (2251 N FEDERAL HWY in POMPANO BEACH, FL)
(Resource Conservation and Recovery Act (tracking hazardous waste)) Organizations: STEPHEN SMITH (CONTACT/OWNER)
SONATA BEACH CLUB (801 BRINY AVENUE in POMPANO BEACH, FL)
National Pollutant Discharge Elimination System NON-MAJOR (Tracking pollutant discharge elimination systems) - permit Organizations: SHAWN MALHOTRA (CONTACT/OWNER)
HARBOUR GRANDE (1341 S OCEAN BLVD in POMPANO BCH, FL)
National Pollutant Discharge Elimination System NON-MAJOR (Tracking pollutant discharge elimination systems) - permit Organizations: J OTTINO (CONTACT/OWNER)
Housing units lacking complete plumbing facilities: 0.5% Housing units lacking complete kitchen facilities: 1.4%
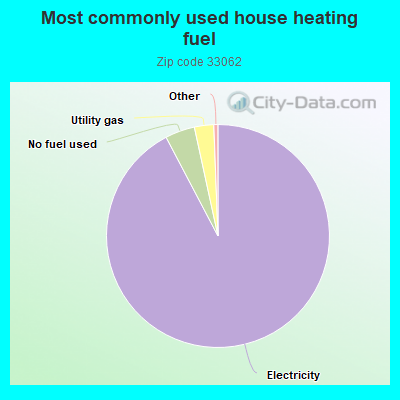
92.3%Electricity
4.3%No fuel used
2.8%Utility gas
Population in 1990: 20,836. Population change in the 1990s: +4,678 (+22.5%).
Place of birth for U.S.-born residents:
This state: 3,823
Northeast: 8,795
Midwest: 3,597
South: 2,361
West: 540
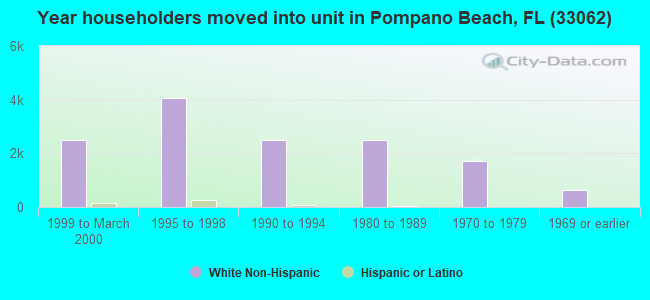
55% of the 33062 zip code residents lived in the same house 5 years ago. Out of people who lived in different houses, 56% lived in this county. Out of people who lived in different counties, 50% lived in Florida.
85% of the 33062 zip code residents lived in the same house 1 year ago. Out of people who lived in different houses, 40% moved from this county. Out of people who lived in different houses, 24% moved from different county within same state. Out of people who lived in different houses, 24% moved from different state. Out of people who lived in different houses, 12% moved from abroad.
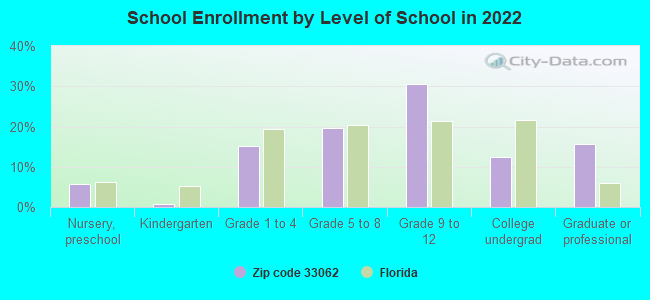
Private vs. public school enrollment:
Students in private schools in grades 1 to 8 (elementary and middle school): 282
Here:
30.5%
Florida:
15.8%
Students in private schools in grades 9 to 12 (high school): 299
Here:
37.2%
Florida:
12.9%
Students in private undergraduate colleges: 168
Here:
50.1%
Florida:
23.6%
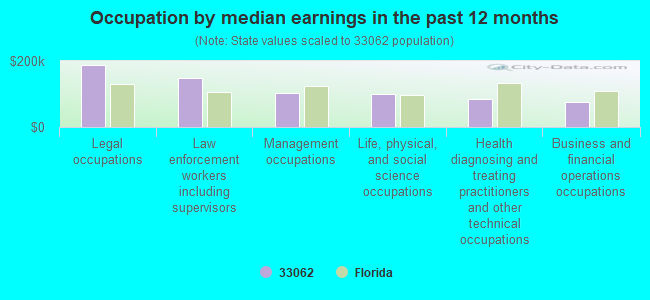
Occupation by median earnings in the past 12 months ($)
187,414Legal occupations
147,405Law enforcement workers including supervisors
103,045Management occupations
99,150Life, physical, and social science occupations
84,922Health diagnosing and treating practitioners and other technical occupations
77,240Business and financial operations occupations
Companies with federal contracts located in this zip code (POMPANO BEACH, FL):
TIDY TEAM INC (660 S FEDERAL HWY STE 203; small business) : $379,709 in 85 contractsfrom 2000 to 2006
Contracts for Custodial Janitorial Services by Army, U.S. Army Corps of Engineers - civil program financing only Signed by year:2000: $46,800; 2001: $14,870; 2002: $74,520; 2003: $143,505; 2004: $60,835; 2005: $39,629; 2006: -$450.
Biggest contracts:
$81,000 with Army for Custodial Janitorial Services. Signed on 2003-11-08. Completion date: 2003-09-30.
$8,340, same as above.Signed on 2002-11-19. Completion date: 2001-09-30.
$8,340, same as above.Signed on 2000-10-27. Completion date: 2001-09-30.
$8,340, same as above.Signed on 2004-01-20. Completion date: 2001-09-30.
OMNIUM INTERSYSTEMS LLC (1860 NE 27TH AVE; small business)
$45,000 with Air Force for Other ADP and Telecommunications Services (includes data storage on tapes, compact disks, etc.). Taking place in SD. Signed on 2005-08-30. Completion date: 2006-09-30.
GLENN STIRRAT (2701 NE 110TH ST; small business) : $26,000 in 6 contractsfrom 1999 to 2000
Contracts for Maintenance, Repair or Alteration of Real Property -- Office Buildings by Public Buildings Service Signed by year:2000: $13,000; 2001: $0; 2002: $0; 2003: $0; 2004: $0; 2005: $0; 2006: $0.
Biggest contracts:
$10,000 with Public Buildings Service for Maintenance, Repair or Alteration of Real Property -- Office Buildings. Signed on 1999-10-15. Completion date: 1999-11-15.
$5,000, same as above.Signed on 2000-06-15. Completion date: 2000-07-15.
$5,000, same as above.Signed on 2000-06-15. Completion date: 2000-07-15.
$3,000, same as above.Signed on 2000-06-15. Completion date: 2000-07-15.
OTHERLAND GROUP INC (2731 NE 14TH ST CSWY 605; small business)
$25,246 with Air Force for Miscellaneous Items. Signed on 2002-09-18. Completion date: 2002-10-16.
STATUS ENTERPRISES, INC (880 N FEDERAL HWY; small business)
$11,140 with Air Force for Household Furnishings. Signed on 2006-02-09. Completion date: 2006-03-13.
GALLAGHER, JAMES P (1200 HIBISCUS AVE; small business) : $9,984 in 8 contractsfrom 2004 to 2005
Contracts for Facilities Operations Support Services, Other Housekeeping Services by U.S. Army Corps of Engineers - civil program financing only, Army Signed by year:2000: $0; 2001: $0; 2002: $0; 2003: $0; 2004: $9,984; 2005: $0; 2006: $0.
Biggest contracts:
$5,850 with U.S. Army Corps of Engineers - civil program financing only for Facilities Operations Support Services. Taking place in MA. Signed on 2005-01-27. Completion date: 2005-10-10.
$5,850 with Army for Facilities Operations Support Services. Taking place in MA. Signed on 2005-01-27. Completion date: 2005-10-10.
$4,836 with Army for Other Housekeeping Services. Taking place in MA. Signed on 2004-03-18. Completion date: 2004-10-11.
$4,836 with U.S. Army Corps of Engineers - civil program financing only for Other Housekeeping Services. Taking place in MA. Signed on 2004-03-18. Completion date: 2004-10-11.
LPI CONSUMER PRODUCTS INC (2745 E ATL BLVD STE 300; small business)
$3,164 with Defense Logistics Agency for Personal Toiletry Articles. Signed on 2005-03-30. Completion date: 2005-03-31.
SOFTVELOCITY INC (2769 E ATLANTIC BLVD; small business)
$3,111 with Army for ADP Software. Taking place in AZ. Signed on 2003-09-22. Completion date: 2003-10-21.
LOCAL MOTION MEDIA PRODUCTIONS (3280 CYPRESS CREEK DRIVE; small business) : $212 in 2 contractsin 2003
$212 with Army for Audio/Visual Services. Signed on 2003-11-26. Completion date: 2003-07-17.
$0, same as above.Signed on 2003-11-26. Completion date: 2003-07-17.
Top industries in this zip code by the number of employees in 2005:
Other Services (except Public Administration): Other Similar Organizations (except Business, Professional, Labor, and Political Organizations) (20-49: 2, 10-19: 12, 5-9: 10, 1-4: 45)
2002 - 2018 National Fire Incident Reporting System (NFIRS) incidents
Based on the data from the years 2002 - 2018 the average number of fire incidents per year is 43. The highest number of fire incidents - 61 took place in 2007, and the least - 20 in 2015. The data has a growing trend.
When looking into fire subcategories, the most incidents belonged to: Structure Fires (50.9%), and Outside Fires (26.5%).
Fire incident types reported to NFIRS in Zip Code 33062


 Nearest zip codes: 33060, 33064, 33308, 33069, 33441, 33334.
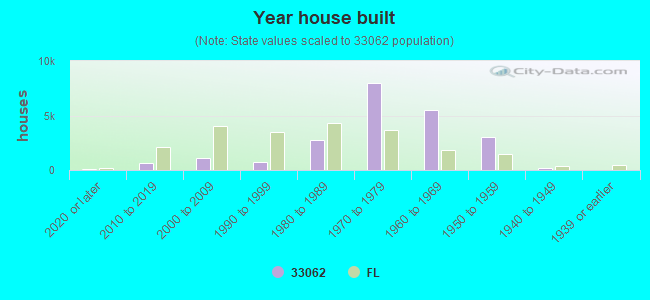


 Based on the data from the years 2002 - 2018 the average number of fire incidents per year is 43. The highest number of fire incidents - 61 took place in 2007, and the least - 20 in 2015. The data has a growing trend.
 When looking into fire subcategories, the most incidents belonged to: Structure Fires (50.9%), and Outside Fires (26.5%).