Estimated zip code population in 2022: 19,456 Zip code population in 2010: 17,724 Zip code population in 2000: 18,684
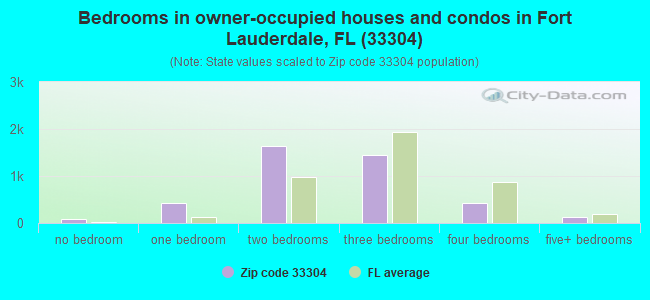
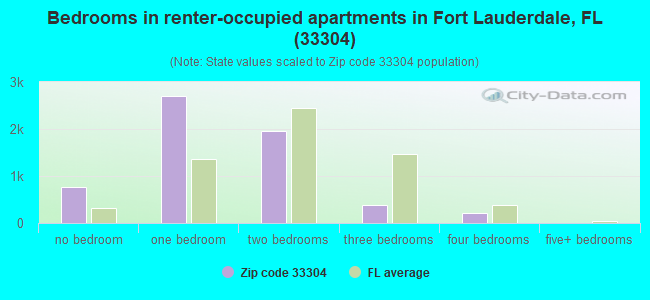
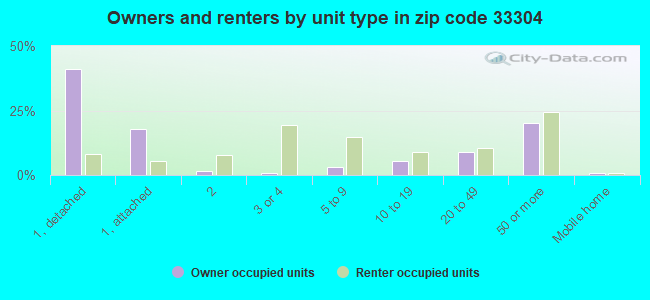
Houses and condos: 12,986 Renter-occupied apartments: 5,920
% of renters here:
59%
State:
33%
March 2022 cost of living index in zip code 33304: 111.5 (more than average, U.S. average is 100)
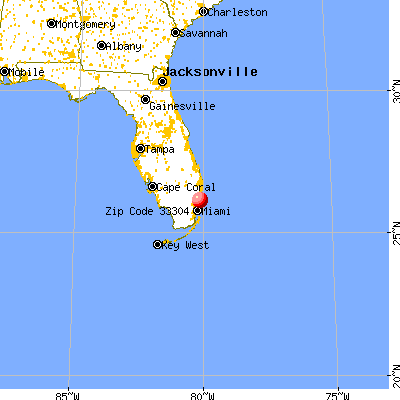
Land area: 3.2 sq. mi. Water area: 0.4 sq. mi.
Population density: 6,111 people per square mile
(high).
OSM Map
General Map
Google Map
MSN Map
OSM Map
General Map
Google Map
MSN Map
OSM Map
General Map
Google Map
MSN Map
OSM Map
General Map
Google Map
MSN Map
Please wait while loading the map...
Real estate property taxes paid for housing units in 2022:
This zip code:
0.9% ($6,164)
Florida:
0.7% ($2,529)
Median real estate property taxes paid for housing units with mortgages in 2022: $6,522 (1.0%) Median real estate property taxes paid for housing units with no mortgage in 2022: $5,387 (0.9%)
Averages for the 2020 tax year for zip code 33304, filed in 2021:
Average Adjusted Gross Income (AGI) in 2020: $151,211 (Individual Income Tax Returns)
Here:
$151,211
State:
$82,200
Salary/wage: $86,422 (reported on 76.5% of returns)
Here:
$86,422
State:
$58,347
(% of AGI for various income ranges: 1232.2% for AGIs below $25k, 3943.0% for AGIs $25k-50k, 7012.5% for AGIs $50k-75k, 10807.2% for AGIs $75k-100k, 19023.9% for AGIs $100k-200k, 112864.8% for AGIs over 200k)
Taxable interest for individuals: $7,646 (reported on 31.3% of returns)
This zip code:
$7,646
Florida:
$4,272
(% of AGI for various income ranges: 37.9% for AGIs below $25k, 36.8% for AGIs $25k-50k, 82.5% for AGIs $50k-75k, 183.6% for AGIs $75k-100k, 419.5% for AGIs $100k-200k, 6151.8% for AGIs over 200k)
Ordinary dividends: $25,432 (reported on 29.0% of returns)
Here:
$25,432
State:
$15,863
(% of AGI for various income ranges: 51.4% for AGIs below $25k, 109.5% for AGIs $25k-50k, 252.7% for AGIs $50k-75k, 482.5% for AGIs $75k-100k, 1072.9% for AGIs $100k-200k, 20061.8% for AGIs over 200k)
Net capital gain/loss in AGI: +$133,408 (reported on 30.0% of returns)
Here:
+$133,408
State:
+$62,983
(% of AGI for various income ranges: 22.6% for AGIs below $25k, 99.4% for AGIs $25k-50k, 202.1% for AGIs $50k-75k, 579.8% for AGIs $75k-100k, 1514.7% for AGIs $100k-200k, 129770.0% for AGIs over 200k)
Profit/loss from business: +$16,013 (reported on 25.0% of returns)
Here:
+$16,013
State:
+$9,719
(% of AGI for various income ranges: 216.9% for AGIs below $25k, 236.1% for AGIs $25k-50k, 418.0% for AGIs $50k-75k, 563.2% for AGIs $75k-100k, 856.9% for AGIs $100k-200k, 6646.1% for AGIs over 200k)
Taxable individual retirement arrangement distribution: $33,061 (reported on 7.3% of returns)
33304:
$33,061
Florida:
$24,823
(% of AGI for various income ranges: 42.1% for AGIs below $25k, 72.7% for AGIs $25k-50k, 206.2% for AGIs $50k-75k, 387.7% for AGIs $75k-100k, 906.9% for AGIs $100k-200k, 4236.4% for AGIs over 200k)
Self-employed (Keogh) retirement plans: $31,227 (reported on 1.0% of returns)
33304:
$31,227
Florida:
$29,694
(% of AGI for various income ranges: 8.5% for AGIs below $25k, 59.1% for AGIs $100k-200k, 846.1% for AGIs over 200k)
Total itemized deductions: $43,483 (reported on 13.5% of returns)
Here:
$43,483
State:
$45,393
(% of AGI for various income ranges: 90.6% for AGIs below $25k, 226.5% for AGIs $25k-50k, 348.9% for AGIs $50k-75k, 757.0% for AGIs $75k-100k, 1515.9% for AGIs $100k-200k, 12354.2% for AGIs over 200k)
Charity contributions: $18,400 (reported on 11.1% of returns)
Here:
$18,400
State:
$20,178
(% of AGI for various income ranges: 4.7% for AGIs below $25k, 20.5% for AGIs $25k-50k, 42.8% for AGIs $50k-75k, 89.2% for AGIs $75k-100k, 271.5% for AGIs $100k-200k, 5885.5% for AGIs over 200k)
Taxes paid: $8,235 (reported on 13.2% of returns)
33304:
$8,235
State:
$6,967
(% of AGI for various income ranges: 19.6% for AGIs below $25k, 50.4% for AGIs $25k-50k, 88.9% for AGIs $50k-75k, 194.9% for AGIs $75k-100k, 396.3% for AGIs $100k-200k, 1809.4% for AGIs over 200k)
Earned income credit: $1,754 (reported on 14.0% of returns)
Here:
$1,754
State:
$2,306
(% of AGI for various income ranges: 88.0% for AGIs below $25k, 37.5% for AGIs $25k-50k)
Percentage of individuals using paid preparers for their 2020 taxes: 91.1%
Here:
91%
State:
92%
(% for various income ranges: 88.8% for AGIs below $25k, 91.8% for AGIs $25k-50k, 89.4% for AGIs $50k-75k, 92.3% for AGIs $75k-100k, 93.4% for AGIs $100k-200k, 93.9% for AGIs over 200k)
Averages for the 2012 tax year for zip code 33304, filed in 2013:
Average Adjusted Gross Income (AGI) in 2012: $93,602 (Individual Income Tax Returns)
Here:
$93,602
State:
$60,316
Salary/wage: $56,289 (reported on 79.3% of returns)
Here:
$56,289
State:
$45,277
(% of AGI for various income ranges: 78.0% for AGIs below $25k, 82.6% for AGIs $25k-50k, 78.4% for AGIs $50k-75k, 73.9% for AGIs $75k-100k, 67.5% for AGIs $100k-200k, 28.3% for AGIs over 200k)
Taxable interest for individuals: $5,071 (reported on 28.4% of returns)
This zip code:
$5,071
Florida:
$3,587
(% of AGI for various income ranges: 1.4% for AGIs below $25k, 1.1% for AGIs $25k-50k, 1.2% for AGIs $50k-75k, 2.0% for AGIs $75k-100k, 1.6% for AGIs $100k-200k, 1.6% for AGIs over 200k)
Ordinary dividends: $13,268 (reported on 22.2% of returns)
Here:
$13,268
State:
$12,831
(% of AGI for various income ranges: 3.6% for AGIs below $25k, 2.5% for AGIs $25k-50k, 2.9% for AGIs $50k-75k, 3.3% for AGIs $75k-100k, 4.1% for AGIs $100k-200k, 3.0% for AGIs over 200k)
Net capital gain/loss in AGI: +$52,046 (reported on 20.9% of returns)
Here:
+$52,046
State:
+$33,493
(% of AGI for various income ranges: 0.7% for AGIs $25k-50k, 0.4% for AGIs $50k-75k, 0.9% for AGIs $75k-100k, 3.1% for AGIs $100k-200k, 18.9% for AGIs over 200k)
Profit/loss from business: +$18,071 (reported on 18.5% of returns)
Here:
+$18,071
State:
+$10,012
(% of AGI for various income ranges: 8.8% for AGIs below $25k, 3.1% for AGIs $25k-50k, 2.9% for AGIs $50k-75k, 3.3% for AGIs $75k-100k, 3.3% for AGIs $100k-200k, 3.3% for AGIs over 200k)
Taxable individual retirement arrangement distribution: $26,695 (reported on 7.9% of returns)
33304:
$26,695
Florida:
$21,544
(% of AGI for various income ranges: 2.1% for AGIs below $25k, 2.2% for AGIs $25k-50k, 2.3% for AGIs $50k-75k, 3.5% for AGIs $75k-100k, 4.6% for AGIs $100k-200k, 1.6% for AGIs over 200k)
Self-employment retirement plans: $28,657 (reported on 0.7% of returns)
33304:
$28,657
Florida:
$20,611
Total itemized deductions: $26,635 (11% of AGI, reported on 28.0% of returns)
Here:
$26,635
State:
$25,533
Here:
10.9% of AGI
State:
18.0% of AGI
(% of AGI for various income ranges: 10.5% for AGIs below $25k, 11.0% for AGIs $25k-50k, 11.5% for AGIs $50k-75k, 12.2% for AGIs $75k-100k, 13.5% for AGIs $100k-200k, 5.1% for AGIs over 200k)
Charity contributions: $4,231 (reported on 22.6% of returns)
Here:
$4,231
State:
$5,698
(% of AGI for various income ranges: 0.7% for AGIs below $25k, 1.1% for AGIs $25k-50k, 1.2% for AGIs $50k-75k, 1.1% for AGIs $75k-100k, 1.5% for AGIs $100k-200k, 0.9% for AGIs over 200k)
Taxes paid: $8,866 (reported on 27.1% of returns)
33304:
$8,866
State:
$6,203
(% of AGI for various income ranges: 2.3% for AGIs below $25k, 2.1% for AGIs $25k-50k, 2.5% for AGIs $50k-75k, 3.1% for AGIs $75k-100k, 4.0% for AGIs $100k-200k, 2.3% for AGIs over 200k)
Earned income credit: $1,830 (reported on 18.8% of returns)
Here:
$1,830
State:
$2,372
(% of AGI for various income ranges: 5.5% for AGIs below $25k, 0.4% for AGIs $25k-50k)
Percentage of individuals using paid preparers for their 2012 taxes: 62.7%
Here:
63%
State:
54%
(% for various income ranges: 63.7% for AGIs below $25k, 54.9% for AGIs $25k-50k, 57.1% for AGIs $50k-75k, 63.5% for AGIs $75k-100k, 68.4% for AGIs $100k-200k, 85.9% for AGIs over 200k)
Averages for the 2004 tax year for zip code 33304, filed in 2005:
Average Adjusted Gross Income (AGI) in 2004: $61,528 (Individual Income Tax Returns)
Here:
$61,528
State:
$50,523
Salary/wage: $43,363 (reported on 79.6% of returns)
Here:
$43,363
State:
$39,563
(% of AGI for various income ranges: 81.8% for AGIs $10k-25k, 83.9% for AGIs $25k-50k, 71.1% for AGIs $50k-75k, 68.9% for AGIs $75k-100k, 40.2% for AGIs over 100k)
Taxable interest for individuals: $5,375 (reported on 37.9% of returns)
This zip code:
$5,375
Florida:
$3,211
(% of AGI for various income ranges: 2.6% for AGIs $10k-25k, 2.0% for AGIs $25k-50k, 3.0% for AGIs $50k-75k, 2.9% for AGIs $75k-100k, 3.5% for AGIs over 100k)
Taxable dividends: $8,034 (reported on 25.5% of returns)
Here:
$8,034
State:
$6,129
(% of AGI for various income ranges: 2.5% for AGIs $10k-25k, 1.9% for AGIs $25k-50k, 3.3% for AGIs $50k-75k, 3.5% for AGIs $75k-100k, 3.5% for AGIs over 100k)
Net capital gain/loss: +$41,655 (reported on 24.4% of returns)
Here:
+$41,655
State:
+$27,205
(% of AGI for various income ranges: 0.3% for AGIs $10k-25k, 0.9% for AGIs $25k-50k, 3.8% for AGIs $50k-75k, 3.4% for AGIs $75k-100k, 25.4% for AGIs over 100k)
Profit/loss from business: +$12,472 (reported on 15.9% of returns)
Here:
+$12,472
State:
+$10,634
(% of AGI for various income ranges: 6.6% for AGIs $10k-25k, 2.5% for AGIs $25k-50k, 3.9% for AGIs $50k-75k, 3.8% for AGIs $75k-100k, 2.8% for AGIs over 100k)
IRA payment deduction: $3,065 (reported on 3.0% of returns)
33304:
$3,065
Florida:
$3,082
(% of AGI for various income ranges: 0.2% for AGIs $10k-25k, 0.2% for AGIs $25k-50k, 0.3% for AGIs $50k-75k, 0.1% for AGIs $75k-100k, 0.1% for AGIs over 100k)
Self-employed pension: $16,607 (reported on 0.7% of returns)
Here:
$16,607
Florida:
$15,857
Total itemized deductions: $23,879 (19% of AGI, reported on 32.6% of returns)
Here:
$23,879
State:
$20,370
Here:
18.9% of AGI
State:
20.7% of AGI
(% of AGI for various income ranges: 14.8% for AGIs $10k-25k, 14.0% for AGIs $25k-50k, 17.9% for AGIs $50k-75k, 18.5% for AGIs $75k-100k, 10.0% for AGIs over 100k)
Charity contributions deductions: $4,265 (3% of AGI, reported on 27.6% of returns)
Here:
$4,265
State:
$4,064
Here:
3.1% of AGI
State:
3.8% of AGI
(% of AGI for various income ranges: 1.2% for AGIs $10k-25k, 1.4% for AGIs $25k-50k, 1.8% for AGIs $50k-75k, 2.0% for AGIs $75k-100k, 2.1% for AGIs over 100k)
Total tax: $14,345 (reported on 74.8% of returns)
33304:
$14,345
State:
$9,431
(% of AGI for various income ranges: 4.5% for AGIs $10k-25k, 8.4% for AGIs $25k-50k, 12.0% for AGIs $50k-75k, 13.6% for AGIs $75k-100k, 22.1% for AGIs over 100k)
Earned income credit: $1,523 (reported on 17.8% of returns)
Here:
$1,523
State:
$1,808
Percentage of individuals using paid preparers for their 2004 taxes: 62.6%
Here:
63%
State:
60%
(% for various income ranges: 60.9% for AGIs below $10k, 61.0% for AGIs $10k-25k, 56.0% for AGIs $25k-50k, 63.6% for AGIs $50k-75k, 69.4% for AGIs $75k-100k, 81.5% for AGIs over 100k)
Likely homosexual households (counted as self-reported same-sex unmarried-partner households)
Lesbian couples: 0.3% of all households
Gay men: 1.9% of all households
Household received Food Stamps/SNAP in the past 12 months: 986 Household did not receive Food Stamps/SNAP in the past 12 months: 9,137
Women who had a birth in the past 12 months: 113 (119 now married, 0 unmarried) Women who did not have a birth in the past 12 months: 4,255 (1,847 now married, 2,408 unmarried)
Housing units in zip code 33304 with a mortgage: 2,324 (302 second mortgage, 6 home equity loan, 279 both second mortgage and home equity loan) Houses without a mortgage: 73
Median monthly owner costs for units with a mortgage: $3,229 Median monthly owner costs for units without a mortgage: $1,243
Residents with income below the poverty level in 2022:
This zip code:
11.8%
Whole state:
12.7%
Residents with income below 50% of the poverty level in 2022:
This zip code:
6.7%
Whole state:
6.6%
Median number of rooms in houses and condos:
Here:
5.0
State:
5.9
Median number of rooms in apartments:
Here:
3.3
State:
4.2
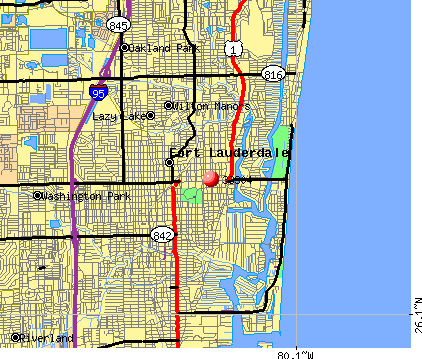
Notable locations in this zip code not listed on our city pages
Notable locations in zip code 33304: Sunrise Bay Center (A), Las Olas Plaza (B), Fort Lauderdale Branch Library (C), Fire Station Number 13 (D), Fort Lauderdale Fire Rescue Station 13 (E), War Memorial Auditorium (F), Sun Dream Harbor Center (G). Display/hide their locations on the map
Churches in zip code 33304 include: Our Lady of Assumption Catholic Church (A), Saint Demetrios Greek Orthodox Church (B), New Covenant Church (C), Pompano Beach Nazarene Church (D), Alpha and Omega (E), First Church of Christ Scientist (F), Saint Gabriel Catholic Church (G), Islamic Center (H), Jehovah Witness Kingdom Hall (I). Display/hide their locations on the map
Parks in zip code 33304 include: Hugh Taylor Birch State Park (1), Holiday Park (2), English Park (3), Warfield Park (4). Display/hide their locations on the map
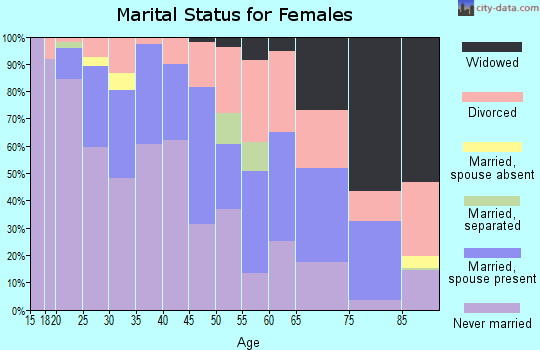
1,517 married couples with children.
461 single-parent households (143 men, 318 women).
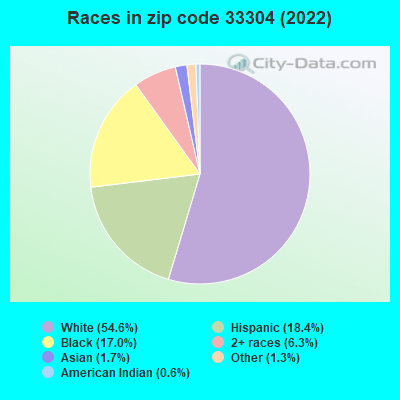
59.5% of residents of 33304 zip code speak English at home.
19.7% of residents speak Spanish at home (66% very well, 16% well, 12% not well, 5% not at all).
17.4% of residents speak other Indo-European language at home (65% very well, 19% well, 15% not well, 1% not at all).
2.4% of residents speak Asian or Pacific Island language at home (63% very well, 34% well, 4% not at all).
1.1% of residents speak other language at home (100% very well).
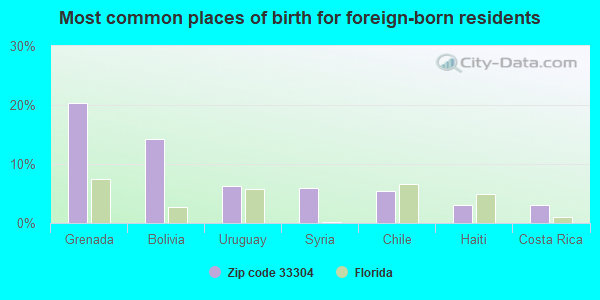
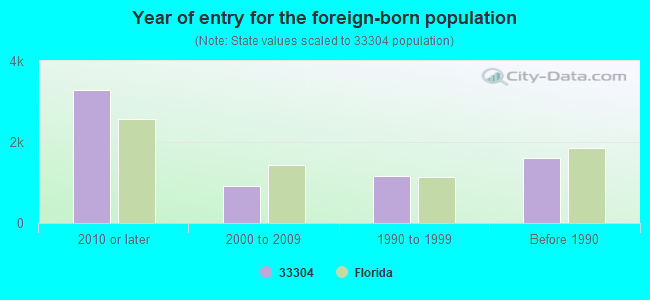
Foreign born population: 5,957 (30.6%) (55.8% of them are naturalized citizens)
Major facilities with environmental interests located in this zip code:
NORTH SIDE ELEMENTARY SCHOOL (120 NE 11TH ST in FORT LAUDERDALE, FL)
(National Center for Education Statistics) - STATE ID-0041 Organizations: BROWARD COUNTY SCHOOL DISTRICT (SCHOOL DISTRICT)
HOLMAN BENTLEY (12 EAST SUNRISE BLVD in FT LAUDERDALE, FL)
National Pollutant Discharge Elimination System NON-MAJOR (Tracking pollutant discharge elimination systems) - permit Organizations: BOB BAMONTE (CONTACT/OWNER)
HOLMAN HONDA (12 EAST SUNRISE BLVD in FT LAUDERDALE, FL)
National Pollutant Discharge Elimination System NON-MAJOR (Tracking pollutant discharge elimination systems) - permit Organizations: BOB BAMONTE (CONTACT/OWNER)
Alternative names: MATERIAL SERVICE-YARD 46
RITEWAY LEATHER REFINISHERS INC (725 PROGRESSO DRIVE in FORT LAUDERDALE, FL)
AIR MINOR (AIRS/AFS) Small Quantity Generators, between 100 kg and 1000 kg of hazardous waste/month (Resource Conservation and Recovery Act (tracking hazardous waste)) - notification Business SIC classification: DRYCLEANING PLANTS, EXCEPT RUG CLEANING Organizations: EUGENE F VANEK, PRESIDENT (CONTACT/OWNER)
COMMERCIAL X RAY SERVICES (712 NE 1ST AVE in FORT LAUDERDALE, FL)
(Resource Conservation and Recovery Act (tracking hazardous waste)) Organizations: EDWARD BARTRA, PRES (CONTACT/OWNER)
ALPINE JAGUAR (1650 E SUNRISE BLVD in FORT LAUDERDALE, FL)
(Resource Conservation and Recovery Act (tracking hazardous waste)) Organizations: TERRY SPRINGER, SER DIR (CONTACT/OWNER)
MURRAY VAN & STORAGE INC (900 NW 1ST AVENUE in BOCA RATON, FL)
(Resource Conservation and Recovery Act (tracking hazardous waste)) Organizations: DEAN SALTER, GEN MANAGER (CONTACT/OWNER)
HOME DEPOT FORT LAUDERDALE (NORTHEAST CORNER SUNRISE BLVD. in FORT LAUDERDALE, FL)
National Pollutant Discharge Elimination System NON-MAJOR (Tracking pollutant discharge elimination systems) - permit Organizations: ROBERT BAKER (CONTACT/OWNER)
JAY P WEISS (900 NE 2ND AVE in FORT LAUDERDALE, FL)
(Resource Conservation and Recovery Act (tracking hazardous waste)) Organizations: JAY WEISS, PRES (CONTACT/OWNER)
JIFFY LUBE STORE #229 (400 NE 13TH ST in FORT LAUDERDALE, FL)
(Resource Conservation and Recovery Act (tracking hazardous waste)) Organizations: JOSE GONZALEZ, REGIONAL MGR (CONTACT/OWNER)
LAS BRISAS AT SUNRISE (SW CORNER OF SR-84 & I-75 in SUNRISE, FL)
National Pollutant Discharge Elimination System NON-MAJOR (Tracking pollutant discharge elimination systems) - permit Organizations: REY MELENDI (CONTACT/OWNER)
OFFICE DEPOT - BANK FACILITY (N FEDERAL HWY & NE 38TH ST in OAKLAND PARK, FL)
National Pollutant Discharge Elimination System NON-MAJOR (Tracking pollutant discharge elimination systems) - permit Organizations: BARNEY LOMBARDI (CONTACT/OWNER)
PUBLIX - EAST SUNRISE BOULEVAR (NW CORNER OF SUNRISE BOULEVARD in FORT LAUDERDALE, FL)
National Pollutant Discharge Elimination System NON-MAJOR (Tracking pollutant discharge elimination systems) - permit Organizations: CHRISTINA KURTZ (CONTACT/OWNER)
Housing units lacking complete plumbing facilities: 0.9% Housing units lacking complete kitchen facilities: 1.4%
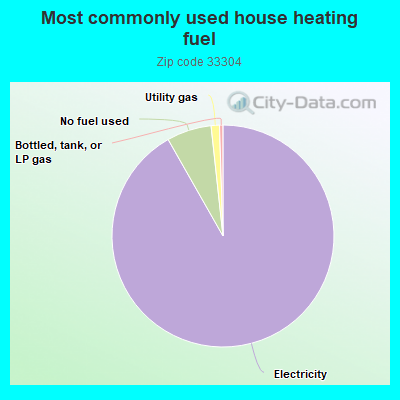
91.5%Electricity
6.5%No fuel used
1.2%Utility gas
0.5%Bottled, tank, or LP gas
Population in 1990: 18,976.
Place of birth for U.S.-born residents:
This state: 5,046
Northeast: 3,632
Midwest: 1,979
South: 1,547
West: 540
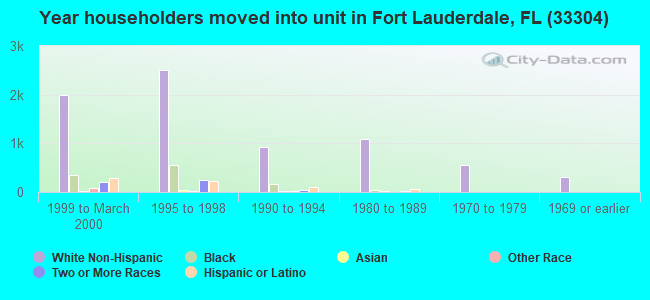
45% of the 33304 zip code residents lived in the same house 5 years ago. Out of people who lived in different houses, 58% lived in this county. Out of people who lived in different counties, 50% lived in Florida.
86% of the 33304 zip code residents lived in the same house 1 year ago. Out of people who lived in different houses, 59% moved from this county. Out of people who lived in different houses, 8% moved from different county within same state. Out of people who lived in different houses, 19% moved from different state. Out of people who lived in different houses, 10% moved from abroad.
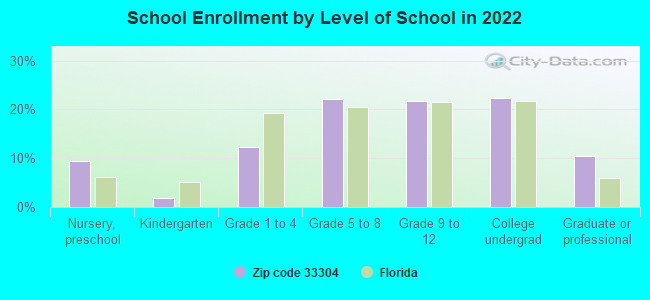
Private vs. public school enrollment:
Students in private schools in grades 1 to 8 (elementary and middle school): 284
Here:
29.3%
Florida:
15.8%
Students in private schools in grades 9 to 12 (high school): 136
Here:
22.5%
Florida:
12.9%
Students in private undergraduate colleges: 190
Here:
30.5%
Florida:
23.6%
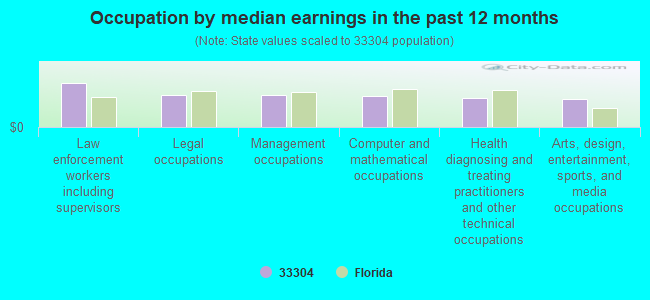
Occupation by median earnings in the past 12 months ($)
163,244Law enforcement workers including supervisors
119,601Legal occupations
118,821Management occupations
115,104Computer and mathematical occupations
108,354Health diagnosing and treating practitioners and other technical occupations
104,636Arts, design, entertainment, sports, and media occupations
Companies with federal contracts located in this zip code (FORT LAUDERDAL, FL):
TOZZER, OAKVIK & ASSOCIATES, I (2455 E SUNRISE BLVD , SUI; small business) : $105,156 in 17 contractsfrom 2001 to 2005
Contracts for Real Property Appraisals Services (SIC 6531) by U.S. Army Corps of Engineers - civil program financing only, Army Signed by year:2000: $0; 2001: $1,225,943; 2002: $10,000; 2003: -$1,560,949; 2004: $148,904; 2005: $281,258; 2006: $0.
Biggest contracts:
$970,844 with U.S. Army Corps of Engineers - civil program financing only for Real Property Appraisals Services (SIC 6531). Signed on 2001-07-11. Completion date: 2001-09-30.
$251,099, same as above.Signed on 2001-12-21. Completion date: 2002-11-20.
$109,325, same as above.Signed on 2003-04-29. Completion date: 2003-06-05.
$99,729 with Army for Real Property Appraisals Services (SIC 6531). Signed on 2005-01-12. Completion date: 2005-12-30.
BOBBIE WEINER (1229 NE 9TH AVE; small business) : $58,809 in 7 contractsfrom 2005 to 2006
Contracts for Pest Control Agents and Disinfectants, Miscellaneous Chemical Specialties by Defense Logistics Agency Signed by year:2000: $0; 2001: $0; 2002: $0; 2003: $0; 2004: $0; 2005: $42,856; 2006: $15,953.
Biggest contracts:
$35,805 with Defense Logistics Agency for Pest Control Agents and Disinfectants. Signed on 2005-03-14. Completion date: 2005-05-16.
$8,184 with Defense Logistics Agency for Miscellaneous Chemical Specialties. Signed on 2006-04-13. Completion date: 2006-06-15.
$3,982, same as above.Signed on 2006-03-03. Completion date: 2006-04-03.
$3,982, same as above.Signed on 2005-04-05. Completion date: 2005-05-08.
DARREL E DUNN (1437 NE 16TH AVENUE; small business)
$30,000 with Army for Architect - Engineer Services (including landscaping, interior layout, and designing). Taking place in OK. Signed on 2001-01-02. Completion date: 2001-09-30.
PROTECTIVE BARRIER SERVICES IN (623 NE 5TH TER; small business) : $24,472 in 2 contractsin 2005
$16,595 with Army for Miscellaneous Construction Materials. Taking place in LA. Signed on 2005-03-15. Completion date: 2005-03-24.
$7,877, same as above.Signed on 2005-06-03. Completion date: 2005-03-24.
Top industries in this zip code by the number of employees in 2005:
2002 - 2018 National Fire Incident Reporting System (NFIRS) incidents
Based on the data from the years 2002 - 2018 the average number of fires per year is 34. The highest number of fire incidents - 65 took place in 2012, and the least - 0 in 2003. The data has an increasing trend.
When looking into fire subcategories, the most incidents belonged to: Structure Fires (43.6%), and Outside Fires (37.6%).
Fire incident types reported to NFIRS in Zip Code 33304


 Nearest zip codes: 33305, 33301, 33306, 33316, 33334, 33308.


 Based on the data from the years 2002 - 2018 the average number of fires per year is 34. The highest number of fire incidents - 65 took place in 2012, and the least - 0 in 2003. The data has an increasing trend.
 When looking into fire subcategories, the most incidents belonged to: Structure Fires (43.6%), and Outside Fires (37.6%).