Estimated zip code population in 2022: 12,989 Zip code population in 2010: 11,927 Zip code population in 2000: 12,014
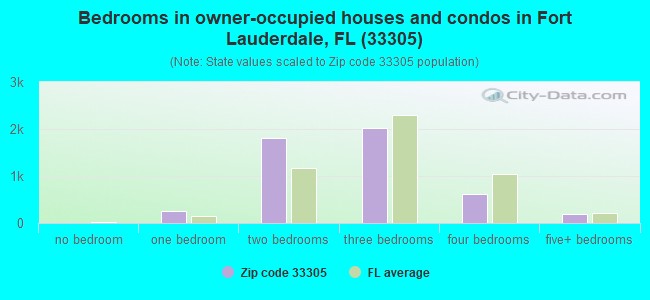
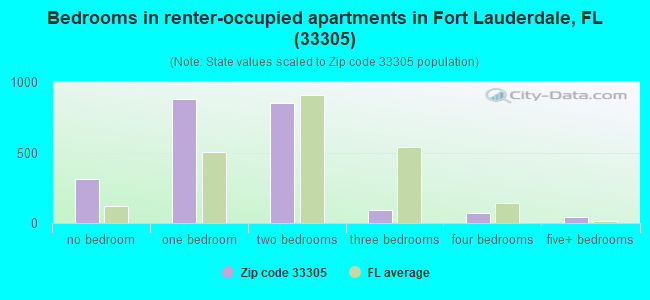
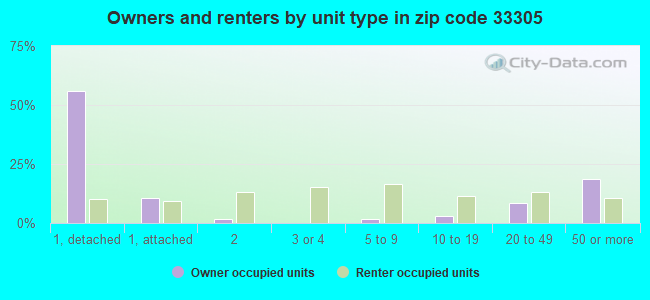
Houses and condos: 8,352 Renter-occupied apartments: 2,198
% of renters here:
31%
State:
33%
March 2022 cost of living index in zip code 33305: 110.3 (more than average, U.S. average is 100)
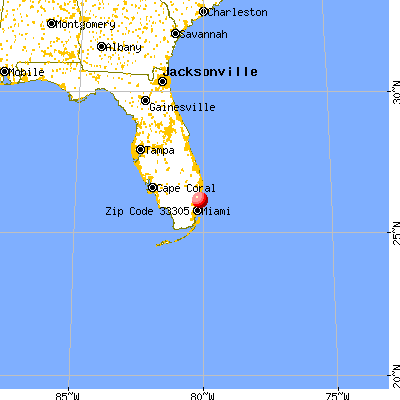
Land area: 2.2 sq. mi. Water area: 0.4 sq. mi.
Population density: 5,901 people per square mile
(average).
OSM Map
General Map
Google Map
MSN Map
OSM Map
General Map
Google Map
MSN Map
OSM Map
General Map
Google Map
MSN Map
OSM Map
General Map
Google Map
MSN Map
Please wait while loading the map...
Real estate property taxes paid for housing units in 2022:
This zip code:
0.8% ($4,910)
Florida:
0.7% ($2,529)
Median real estate property taxes paid for housing units with mortgages in 2022: $4,958 (0.8%) Median real estate property taxes paid for housing units with no mortgage in 2022: $4,842 (0.9%)
Averages for the 2020 tax year for zip code 33305, filed in 2021:
Average Adjusted Gross Income (AGI) in 2020: $238,160 (Individual Income Tax Returns)
Here:
$238,160
State:
$82,200
Salary/wage: $118,563 (reported on 72.4% of returns)
Here:
$118,563
State:
$58,347
(% of AGI for various income ranges: 1208.1% for AGIs below $25k, 3778.6% for AGIs $25k-50k, 6434.6% for AGIs $50k-75k, 10611.8% for AGIs $75k-100k, 19102.2% for AGIs $100k-200k, 129710.7% for AGIs over 200k)
Taxable interest for individuals: $9,849 (reported on 42.6% of returns)
This zip code:
$9,849
Florida:
$4,272
(% of AGI for various income ranges: 55.1% for AGIs below $25k, 58.5% for AGIs $25k-50k, 158.2% for AGIs $50k-75k, 198.2% for AGIs $75k-100k, 502.9% for AGIs $100k-200k, 8242.9% for AGIs over 200k)
Ordinary dividends: $39,664 (reported on 37.2% of returns)
Here:
$39,664
State:
$15,863
(% of AGI for various income ranges: 102.7% for AGIs below $25k, 125.6% for AGIs $25k-50k, 376.2% for AGIs $50k-75k, 546.8% for AGIs $75k-100k, 1349.4% for AGIs $100k-200k, 30936.1% for AGIs over 200k)
Net capital gain/loss in AGI: +$204,369 (reported on 36.8% of returns)
Here:
+$204,369
State:
+$62,983
(% of AGI for various income ranges: 72.6% for AGIs below $25k, 84.0% for AGIs $25k-50k, 263.4% for AGIs $50k-75k, 530.9% for AGIs $75k-100k, 1951.6% for AGIs $100k-200k, 175846.4% for AGIs over 200k)
Profit/loss from business: +$20,661 (reported on 22.3% of returns)
Here:
+$20,661
State:
+$9,719
(% of AGI for various income ranges: 286.9% for AGIs below $25k, 241.9% for AGIs $25k-50k, 364.3% for AGIs $50k-75k, 430.9% for AGIs $75k-100k, 635.1% for AGIs $100k-200k, 6829.6% for AGIs over 200k)
Taxable individual retirement arrangement distribution: $27,049 (reported on 11.0% of returns)
33305:
$27,049
Florida:
$24,823
(% of AGI for various income ranges: 77.7% for AGIs below $25k, 171.8% for AGIs $25k-50k, 229.7% for AGIs $50k-75k, 526.2% for AGIs $75k-100k, 1424.1% for AGIs $100k-200k, 2681.4% for AGIs over 200k)
Self-employed (Keogh) retirement plans: $31,588 (reported on 1.2% of returns)
33305:
$31,588
Florida:
$29,694
(% of AGI for various income ranges: 902.5% for AGIs over 200k)
Total itemized deductions: $46,667 (reported on 19.1% of returns)
Here:
$46,667
State:
$45,393
(% of AGI for various income ranges: 166.0% for AGIs below $25k, 242.0% for AGIs $25k-50k, 577.2% for AGIs $50k-75k, 975.9% for AGIs $75k-100k, 1870.4% for AGIs $100k-200k, 14405.4% for AGIs over 200k)
Charity contributions: $19,733 (reported on 15.6% of returns)
Here:
$19,733
State:
$20,178
(% of AGI for various income ranges: 10.9% for AGIs below $25k, 18.6% for AGIs $25k-50k, 75.6% for AGIs $50k-75k, 106.2% for AGIs $75k-100k, 319.0% for AGIs $100k-200k, 6448.9% for AGIs over 200k)
Taxes paid: $7,973 (reported on 19.0% of returns)
33305:
$7,973
State:
$6,967
(% of AGI for various income ranges: 38.8% for AGIs below $25k, 48.7% for AGIs $25k-50k, 131.0% for AGIs $50k-75k, 242.9% for AGIs $75k-100k, 487.1% for AGIs $100k-200k, 1915.0% for AGIs over 200k)
Earned income credit: $1,241 (reported on 8.6% of returns)
Here:
$1,241
State:
$2,306
(% of AGI for various income ranges: 52.4% for AGIs below $25k, 21.5% for AGIs $25k-50k)
Percentage of individuals using paid preparers for their 2020 taxes: 91.4%
Here:
91%
State:
92%
(% for various income ranges: 87.7% for AGIs below $25k, 91.7% for AGIs $25k-50k, 92.6% for AGIs $50k-75k, 93.4% for AGIs $75k-100k, 91.6% for AGIs $100k-200k, 94.4% for AGIs over 200k)
Averages for the 2012 tax year for zip code 33305, filed in 2013:
Average Adjusted Gross Income (AGI) in 2012: $106,131 (Individual Income Tax Returns)
Here:
$106,131
State:
$60,316
Salary/wage: $71,814 (reported on 77.9% of returns)
Here:
$71,814
State:
$45,277
(% of AGI for various income ranges: 69.9% for AGIs below $25k, 79.4% for AGIs $25k-50k, 73.5% for AGIs $50k-75k, 70.3% for AGIs $75k-100k, 71.9% for AGIs $100k-200k, 37.4% for AGIs over 200k)
Taxable interest for individuals: $3,998 (reported on 38.6% of returns)
This zip code:
$3,998
Florida:
$3,587
(% of AGI for various income ranges: 2.0% for AGIs below $25k, 1.0% for AGIs $25k-50k, 1.4% for AGIs $50k-75k, 1.5% for AGIs $75k-100k, 1.1% for AGIs $100k-200k, 1.6% for AGIs over 200k)
Ordinary dividends: $15,432 (reported on 30.1% of returns)
Here:
$15,432
State:
$12,831
(% of AGI for various income ranges: 5.0% for AGIs below $25k, 3.0% for AGIs $25k-50k, 3.2% for AGIs $50k-75k, 2.8% for AGIs $75k-100k, 2.8% for AGIs $100k-200k, 5.3% for AGIs over 200k)
Net capital gain/loss in AGI: +$52,908 (reported on 26.7% of returns)
Here:
+$52,908
State:
+$33,493
(% of AGI for various income ranges: 0.5% for AGIs $25k-50k, 1.0% for AGIs $50k-75k, 1.9% for AGIs $75k-100k, 2.9% for AGIs $100k-200k, 22.0% for AGIs over 200k)
Profit/loss from business: +$16,829 (reported on 18.5% of returns)
Here:
+$16,829
State:
+$10,012
(% of AGI for various income ranges: 10.6% for AGIs below $25k, 4.7% for AGIs $25k-50k, 3.1% for AGIs $50k-75k, 4.2% for AGIs $75k-100k, 3.0% for AGIs $100k-200k, 2.0% for AGIs over 200k)
Taxable individual retirement arrangement distribution: $26,039 (reported on 10.0% of returns)
33305:
$26,039
Florida:
$21,544
(% of AGI for various income ranges: 3.9% for AGIs below $25k, 2.0% for AGIs $25k-50k, 3.0% for AGIs $50k-75k, 4.5% for AGIs $75k-100k, 3.2% for AGIs $100k-200k, 1.9% for AGIs over 200k)
Self-employment retirement plans: $21,750 (reported on 0.9% of returns)
33305:
$21,750
Florida:
$20,611
Total itemized deductions: $29,691 (14% of AGI, reported on 39.5% of returns)
Here:
$29,691
State:
$25,533
Here:
14.4% of AGI
State:
18.0% of AGI
(% of AGI for various income ranges: 18.1% for AGIs below $25k, 13.1% for AGIs $25k-50k, 14.5% for AGIs $50k-75k, 14.1% for AGIs $75k-100k, 14.0% for AGIs $100k-200k, 8.6% for AGIs over 200k)
Charity contributions: $4,722 (reported on 32.2% of returns)
Here:
$4,722
State:
$5,698
(% of AGI for various income ranges: 0.9% for AGIs below $25k, 1.2% for AGIs $25k-50k, 1.3% for AGIs $50k-75k, 1.2% for AGIs $75k-100k, 1.5% for AGIs $100k-200k, 1.5% for AGIs over 200k)
Taxes paid: $9,481 (reported on 38.2% of returns)
33305:
$9,481
State:
$6,203
(% of AGI for various income ranges: 3.7% for AGIs below $25k, 2.8% for AGIs $25k-50k, 3.1% for AGIs $50k-75k, 3.7% for AGIs $75k-100k, 4.0% for AGIs $100k-200k, 3.3% for AGIs over 200k)
Earned income credit: $1,308 (reported on 11.5% of returns)
Here:
$1,308
State:
$2,372
(% of AGI for various income ranges: 3.1% for AGIs below $25k, 0.2% for AGIs $25k-50k)
Percentage of individuals using paid preparers for their 2012 taxes: 59.2%
Here:
59%
State:
54%
(% for various income ranges: 55.6% for AGIs below $25k, 52.9% for AGIs $25k-50k, 55.3% for AGIs $50k-75k, 64.2% for AGIs $75k-100k, 67.9% for AGIs $100k-200k, 81.5% for AGIs over 200k)
Averages for the 2004 tax year for zip code 33305, filed in 2005:
Average Adjusted Gross Income (AGI) in 2004: $71,287 (Individual Income Tax Returns)
Here:
$71,287
State:
$50,523
Salary/wage: $53,736 (reported on 78.2% of returns)
Here:
$53,736
State:
$39,563
(% of AGI for various income ranges: 72.4% for AGIs $10k-25k, 81.1% for AGIs $25k-50k, 75.1% for AGIs $50k-75k, 74.3% for AGIs $75k-100k, 46.1% for AGIs over 100k)
Taxable interest for individuals: $4,819 (reported on 49.2% of returns)
This zip code:
$4,819
Florida:
$3,211
(% of AGI for various income ranges: 4.1% for AGIs $10k-25k, 2.2% for AGIs $25k-50k, 2.6% for AGIs $50k-75k, 3.1% for AGIs $75k-100k, 3.4% for AGIs over 100k)
Taxable dividends: $5,579 (reported on 33.8% of returns)
Here:
$5,579
State:
$6,129
(% of AGI for various income ranges: 3.2% for AGIs $10k-25k, 2.0% for AGIs $25k-50k, 2.7% for AGIs $50k-75k, 1.9% for AGIs $75k-100k, 2.6% for AGIs over 100k)
Net capital gain/loss: +$30,860 (reported on 31.3% of returns)
Here:
+$30,860
State:
+$27,205
(% of AGI for various income ranges: 0.9% for AGIs $10k-25k, 1.2% for AGIs $25k-50k, 3.7% for AGIs $50k-75k, 2.2% for AGIs $75k-100k, 20.1% for AGIs over 100k)
Profit/loss from business: +$14,400 (reported on 16.8% of returns)
Here:
+$14,400
State:
+$10,634
(% of AGI for various income ranges: 8.9% for AGIs $10k-25k, 2.8% for AGIs $25k-50k, 2.7% for AGIs $50k-75k, 3.9% for AGIs $75k-100k, 2.8% for AGIs over 100k)
IRA payment deduction: $3,202 (reported on 4.4% of returns)
33305:
$3,202
Florida:
$3,082
(% of AGI for various income ranges: 0.4% for AGIs $10k-25k, 0.4% for AGIs $25k-50k, 0.3% for AGIs $50k-75k, 0.3% for AGIs $75k-100k, 0.1% for AGIs over 100k)
Self-employed pension: $15,866 (reported on 1.1% of returns)
Here:
$15,866
Florida:
$15,857
Total itemized deductions: $22,658 (18% of AGI, reported on 42.7% of returns)
Here:
$22,658
State:
$20,370
Here:
18.3% of AGI
State:
20.7% of AGI
(% of AGI for various income ranges: 19.1% for AGIs $10k-25k, 16.7% for AGIs $25k-50k, 18.7% for AGIs $50k-75k, 17.3% for AGIs $75k-100k, 10.6% for AGIs over 100k)
Charity contributions deductions: $3,126 (2% of AGI, reported on 36.8% of returns)
Here:
$3,126
State:
$4,064
Here:
2.5% of AGI
State:
3.8% of AGI
(% of AGI for various income ranges: 1.4% for AGIs $10k-25k, 1.5% for AGIs $25k-50k, 1.8% for AGIs $50k-75k, 1.7% for AGIs $75k-100k, 1.6% for AGIs over 100k)
Total tax: $15,374 (reported on 82.0% of returns)
33305:
$15,374
State:
$9,431
(% of AGI for various income ranges: 5.6% for AGIs $10k-25k, 8.8% for AGIs $25k-50k, 11.7% for AGIs $50k-75k, 13.4% for AGIs $75k-100k, 21.8% for AGIs over 100k)
Earned income credit: $1,056 (reported on 10.1% of returns)
Here:
$1,056
State:
$1,808
Percentage of individuals using paid preparers for their 2004 taxes: 60.9%
Here:
61%
State:
60%
(% for various income ranges: 60.4% for AGIs below $10k, 56.6% for AGIs $10k-25k, 53.0% for AGIs $25k-50k, 62.5% for AGIs $50k-75k, 67.1% for AGIs $75k-100k, 78.6% for AGIs over 100k)
Likely homosexual households (counted as self-reported same-sex unmarried-partner households)
Lesbian couples: 0.3% of all households
Gay men: 3.2% of all households
Household received Food Stamps/SNAP in the past 12 months: 220 Household did not receive Food Stamps/SNAP in the past 12 months: 6,930
Women who had a birth in the past 12 months: 161 (131 now married, 33 unmarried) Women who did not have a birth in the past 12 months: 2,119 (809 now married, 1,309 unmarried)
Housing units in zip code 33305 with a mortgage: 2,638 (162 second mortgage, 131 both second mortgage and home equity loan) Houses without a mortgage: 193
Median monthly owner costs for units with a mortgage: $2,802 Median monthly owner costs for units without a mortgage: $891
Residents with income below the poverty level in 2022:
This zip code:
7.9%
Whole state:
12.7%
Residents with income below 50% of the poverty level in 2022:
This zip code:
5.3%
Whole state:
6.6%
Median number of rooms in houses and condos:
Here:
5.4
State:
5.9
Median number of rooms in apartments:
Here:
3.2
State:
4.2
Notable locations in this zip code not listed on our city pages
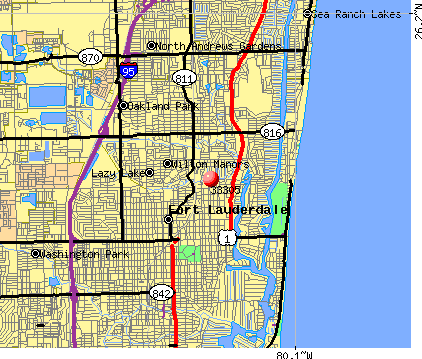
Notable locations in zip code 33305: Wilton Manors Public Library (A), Manor Pines Convalescent Center (B), Kids in Distress (C), Fire Station Number 16 (D), Fire Station Number 29 (E), Fort Lauderdale Fire Rescue Station 29 (F), Fort Lauderdale Fire Rescue Station 16 (G), Wilton Manors Police Department (H). Display/hide their locations on the map
Churches in zip code 33305 include: Trinity United Methodist Church (A), Central Baptist Church (B), Church by the Sea (C). Display/hide their locations on the map
789 married couples with children.
648 single-parent households (142 men, 506 women).
77.3% of residents of 33305 zip code speak English at home.
8.6% of residents speak Spanish at home (83% very well, 13% well, 2% not well, 2% not at all).
11.6% of residents speak other Indo-European language at home (81% very well, 13% well, 1% not well, 5% not at all).
1.5% of residents speak Asian or Pacific Island language at home (74% very well, 25% well, 1% not well).
1.0% of residents speak other language at home (91% very well, 9% not well).
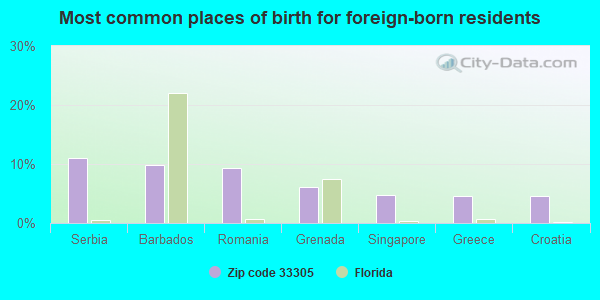
Foreign born population: 2,373 (18.3%) (74.5% of them are naturalized citizens)
This zip code:
18.3%
Whole state:
21.7%
11%Serbia
10%Barbados
9%Romania
6%Grenada
5%Singapore
5%Greece
5%Croatia
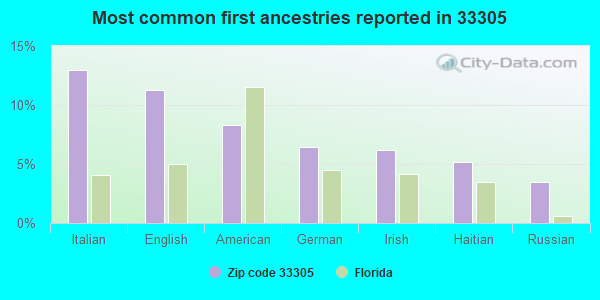
13%Italian
11%English
8%American
6%German
6%Irish
5%Haitian
3%Russian
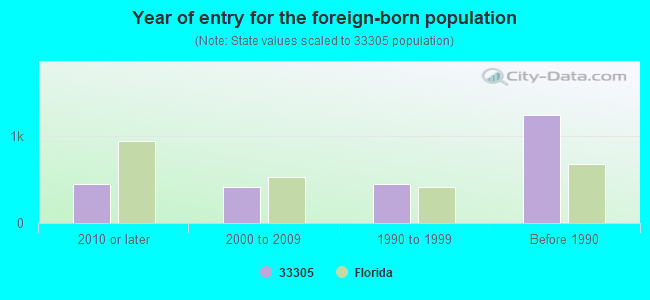
Year of entry for the foreign-born population
4502010 or later
4202000 to 2009
4531990 to 1999
1,246Before 1990
Facilities with environmental interests located in this zip code:
SHELL #100672 (1819 N. FEDERAL HHIGHWAY in FORT LAUDERDALE, FL)
STATE MASTER (FDM) - WAFR-FLG911754, INDUSTRIAL WASTEWATER PROGRAM National Pollutant Discharge Elimination System NON-MAJOR (Tracking pollutant discharge elimination systems) - permit Business SIC classification: GASOLINE SERVICE STATIONS Organizations: GROUNDWATER & ENVIRONMENTAL SERVICES, INC., CRAIG HURST (CONTACT/OWNER)
, GROUNDWATER & ENVIRONMENTAL SERVICES, INC. (CONTACT/PERMIT)
Alternative names: SHELL STORE #100672 IN FORT LA, SHELL STORE #100672 IN FORT LAUDERDALE
GULF PLATING INC (2501 NE 13TH AVE in WILTON MANORS, FL)
AIR MINOR (AIRS/AFS) National Pollutant Discharge Elimination System NON-MAJOR (Tracking pollutant discharge elimination systems) - permit (Resource Conservation and Recovery Act (tracking hazardous waste)) Business SIC classification: ELECTROPLATING, PLATING, POLISHING, ANODIZING, AND COLORING Organizations: JOHN RICHARDS (CONTACT/OWNER)
Alternative names: POWELL MOTOR CO, POWELL MOTOR CO
KIDS IN DISTRESS, INC. (819 NE 26TH STREET in FT. LAUDERDALE, FL)
(National Center for Education Statistics) - STATE ID-5506 Organizations: BROWARD COUNTY SCHOOL DISTRICT (SCHOOL DISTRICT)
7-ELEVEN STORE #24644 (1500 NE 26TH STREET in WILTON MANORS, FL)
National Pollutant Discharge Elimination System NON-MAJOR (Tracking pollutant discharge elimination systems) - permit Organizations: WILLO SMITH (CONTACT/OWNER)
Alternative names: HANDYWAY STORE #2292 (IW)
ISLAND VILLAS (2711 NW 8TH AVENUE in WILTON MANORS, FL)
National Pollutant Discharge Elimination System NON-MAJOR (Tracking pollutant discharge elimination systems) - permit Organizations: SAM YECUTIELI (CONTACT/OWNER)
LETARTE PROPERTY HOMES (NE 7TH AND NE 20TH DRIVE in WILTON MANORS, FL)
National Pollutant Discharge Elimination System NON-MAJOR (Tracking pollutant discharge elimination systems) - permit Organizations: GLENN WRIGHT (CONTACT/OWNER)
PALM PONTIAC INC (1750 NORTH FEDERAL HWY in FORT LAUDERDALE, FL)
(Resource Conservation and Recovery Act (tracking hazardous waste)) Organizations: KEVIN P KELLEY (CONTACT/OWNER)
DEEM INVESTMENT CORP (1630 N FEDERAL HWY in FORT LAUDERDALE, FL)
(Resource Conservation and Recovery Act (tracking hazardous waste)) Business NAICS classification: PRIMARY BATTERY MANUFACTURING. Organizations: NON NOTIFIER (CONTACT/OWNER)
AAPEX BODY SHOP INC (1636 NE 12TH TERRACE in FORT LAUDERDALE, FL)
Small Quantity Generators, between 100 kg and 1000 kg of hazardous waste/month (Resource Conservation and Recovery Act (tracking hazardous waste)) - notification Organizations: HORNING TED PRES (CONTACT/OWNER)
AMOCO SERVICE STATION #1866 (1725 NE 4TH AVE in FORT LAUDERDALE, FL)
Small Quantity Generators, between 100 kg and 1000 kg of hazardous waste/month (Resource Conservation and Recovery Act (tracking hazardous waste)) - notification Organizations: SCHECTER, HOWARD (CONTACT/OWNER)
Housing units lacking complete plumbing facilities: 0.4% Housing units lacking complete kitchen facilities: 1.5%
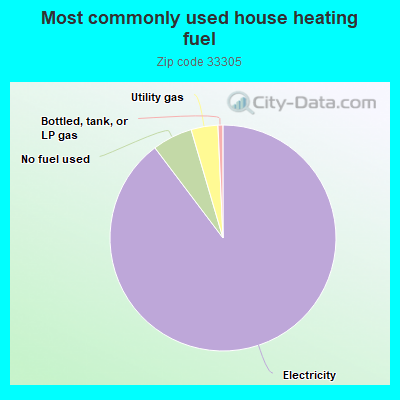
89.0%Electricity
5.7%No fuel used
3.8%Utility gas
0.7%Bottled, tank, or LP gas
Population in 1990: 11,018. Population change in the 1990s: +996 (+9.0%).
Place of birth for U.S.-born residents:
This state: 3,705
Northeast: 3,194
Midwest: 1,442
South: 1,602
West: 345
51% of the 33305 zip code residents lived in the same house 5 years ago. Out of people who lived in different houses, 62% lived in this county. Out of people who lived in different counties, 50% lived in Florida.
83% of the 33305 zip code residents lived in the same house 1 year ago. Out of people who lived in different houses, 53% moved from this county. Out of people who lived in different houses, 7% moved from different county within same state. Out of people who lived in different houses, 35% moved from different state. Out of people who lived in different houses, 1% moved from abroad.
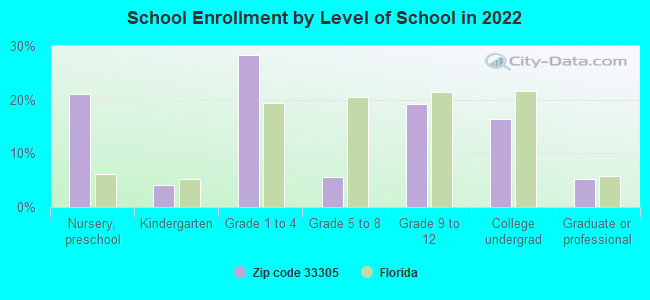
Private vs. public school enrollment:
Students in private schools in grades 1 to 8 (elementary and middle school): 230
Here:
47.3%
Florida:
15.8%
Students in private schools in grades 9 to 12 (high school): 172
Here:
63.5%
Florida:
12.9%
Students in private undergraduate colleges: 88
Here:
37.2%
Florida:
23.6%
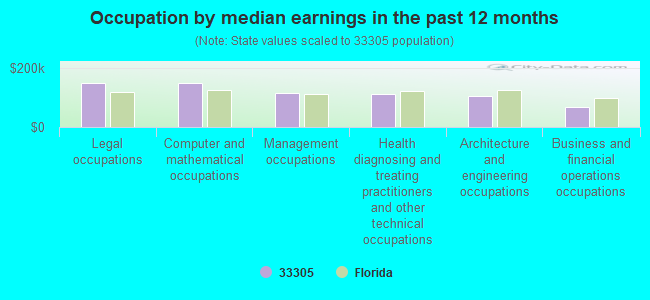
Occupation by median earnings in the past 12 months ($)
148,716Legal occupations
148,487Computer and mathematical occupations
115,686Management occupations
112,415Health diagnosing and treating practitioners and other technical occupations
105,725Architecture and engineering occupations
68,677Business and financial operations occupations
Companies with federal contracts located in this zip code (FORT LAUDERDAL, FL):
BOCA FOODS COMPANY (1660 NE 12TH TERRACE) : $1,474,700 in 5 contractsfrom 2004 to 2005
Contracts for Food Items For Resale by Defense Commissary Agency Signed by year:2000: $0; 2001: $0; 2002: $0; 2003: $0; 2004: $389,690; 2005: $1,085,010; 2006: $0.
Biggest contracts:
$518,032 with Defense Commissary Agency for Food Items For Resale. Signed on 2005-04-01. Completion date: 2005-08-31.
$389,690, same as above.Signed on 2004-10-01. Completion date: 2005-02-28.
$279,509, same as above.Signed on 2005-10-01. Completion date: 2005-12-31.
$182,093, same as above.Signed on 2005-01-01. Completion date: 2005-03-31.
INNOVATIVE DEFENSE STRATEGIES, (2100 N OCEAN BLVD STE PH 2; small business)
$99,900 with Navy for Technology Studies. Taking place in VA. Signed on 2006-05-18. Completion date: 2007-05-18.
IMPSAT USA INC (2040 NORTH DIXIE HIGHWAY; small business) 1001 employees, $0 revenue. : $34,650 in 5 contractsfrom 2002 to 2004
Contracts for ADP Support Equipment, Telephone and/or Communications Services (includes Telegraph, Telex, and Cablevision Services), ADP Facility Operation and Maintenance Services, ADP Central Processing Unit (CPU, Computer), Analog by Army Signed by year:2000: $0; 2001: $0; 2002: $10,350; 2003: $18,900; 2004: $5,400; 2005: $0; 2006: $0.
Biggest contracts:
$12,000 with Army for ADP Support Equipment. Taking place in GA. Signed on 2003-06-26. Completion date: 2004-06-30.
$10,350 with Army for Telephone and/or Communications Services (includes Telegraph, Telex, and Cablevision Services). Taking place in GA. Signed on 2002-11-21. Completion date: 2003-05-31.
$5,400 with Army for ADP Facility Operation and Maintenance Services. Taking place in GA. Signed on 2004-07-13. Completion date: 2005-06-30.
$3,450 with Army for ADP Central Processing Unit (CPU, Computer), Analog. Taking place in AZ. Signed on 2003-06-04. Completion date: 2003-06-30.
IMAGE MATTERS INC (2809 NE 23 STREET; small business) : $8,423 in 3 contractsfrom 2000 to 2004
$7,423 with Army for Signs, Advertising Displays, and Identification Plates. Taking place in PA. Signed on 2004-09-30. Completion date: 2004-10-31.
$1,000 with Department of State for Miscellaneous Items. Signed on 2000-07-15. Completion date: 2000-05-15.
$0, same as above.Signed on 2000-07-15. Completion date: 2000-05-15.
BARBARA HELLER (1625 NE 16 TERR; small business)
$6,480 with U.S. Army Corps of Engineers - civil program financing only for Recreation Site Maintenance Services (non-construction). Taking place in GA. Signed on 2001-04-23. Completion date: 2001-09-10.
MOBILE STUDIOS INC (2500 N FEDERAL HWY STE 204; small business) : $5,421 in 2 contractsin 2005
$5,420 with Navy for Cabinets, Lockers, Bins, and Shelving. Taking place in HI. Signed on 2005-03-23. Completion date: 2005-04-20.
$1, same as above.Signed on 2005-03-24. Completion date: 2005-04-20.
Top industries in this zip code by the number of employees in 2005:
2002 - 2018 National Fire Incident Reporting System (NFIRS) incidents
Based on the data from the years 2002 - 2018 the average number of fire incidents per year is 24. The highest number of reported fire incidents - 47 took place in 2016, and the least - 0 in 2003. The data has an increasing trend.
When looking into fire subcategories, the most reports belonged to: Structure Fires (40.1%), and Outside Fires (34.9%).
Fire incident types reported to NFIRS in Zip Code 33305


 Nearest zip codes: 33304, 33306, 33334, 33301, 33308, 33311.


 Based on the data from the years 2002 - 2018 the average number of fire incidents per year is 24. The highest number of reported fire incidents - 47 took place in 2016, and the least - 0 in 2003. The data has an increasing trend.
 When looking into fire subcategories, the most reports belonged to: Structure Fires (40.1%), and Outside Fires (34.9%).