Estimated zip code population in 2022: 17,550 Zip code population in 2010: 14,586 Zip code population in 2000: 11,996
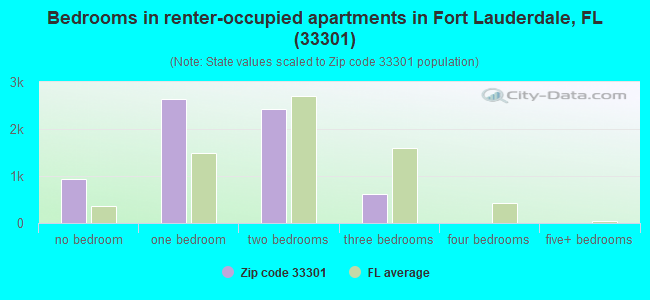
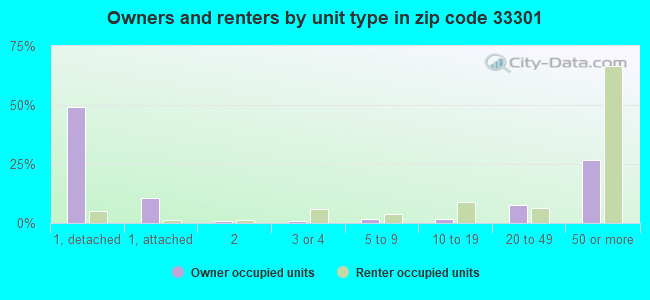
Houses and condos: 13,838 Renter-occupied apartments: 6,526
% of renters here:
62%
State:
33%
March 2022 cost of living index in zip code 33301: 112.7 (more than average, U.S. average is 100)
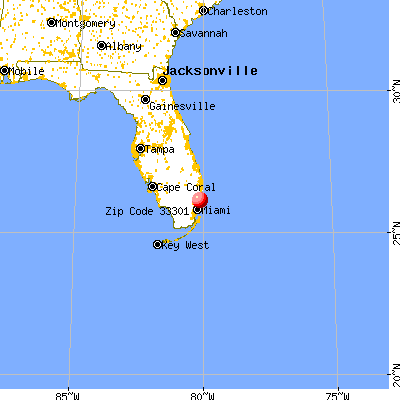
Land area: 2.5 sq. mi. Water area: 0.1 sq. mi.
Population density: 6,996 people per square mile
(high).
OSM Map
General Map
Google Map
MSN Map
OSM Map
General Map
Google Map
MSN Map
OSM Map
General Map
Google Map
MSN Map
OSM Map
General Map
Google Map
MSN Map
Please wait while loading the map...
Real estate property taxes paid for housing units in 2022:
This zip code:
0.9% ($7,349)
Florida:
0.7% ($2,529)
Median real estate property taxes paid for housing units with mortgages in 2022: $7,438 (0.8%) Median real estate property taxes paid for housing units with no mortgage in 2022: $7,070 (0.9%)
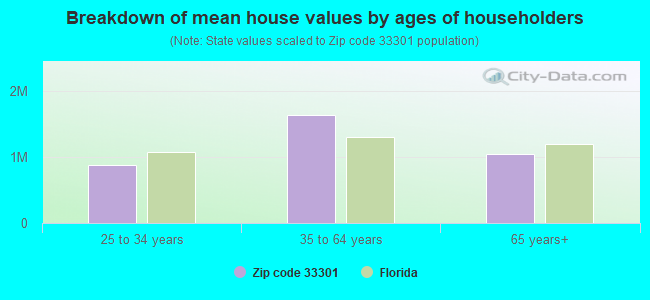
Estimated median house/condo value in 2022: $850,470
33301:
$850,470
Florida:
$354,100
According to our research of Florida and other state lists, there were 17 registered sex offenders living in 33301 zip code as of April 27, 2024. The ratio of all residents to sex offenders in zip code 33301 is 809 to 1. The ratio of registered sex offenders to all residents in this zip code is lower than the state average.
Median resident age:
This zip code:
41.6 years
Florida median age:
42.7 years
Average household size:
This zip code:
1.6 people
Florida:
2.5 people
Averages for the 2020 tax year for zip code 33301, filed in 2021:
Average Adjusted Gross Income (AGI) in 2020: $348,585 (Individual Income Tax Returns)
Here:
$348,585
State:
$82,200
Salary/wage: $170,471 (reported on 76.8% of returns)
Here:
$170,471
State:
$58,347
(% of AGI for various income ranges: 1291.2% for AGIs below $25k, 4252.8% for AGIs $25k-50k, 7366.2% for AGIs $50k-75k, 10693.1% for AGIs $75k-100k, 20837.8% for AGIs $100k-200k, 203140.2% for AGIs over 200k)
Taxable interest for individuals: $16,292 (reported on 41.0% of returns)
This zip code:
$16,292
Florida:
$4,272
(% of AGI for various income ranges: 45.8% for AGIs below $25k, 69.6% for AGIs $25k-50k, 112.0% for AGIs $50k-75k, 159.2% for AGIs $75k-100k, 436.1% for AGIs $100k-200k, 13017.5% for AGIs over 200k)
Ordinary dividends: $35,273 (reported on 40.5% of returns)
Here:
$35,273
State:
$15,863
(% of AGI for various income ranges: 103.8% for AGIs below $25k, 197.2% for AGIs $25k-50k, 270.1% for AGIs $50k-75k, 468.1% for AGIs $75k-100k, 1170.5% for AGIs $100k-200k, 27087.1% for AGIs over 200k)
Net capital gain/loss in AGI: +$309,498 (reported on 42.3% of returns)
Here:
+$309,498
State:
+$62,983
(% of AGI for various income ranges: 53.2% for AGIs below $25k, 141.1% for AGIs $25k-50k, 214.6% for AGIs $50k-75k, 388.1% for AGIs $75k-100k, 1520.0% for AGIs $100k-200k, 281557.6% for AGIs over 200k)
Profit/loss from business: +$29,898 (reported on 24.1% of returns)
Here:
+$29,898
State:
+$9,719
(% of AGI for various income ranges: 371.0% for AGIs below $25k, 382.5% for AGIs $25k-50k, 419.4% for AGIs $50k-75k, 624.7% for AGIs $75k-100k, 1060.0% for AGIs $100k-200k, 10147.6% for AGIs over 200k)
Taxable individual retirement arrangement distribution: $40,816 (reported on 8.1% of returns)
33301:
$40,816
Florida:
$24,823
(% of AGI for various income ranges: 59.6% for AGIs below $25k, 110.5% for AGIs $25k-50k, 166.5% for AGIs $50k-75k, 323.0% for AGIs $75k-100k, 865.2% for AGIs $100k-200k, 4363.5% for AGIs over 200k)
Self-employed (Keogh) retirement plans: $32,455 (reported on 1.8% of returns)
33301:
$32,455
Florida:
$29,694
(% of AGI for various income ranges: 48.9% for AGIs $50k-75k, 75.3% for AGIs $100k-200k, 1056.5% for AGIs over 200k)
Total itemized deductions: $83,688 (reported on 19.9% of returns)
Here:
$83,688
State:
$45,393
(% of AGI for various income ranges: 146.9% for AGIs below $25k, 251.0% for AGIs $25k-50k, 438.1% for AGIs $50k-75k, 769.7% for AGIs $75k-100k, 1600.8% for AGIs $100k-200k, 30404.5% for AGIs over 200k)
Charity contributions: $55,584 (reported on 16.2% of returns)
Here:
$55,584
State:
$20,178
(% of AGI for various income ranges: 11.4% for AGIs below $25k, 26.4% for AGIs $25k-50k, 55.8% for AGIs $50k-75k, 119.7% for AGIs $75k-100k, 239.5% for AGIs $100k-200k, 18782.2% for AGIs over 200k)
Taxes paid: $8,412 (reported on 19.5% of returns)
33301:
$8,412
State:
$6,967
(% of AGI for various income ranges: 36.7% for AGIs below $25k, 55.4% for AGIs $25k-50k, 99.1% for AGIs $50k-75k, 169.2% for AGIs $75k-100k, 411.6% for AGIs $100k-200k, 2138.5% for AGIs over 200k)
Earned income credit: $1,255 (reported on 6.9% of returns)
Here:
$1,255
State:
$2,306
(% of AGI for various income ranges: 54.1% for AGIs below $25k, 19.0% for AGIs $25k-50k)
Percentage of individuals using paid preparers for their 2020 taxes: 92.7%
Here:
93%
State:
92%
(% for various income ranges: 90.0% for AGIs below $25k, 92.8% for AGIs $25k-50k, 93.6% for AGIs $50k-75k, 94.5% for AGIs $75k-100k, 93.2% for AGIs $100k-200k, 93.1% for AGIs over 200k)
Averages for the 2012 tax year for zip code 33301, filed in 2013:
Average Adjusted Gross Income (AGI) in 2012: $227,038 (Individual Income Tax Returns)
Here:
$227,038
State:
$60,316
Salary/wage: $118,583 (reported on 76.5% of returns)
Here:
$118,583
State:
$45,277
(% of AGI for various income ranges: 72.7% for AGIs below $25k, 79.2% for AGIs $25k-50k, 74.9% for AGIs $50k-75k, 69.1% for AGIs $75k-100k, 67.1% for AGIs $100k-200k, 31.7% for AGIs over 200k)
Taxable interest for individuals: $13,869 (reported on 43.7% of returns)
This zip code:
$13,869
Florida:
$3,587
(% of AGI for various income ranges: 2.5% for AGIs below $25k, 1.7% for AGIs $25k-50k, 1.5% for AGIs $50k-75k, 1.1% for AGIs $75k-100k, 2.0% for AGIs $100k-200k, 2.9% for AGIs over 200k)
Ordinary dividends: $38,990 (reported on 37.5% of returns)
Here:
$38,990
State:
$12,831
(% of AGI for various income ranges: 6.7% for AGIs below $25k, 4.0% for AGIs $25k-50k, 4.0% for AGIs $50k-75k, 4.7% for AGIs $75k-100k, 5.1% for AGIs $100k-200k, 6.9% for AGIs over 200k)
Net capital gain/loss in AGI: +$126,793 (reported on 36.8% of returns)
Here:
+$126,793
State:
+$33,493
(% of AGI for various income ranges: 0.5% for AGIs below $25k, 0.8% for AGIs $25k-50k, 0.8% for AGIs $50k-75k, 1.2% for AGIs $75k-100k, 3.5% for AGIs $100k-200k, 25.5% for AGIs over 200k)
Profit/loss from business: +$32,486 (reported on 20.2% of returns)
Here:
+$32,486
State:
+$10,012
(% of AGI for various income ranges: 12.1% for AGIs below $25k, 5.0% for AGIs $25k-50k, 4.7% for AGIs $50k-75k, 3.7% for AGIs $75k-100k, 4.9% for AGIs $100k-200k, 2.3% for AGIs over 200k)
Taxable individual retirement arrangement distribution: $44,333 (reported on 10.1% of returns)
33301:
$44,333
Florida:
$21,544
(% of AGI for various income ranges: 2.9% for AGIs below $25k, 2.5% for AGIs $25k-50k, 2.4% for AGIs $50k-75k, 4.5% for AGIs $75k-100k, 3.7% for AGIs $100k-200k, 1.6% for AGIs over 200k)
Self-employment retirement plans: $29,525 (reported on 1.4% of returns)
33301:
$29,525
Florida:
$20,611
(% of AGI for various income ranges: 0.4% for AGIs $25k-50k, 0.5% for AGIs $100k-200k, 0.2% for AGIs over 200k)
Total itemized deductions: $65,293 (14% of AGI, reported on 42.1% of returns)
Here:
$65,293
State:
$25,533
Here:
14.1% of AGI
State:
18.0% of AGI
(% of AGI for various income ranges: 16.9% for AGIs below $25k, 14.0% for AGIs $25k-50k, 14.3% for AGIs $50k-75k, 15.3% for AGIs $75k-100k, 14.9% for AGIs $100k-200k, 11.4% for AGIs over 200k)
Charity contributions: $13,214 (reported on 34.5% of returns)
Here:
$13,214
State:
$5,698
(% of AGI for various income ranges: 0.8% for AGIs below $25k, 1.1% for AGIs $25k-50k, 1.1% for AGIs $50k-75k, 1.4% for AGIs $75k-100k, 1.6% for AGIs $100k-200k, 2.2% for AGIs over 200k)
Taxes paid: $25,599 (reported on 41.5% of returns)
33301:
$25,599
State:
$6,203
(% of AGI for various income ranges: 4.1% for AGIs below $25k, 3.2% for AGIs $25k-50k, 3.3% for AGIs $50k-75k, 4.1% for AGIs $75k-100k, 4.7% for AGIs $100k-200k, 4.8% for AGIs over 200k)
Earned income credit: $1,220 (reported on 8.1% of returns)
Here:
$1,220
State:
$2,372
(% of AGI for various income ranges: 2.6% for AGIs below $25k, 0.2% for AGIs $25k-50k)
Percentage of individuals using paid preparers for their 2012 taxes: 66.8%
Here:
67%
State:
54%
(% for various income ranges: 64.0% for AGIs below $25k, 57.3% for AGIs $25k-50k, 56.0% for AGIs $50k-75k, 68.0% for AGIs $75k-100k, 72.1% for AGIs $100k-200k, 86.7% for AGIs over 200k)
Averages for the 2004 tax year for zip code 33301, filed in 2005:
Average Adjusted Gross Income (AGI) in 2004: $145,778 (Individual Income Tax Returns)
Here:
$145,778
State:
$50,523
Salary/wage: $87,299 (reported on 75.3% of returns)
Here:
$87,299
State:
$39,563
(% of AGI for various income ranges: 77.4% for AGIs $10k-25k, 78.1% for AGIs $25k-50k, 73.0% for AGIs $50k-75k, 67.1% for AGIs $75k-100k, 35.0% for AGIs over 100k)
Taxable interest for individuals: $10,717 (reported on 54.6% of returns)
This zip code:
$10,717
Florida:
$3,211
(% of AGI for various income ranges: 4.7% for AGIs $10k-25k, 2.9% for AGIs $25k-50k, 3.4% for AGIs $50k-75k, 3.5% for AGIs $75k-100k, 3.5% for AGIs over 100k)
Taxable dividends: $18,719 (reported on 43.0% of returns)
Here:
$18,719
State:
$6,129
(% of AGI for various income ranges: 5.8% for AGIs $10k-25k, 3.7% for AGIs $25k-50k, 4.0% for AGIs $50k-75k, 3.4% for AGIs $75k-100k, 5.1% for AGIs over 100k)
Net capital gain/loss: +$131,986 (reported on 42.4% of returns)
Here:
+$131,986
State:
+$27,205
(% of AGI for various income ranges: 0.7% for AGIs $10k-25k, 0.9% for AGIs $25k-50k, 1.7% for AGIs $50k-75k, 3.7% for AGIs $75k-100k, 41.5% for AGIs over 100k)
Profit/loss from business: +$25,423 (reported on 19.0% of returns)
Here:
+$25,423
State:
+$10,634
(% of AGI for various income ranges: 10.3% for AGIs $10k-25k, 5.4% for AGIs $25k-50k, 3.4% for AGIs $50k-75k, 6.2% for AGIs $75k-100k, 2.7% for AGIs over 100k)
IRA payment deduction: $3,197 (reported on 4.3% of returns)
33301:
$3,197
Florida:
$3,082
(% of AGI for various income ranges: 0.4% for AGIs $10k-25k, 0.4% for AGIs $25k-50k, 0.2% for AGIs $50k-75k, 0.2% for AGIs $75k-100k, 0.0% for AGIs over 100k)
Self-employed pension: $19,496 (reported on 2.1% of returns)
Here:
$19,496
Florida:
$15,857
(% of AGI for various income ranges: 0.4% for AGIs $10k-25k, 0.4% for AGIs $50k-75k, 0.3% for AGIs over 100k)
Total itemized deductions: $40,079 (14% of AGI, reported on 46.2% of returns)
Here:
$40,079
State:
$20,370
Here:
14.5% of AGI
State:
20.7% of AGI
(% of AGI for various income ranges: 18.9% for AGIs $10k-25k, 18.5% for AGIs $25k-50k, 19.6% for AGIs $50k-75k, 21.0% for AGIs $75k-100k, 10.2% for AGIs over 100k)
Charity contributions deductions: $7,401 (2% of AGI, reported on 39.6% of returns)
Here:
$7,401
State:
$4,064
Here:
2.4% of AGI
State:
3.8% of AGI
(% of AGI for various income ranges: 1.3% for AGIs $10k-25k, 1.6% for AGIs $25k-50k, 1.6% for AGIs $50k-75k, 2.0% for AGIs $75k-100k, 1.9% for AGIs over 100k)
Total tax: $42,721 (reported on 82.7% of returns)
33301:
$42,721
State:
$9,431
(% of AGI for various income ranges: 6.0% for AGIs $10k-25k, 9.2% for AGIs $25k-50k, 12.0% for AGIs $50k-75k, 14.1% for AGIs $75k-100k, 24.6% for AGIs over 100k)
Earned income credit: $952 (reported on 6.0% of returns)
Here:
$952
State:
$1,808
Percentage of individuals using paid preparers for their 2004 taxes: 66.6%
Here:
67%
State:
60%
(% for various income ranges: 68.1% for AGIs below $10k, 59.4% for AGIs $10k-25k, 56.7% for AGIs $25k-50k, 61.5% for AGIs $50k-75k, 65.1% for AGIs $75k-100k, 82.0% for AGIs over 100k)
Likely homosexual households (counted as self-reported same-sex unmarried-partner households)
Lesbian couples: 0.1% of all households
Gay men: 0.5% of all households
Household received Food Stamps/SNAP in the past 12 months: 259 Household did not receive Food Stamps/SNAP in the past 12 months: 10,394
Women who had a birth in the past 12 months: 91 (96 now married, 0 unmarried) Women who did not have a birth in the past 12 months: 4,152 (1,405 now married, 2,746 unmarried)
Housing units in zip code 33301 with a mortgage: 2,064 (264 second mortgage, 235 both second mortgage and home equity loan) Houses without a mortgage: 26
Median monthly owner costs for units with a mortgage: $3,617 Median monthly owner costs for units without a mortgage: $1,523
Residents with income below the poverty level in 2022:
This zip code:
5.6%
Whole state:
12.7%
Residents with income below 50% of the poverty level in 2022:
This zip code:
2.3%
Whole state:
6.6%
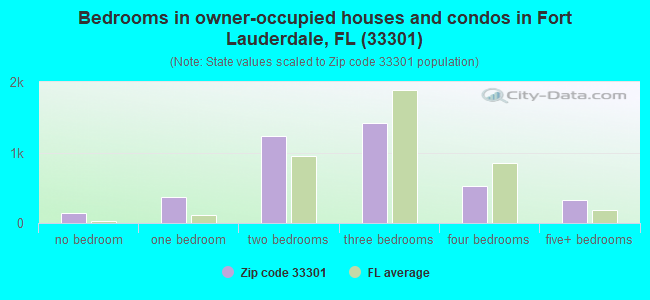
Median number of rooms in houses and condos:
Here:
5.7
State:
5.9
Median number of rooms in apartments:
Here:
3.2
State:
4.2
Notable locations in this zip code not listed on our city pages
Notable locations in zip code 33301: Plaza Executive Center (A), One River Plaza (B), Best Plaza (C), Fort Lauderdale Library Main Branch (D), Broward County Sheriff's Office (E), Josephine S Leiser Opera Center (F), Collins Community Center (G), Fort Lauderdale Historical Society (H), Historical Society of Fort Lauderdale (I), Broward County Library System Main Library (J). Display/hide their locations on the map
Churches in zip code 33301 include: First United Methodist Church (A), Church of God Pompano Beach (B), Saint Elizabeth Catholic Church (C), Apostolic Lighthouse (D), New Hope Baptist Church (E), Immanuel Baptist Church (F), Northeast Baptist Church (G), Saint Anthony Catholic Church (H), All Saints Episcopal Church (I). Display/hide their locations on the map
870 married couples with children.
232 single-parent households (89 men, 143 women).
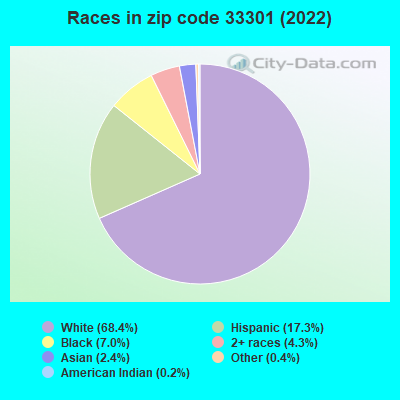
76.8% of residents of 33301 zip code speak English at home.
11.9% of residents speak Spanish at home (86% very well, 12% well, 2% not well).
6.6% of residents speak other Indo-European language at home (83% very well, 9% well, 4% not well, 4% not at all).
1.8% of residents speak Asian or Pacific Island language at home (88% very well, 7% well, 5% not well).
2.6% of residents speak other language at home (79% very well, 17% well, 3% not well).
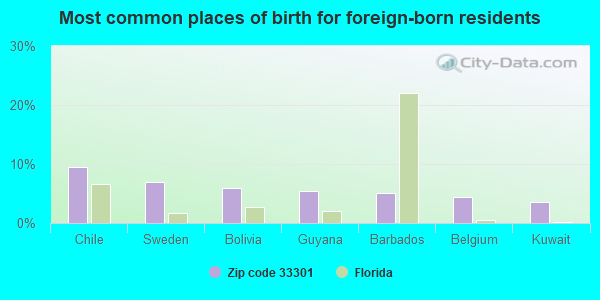
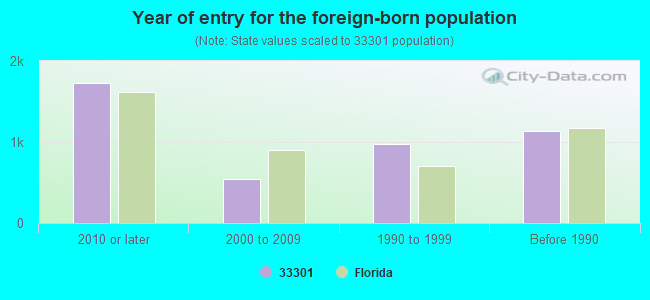
Foreign born population: 3,304 (18.8%) (55.6% of them are naturalized citizens)
Major facilities with environmental interests located in this zip code:
HATTERAS OF LAUDERDALE (401 SW 1ST AVE in FORT LAUDERDALE, FL)
(Integrated Compliance Information System) - ICIS-04-2000-0033, FORMAL ENFORCEMENT ACTION (Resource Conservation and Recovery Act (tracking hazardous waste)) Business SIC classification: BOAT BUILDING AND REPAIRING Business NAICS classification: BOAT BUILDING. Organizations: SEAROCK INC (CONTACT/OWNER)
GULF PLATING (518 SW 1ST AVE in FORT LAUDERDALE, FL)
(Integrated Compliance Information System) - ICIS-04-1998-0433, FORMAL ENFORCEMENT ACTION Small Quantity Generators, between 100 kg and 1000 kg of hazardous waste/month (Resource Conservation and Recovery Act (tracking hazardous waste)) Business SIC classification: ELECTROPLATING, PLATING, POLISHING, ANODIZING, AND COLORING Organizations: JOHN RICHARDS, PRESIDENT (CONTACT/OWNER)
COUNTY SUPERINTENDENT'S OFFICE (600 S.E. 3RD AVENUE in FORT LAUDERDALE, FL)
(National Center for Education Statistics) - STATE ID-9001 Organizations: BROWARD COUNTY SCHOOL DISTRICT (SCHOOL DISTRICT)
COLONY CLEANERS 2029 (307 NW 1ST AVE in FORT LAUDERDALE, FL)
AIR MINOR (AIRS/AFS) Small Quantity Generators, between 100 kg and 1000 kg of hazardous waste/month (Resource Conservation and Recovery Act (tracking hazardous waste)) - notification Small Quantity Generators, between 100 kg and 1000 kg of hazardous waste/month (Resource Conservation and Recovery Act (tracking hazardous waste)) - notification Business SIC classification: DRYCLEANING PLANTS, EXCEPT RUG CLEANING Organizations: LEO A KERP (CONTACT/OWNER)
Alternative names: COLONY CLEANERS & LAUNDRY
NEW RIVER CABINETS & FIXTURE INC. (750 N. W. 57TH. COURT in FORT LAUDERDALE, FL)
AIR MINOR (AIRS/AFS) CRITERIA AND HAZARDOUS AIR POLLUTANT INVENTORY (Inventory of air pollution sources) Small Quantity Generators, between 100 kg and 1000 kg of hazardous waste/month (Resource Conservation and Recovery Act (tracking hazardous waste)) - notification Business SIC classification: WOOD KITCHEN CABINETS Business NAICS classification: WOOD KITCHEN CABINET AND COUNTERTOP MANUFACTURING. Organizations: DON ROBINSON (CONTACT/OWNER)
Alternative names: NEW RIVER CABINET & FIXTURES INC
7-ELEVEN STORE #26304 (330 N. FEDERDAL HIGHWAY in FORT LAUDERDALE, FL)
National Pollutant Discharge Elimination System NON-MAJOR (Tracking pollutant discharge elimination systems) - permit Business SIC classification: GASOLINE SERVICE STATIONS Organizations: WILLO SMITH (CONTACT/OWNER)
GOODYEAR #2537 (11 NORTH ANDREWS AVENUE in FORT LAUDERDALE, FL)
AIR MINOR (AIRS/AFS) Small Quantity Generators, between 100 kg and 1000 kg of hazardous waste/month (Resource Conservation and Recovery Act (tracking hazardous waste)) - notification Business SIC classification: TIRES AND TUBES Organizations: GODDARD W N ASST DM (CONTACT/OWNER)
Alternative names: GOODYEAR AUTO SERVICE CENTER
200 BRICKELL (218 SW 1ST AVE in FT LAUDERDALE, FL)
National Pollutant Discharge Elimination System NON-MAJOR (Tracking pollutant discharge elimination systems) - permit Organizations: TIM FAGERSTROM (CONTACT/OWNER)
ANDREWS COLLISION CENTER INC (901 N ANDREWS AVE in FORT LAUDERDALE, FL)
(Resource Conservation and Recovery Act (tracking hazardous waste)) Organizations: JOHN W PROSJE (CONTACT/OWNER)
AVENUE LOFTS (450 N. ANDREWS AVE. in FT. LAUDERDALE, FL)
National Pollutant Discharge Elimination System NON-MAJOR (Tracking pollutant discharge elimination systems) - permit Organizations: CHRIS BELLISSIMO (CONTACT/OWNER)
GORE BUILDING (201 W BROWARD BLVD in FT LAUDERDALE, FL)
(Resource Conservation and Recovery Act (tracking hazardous waste)) Organizations: STATE OF FLORIDA (CONTACT/OWNER)
HIGHWAY INDUSTRIAL CO (RAVENSWOOD RD in FORT LAUDERDALE, FL)
(Resource Conservation and Recovery Act (tracking hazardous waste)) Organizations: NON NOTIFIED (CONTACT/OWNER)
Housing units lacking complete plumbing facilities: 0.2% Housing units lacking complete kitchen facilities: 1.1%
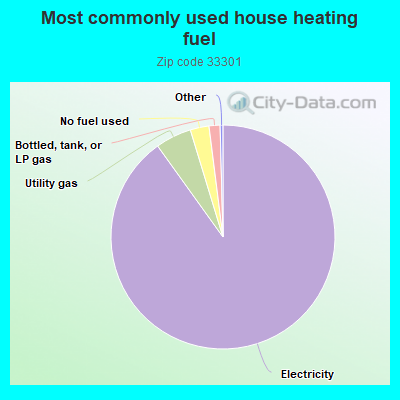
90.0%Electricity
5.2%Utility gas
2.7%No fuel used
1.6%Bottled, tank, or LP gas
Population in 1990: 12,040.
Place of birth for U.S.-born residents:
This state: 4,642
Northeast: 3,584
Midwest: 2,372
South: 1,896
West: 737
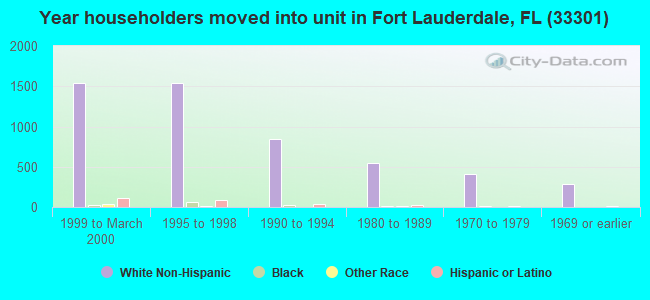
42% of the 33301 zip code residents lived in the same house 5 years ago. Out of people who lived in different houses, 55% lived in this county. Out of people who lived in different counties, 50% lived in Florida.
71% of the 33301 zip code residents lived in the same house 1 year ago. Out of people who lived in different houses, 45% moved from this county. Out of people who lived in different houses, 16% moved from different county within same state. Out of people who lived in different houses, 32% moved from different state. Out of people who lived in different houses, 4% moved from abroad.
Private vs. public school enrollment:
Students in private schools in grades 1 to 8 (elementary and middle school): 281
Here:
87.3%
Florida:
15.8%
Students in private schools in grades 9 to 12 (high school): 108
Here:
51.5%
Florida:
12.9%
Students in private undergraduate colleges: 191
Here:
40.9%
Florida:
23.6%
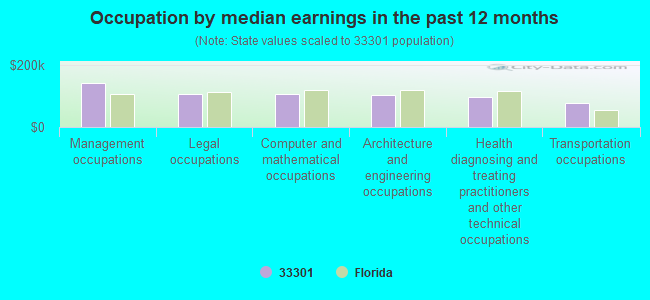
Occupation by median earnings in the past 12 months ($)
142,545Management occupations
106,268Legal occupations
105,993Computer and mathematical occupations
104,021Architecture and engineering occupations
96,243Health diagnosing and treating practitioners and other technical occupations
79,355Transportation occupations
Companies with federal contracts located in this zip code (FORT LAUDERDAL, FL):
STERLING CONSTRUCTION SERVICES (101 NE THIRD AVENUE, SUITE; small business) : $11,584,879 in 15 contractsfrom 2001 to 2006
Contracts for Maintenance, Repair or Alteration of Real Property -- Miscellaneous Buildings, Other Research and Development -- Applied Research and Exploratory Development (R&D), Other Professional Services, Maintenance, Repair or Alteration of Real Property -- Office Buildings, and moreby Navy, Army, HOUSING AND URBAN DEVELOPMENT, Department of, Department of Defense, and others Signed by year:2000: $0; 2001: $557,185; 2002: $1,644,814; 2003: $82,500; 2004: $919,563; 2005: $6,403,351; 2006: $1,977,466.
Biggest contracts:
$5,000,000 with Navy for Maintenance, Repair or Alteration of Real Property -- Miscellaneous Buildings. Taking place in MS. Signed on 2005-09-08. Completion date: 2006-09-30.
$1,977,466, same as above.Signed on 2006-03-14. Completion date: 2006-09-30.
$1,011,914 with Army for Other Research and Development -- Applied Research and Exploratory Development (R&D). Taking place in CA. Signed on 2002-08-19. Completion date: 2003-05-15.
$1,000,000 with HOUSING AND URBAN DEVELOPMENT, Department of for Other Professional Services. Taking place in MD. Signed on 2005-06-22. Effective on 2005-08-01. Completion date: 2006-07-31.
EXTREME CONSTRUCTORS, INC (30 NORTHEAST 3RD STREET; small business) : $2,373,533 in 14 contractsfrom 2000 to 2003
Contracts for Construction of Structures and Facilities -- Other Hospital Buildings, Maintenance, Repair or Alteration of Real Property -- Miscellaneous Buildings, Construction of Structures and Facilities -- Office Buildings, Maintenance, Repair or Alteration of Real Property -- Air Traffic Control Training Facilities, and moreby Army, Air Force, United States Coast Guard (disused code: now 7008) Signed by year:2000: $1,977,227; 2001: $5,870; 2002: $387,697; 2003: $2,739; 2004: $0; 2005: $0; 2006: $0.
Biggest contracts:
$1,499,000 with Army for Construction of Structures and Facilities -- Other Hospital Buildings. Signed on 2000-09-20. Completion date: 2001-10-24.
$379,999 with Air Force for Maintenance, Repair or Alteration of Real Property -- Miscellaneous Buildings. Signed on 2000-11-13. Completion date: 2000-03-30.
$366,697, same as above.Signed on 2002-01-03. Completion date: 2003-01-03.
$31,848 with Air Force for Construction of Structures and Facilities -- Office Buildings. Signed on 2000-02-28. Completion date: 2000-03-17.
SOURCELINQ, LLC (800 E BROWARD BLVD # 101; small business) : $1,156,234 in 52 contractsfrom 2002 to 2006
Contracts for Athletic and Sporting Equipment, Ground Effect Vehicles, Recreational and Gymnastic Equipment, Purchase of Structures and Facilities -- Maintenance Buildings, and moreby Army, Forest Service, Air Force, U.S. Customs Service, and others Signed by year:2000: $0; 2001: $0; 2002: $3,400; 2003: $417,072; 2004: $432,748; 2005: $178,614; 2006: $124,400.
Biggest contracts:
$312,178 with Army for Athletic and Sporting Equipment. Signed on 2003-05-30. Completion date: 2003-08-01.
$158,336, same as above.Signed on 2004-12-03. Completion date: 2005-01-19.
$56,940 with Forest Service for Ground Effect Vehicles. Taking place in CA. Signed on 2003-06-15. Completion date: 2003-07-15.
$52,708 with Air Force for Athletic and Sporting Equipment. Signed on 2004-09-14. Completion date: 2004-11-13.
NATIONSRENT COMPANIES, INC (450 E LAS OLAS BLVD, STE 1) : $66,915 in 7 contractsfrom 2005 to 2006
Contracts for Lease or Rental of Equipment -- Materials Handling Equipment, Lease or Rental of Equipment -- Special Industry Machinery, Lease or Rental of Equipment -- Lighting Fixtures and Lamps, Electrical Hardware and Supplies by Army, U.S. Customs Service, Bureau of Land Management, Navy, and others Signed by year:2000: $0; 2001: $0; 2002: $0; 2003: $0; 2004: $0; 2005: $72,065; 2006: -$5,150.
Biggest contracts:
$26,000 with Army for Lease or Rental of Equipment -- Materials Handling Equipment. Signed on 2005-06-07. Completion date: 2005-04-01.
$15,730 with U.S. Customs Service for Lease or Rental of Equipment -- Special Industry Machinery. Taking place in CA. Signed on 2005-07-26. Effective on 2005-08-08. Completion date: 2005-10-08.
$13,900 with Army for Lease or Rental of Equipment -- Materials Handling Equipment. Signed on 2005-03-23. Completion date: 2005-04-01.
$6,950, same as above.Signed on 2005-07-12. Completion date: 2005-04-01.
COMPONENT SOURCE FLORIDA (401 E LAS OLAS BLVD; small business) : $13,033 in 5 contractsin 2006
Contracts for Engine Electrical System Components, Nonaircraft by Defense Logistics Agency Signed by year:2000: $0; 2001: $0; 2002: $0; 2003: $0; 2004: $0; 2005: $0; 2006: $13,033.
Biggest contracts:
$13,033 with Defense Logistics Agency for Engine Electrical System Components, Nonaircraft. Signed on 2006-02-15. Completion date: 2006-06-08.
$10,679, same as above.Signed on 2006-02-21. Completion date: 2006-06-08.
$0, same as above.Signed on 2006-02-21. Completion date: 2006-06-08.
$0, same as above.Signed on 2006-02-15. Completion date: 2006-06-08.
TROPITRONICS INC (319 MOLA AVE; small business)
$11,704 with Army for Blood. Signed on 2005-11-30. Completion date: 2005-12-15.
DOLPH MAP CO (430 N FEDERAL HWY; small business) : $10,538 in 4 contractsfrom 2001 to 2006
$4,950 with Army for Machine Tool Accessories. Signed on 2004-01-29. Completion date: 2004-02-13.
$2,970 with Army for Drafting, Surveying, and Mapping Instruments. Signed on 2006-01-25. Completion date: 2006-01-30.
$2,580 with Army for Maps, Atlases, Charts, and Globes. Signed on 2001-12-04. Completion date: 2002-01-18.
$38 with Army for Machine Tool Accessories. Signed on 2004-02-09. Completion date: 2004-02-13.
Top industries in this zip code by the number of employees in 2005:
2002 - 2018 National Fire Incident Reporting System (NFIRS) incidents
Based on the data from the years 2002 - 2018 the average number of fires per year is 32. The highest number of fire incidents - 73 took place in 2009, and the least - 0 in 2003. The data has an increasing trend.
When looking into fire subcategories, the most incidents belonged to: Structure Fires (41.5%), and Outside Fires (35.0%).
Fire incident types reported to NFIRS in Zip Code 33301


 Nearest zip codes: 33304, 33316, 33305, 33315, 33306, 33311.
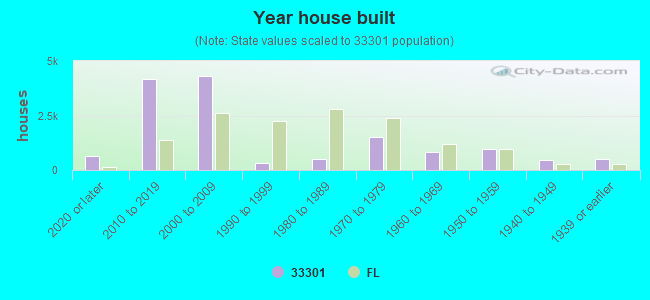


 Based on the data from the years 2002 - 2018 the average number of fires per year is 32. The highest number of fire incidents - 73 took place in 2009, and the least - 0 in 2003. The data has an increasing trend.
 When looking into fire subcategories, the most incidents belonged to: Structure Fires (41.5%), and Outside Fires (35.0%).