Races in North Babylon, New York (NY) Detailed Stats
Data:
Races - White alone (%)
Races - White alone (% change since 2000)
Races - Black alone (%)
Races - Black alone (% change since 2000)
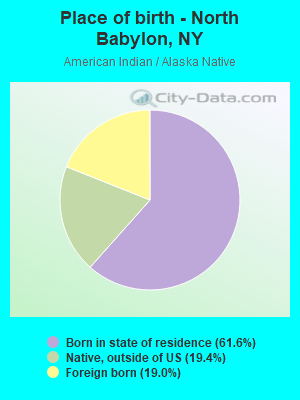
Races - American Indian alone (%)
Races - American Indian alone (% change since 2000)
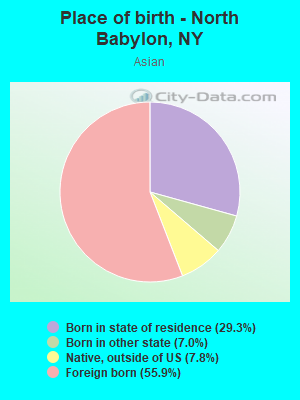
Races - Asian alone (%)
Races - Asian alone (% change since 2000)
Races - Hispanic (%)
Races - Hispanic (% change since 2000)
Races - Native Hawaiian and Other Pacific Islander alone (%)
Races - Native Hawaiian and Other Pacific Islander alone (% change since 2000)
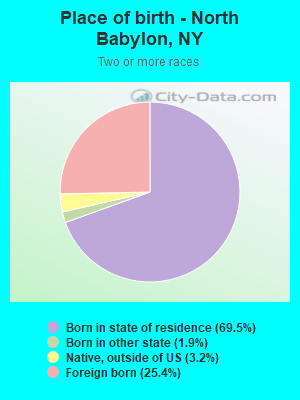
Races - Two or more races(%)
Races - Two or more races(% change since 2000)
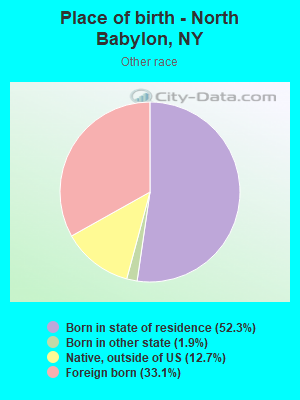
Races - Other race alone (%)
Races - Other race alone (% change since 2000)
Racial diversity
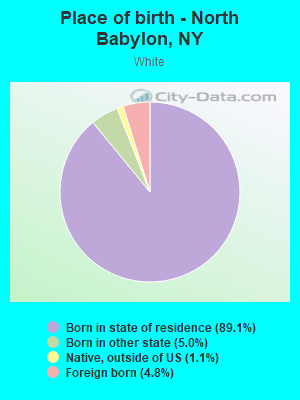
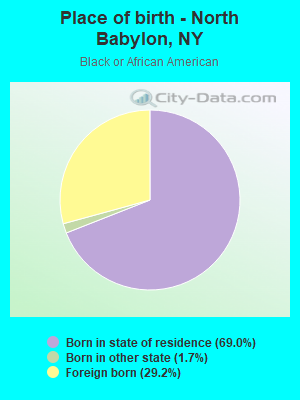
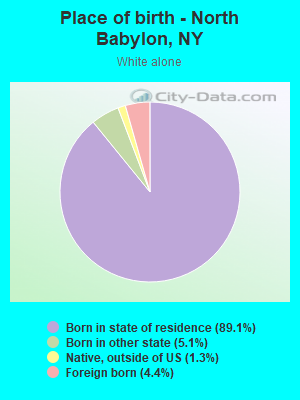
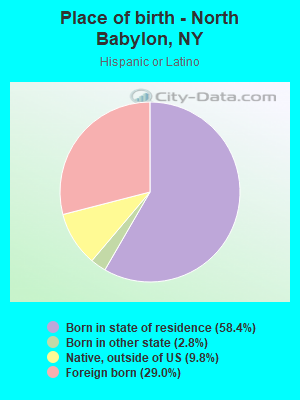
Place of birth - Born in state of residence (%)
Place of birth - Born in state of residence (%) - White
Place of birth - Born in state of residence (%) - Black or African American
Place of birth - Born in state of residence (%) - Asian
Place of birth - Born in state of residence (%) - Hispanic or Latino
Place of birth - Born in state of residence (%) - American Indian and Alaska Native
Place of birth - Born in state of residence (%) - Multirace
Place of birth - Born in state of residence (%) - Other Race
Place of birth - Born in other state (%)
Place of birth - Born in other state (%) - White
Place of birth - Born in other state (%) - Black or African American
Place of birth - Born in other state (%) - Asian
Place of birth - Born in other state (%) - Hispanic or Latino
Place of birth - Born in other state (%) - American Indian and Alaska Native
Place of birth - Born in other state (%) - Multirace
Place of birth - Born in other state (%) - Other Race
Place of birth - Native, outside of US (%)
Place of birth - Native, outside of US (%) - White
Place of birth - Native, outside of US (%) - Black or African American
Place of birth - Native, outside of US (%) - Asian
Place of birth - Native, outside of US (%) - Hispanic or Latino
Place of birth - Native, outside of US (%) - American Indian and Alaska Native
Place of birth - Native, outside of US (%) - Multirace
Place of birth - Native, outside of US (%) - Other Race
Place of birth - Foreign born (%)
Place of birth - Foreign born (%) - White
Place of birth - Foreign born (%) - Black or African American
Place of birth - Foreign born (%) - Asian
Place of birth - Foreign born (%) - Hispanic or Latino
Place of birth - Foreign born (%) - American Indian and Alaska Native
Place of birth - Foreign born (%) - Multirace
Place of birth - Foreign born (%) - Other Race
Residents speaking English at home (%)
Residents speaking English at home - Born in the United States (%)
Residents speaking English at home - Native, born elsewhere (%)
Residents speaking English at home - Foreign born (%)
Residents speaking Spanish at home (%)
Residents speaking Spanish at home - Born in the United States (%)
Residents speaking Spanish at home - Native, born elsewhere (%)
Residents speaking Spanish at home - Foreign born (%)
Residents speaking other language at home (%)
Residents speaking other language at home - Born in the United States (%)
Residents speaking other language at home - Native, born elsewhere (%)
Residents speaking other language at home - Foreign born (%)
Marital status - Never married (%)
Marital status - Now married (%)
Marital status - Separated (%)
Marital status - Widowed (%)
Marital status - Divorced (%)
Ancestries Reported - Arab (%)
Ancestries Reported - Czech (%)
Ancestries Reported - Danish (%)
Ancestries Reported - Dutch (%)
Ancestries Reported - English (%)
Ancestries Reported - French (%)
Ancestries Reported - French Canadian (%)
Ancestries Reported - German (%)
Ancestries Reported - Greek (%)
Ancestries Reported - Hungarian (%)
Ancestries Reported - Irish (%)
Ancestries Reported - Italian (%)
Ancestries Reported - Lithuanian (%)
Ancestries Reported - Norwegian (%)
Ancestries Reported - Polish (%)
Ancestries Reported - Portuguese (%)
Ancestries Reported - Russian (%)
Ancestries Reported - Scotch-Irish (%)
Ancestries Reported - Scottish (%)
Ancestries Reported - Slovak (%)
Ancestries Reported - Subsaharan African (%)
Ancestries Reported - Swedish (%)
Ancestries Reported - Swiss (%)
Ancestries Reported - Ukrainian (%)
Ancestries Reported - United States (%)
Ancestries Reported - Welsh (%)
Ancestries Reported - West Indian (%)
Ancestries Reported - Other (%)
Geographical mobility - Same house 1 year ago (%)
Geographical mobility - Same house 1 year ago (%) - White
Geographical mobility - Same house 1 year ago (%) - Black or African American
Geographical mobility - Same house 1 year ago (%) - Asian
Geographical mobility - Same house 1 year ago (%) - Hispanic or Latino
Geographical mobility - Same house 1 year ago (%) - American Indian and Alaska Native
Geographical mobility - Same house 1 year ago (%) - Multirace
Geographical mobility - Same house 1 year ago (%) - Other Race
Geographical mobility - Moved within same county (%)
Geographical mobility - Moved within same county (%) - White
Geographical mobility - Moved within same county (%) - Black or African American
Geographical mobility - Moved within same county (%) - Asian
Geographical mobility - Moved within same county (%) - Hispanic or Latino
Geographical mobility - Moved within same county (%) - American Indian and Alaska Native
Geographical mobility - Moved within same county (%) - Multirace
Geographical mobility - Moved within same county (%) - Other Race
Geographical mobility - Moved from different county within same state (%)
Geographical mobility - Moved from different county within same state (%) - White
Geographical mobility - Moved from different county within same state (%) - Black or African American
Geographical mobility - Moved from different county within same state (%) - Asian
Geographical mobility - Moved from different county within same state (%) - Hispanic or Latino
Geographical mobility - Moved from different county within same state (%) - American Indian and Alaska Native
Geographical mobility - Moved from different county within same state (%) - Multirace
Geographical mobility - Moved from different county within same state (%) - Other Race
Geographical mobility - Moved from different state (%)
Geographical mobility - Moved from different state (%) - White
Geographical mobility - Moved from different state (%) - Black or African American
Geographical mobility - Moved from different state (%) - Asian
Geographical mobility - Moved from different state (%) - Hispanic or Latino
Geographical mobility - Moved from different state (%) - American Indian and Alaska Native
Geographical mobility - Moved from different state (%) - Multirace
Geographical mobility - Moved from different state (%) - Other Race
Geographical mobility - Moved from abroad (%)
Geographical mobility - Moved from abroad (%) - White
Geographical mobility - Moved from abroad (%) - Black or African American
Geographical mobility - Moved from abroad (%) - Asian
Geographical mobility - Moved from abroad (%) - Hispanic or Latino
Geographical mobility - Moved from abroad (%) - American Indian and Alaska Native
Geographical mobility - Moved from abroad (%) - Multirace
Geographical mobility - Moved from abroad (%) - Other Race
Place of birth for the foreign-born population - Ireland (%)
Place of birth for the foreign-born population - Denmark (%)
Place of birth for the foreign-born population - Norway (%)
Place of birth for the foreign-born population - Sweden (%)
Place of birth for the foreign-born population - United Kingdom (%)
Place of birth for the foreign-born population - England (%)
Place of birth for the foreign-born population - Scotland (%)
Place of birth for the foreign-born population - Other Northern Europe (%)
Place of birth for the foreign-born population - Austria (%)
Place of birth for the foreign-born population - Belgium (%)
Place of birth for the foreign-born population - France (%)
Place of birth for the foreign-born population - Germany (%)
Place of birth for the foreign-born population - Netherlands (%)
Place of birth for the foreign-born population - Switzerland (%)
Place of birth for the foreign-born population - Other Western Europe (%)
Place of birth for the foreign-born population - Greece (%)
Place of birth for the foreign-born population - Italy (%)
Place of birth for the foreign-born population - Portugal (%)
Place of birth for the foreign-born population - Spain (%)
Place of birth for the foreign-born population - Other Southern Europe (%)
Place of birth for the foreign-born population - Albania (%)
Place of birth for the foreign-born population - Belarus (%)
Place of birth for the foreign-born population - Bosnia and Herzegovina (%)
Place of birth for the foreign-born population - Bulgaria (%)
Place of birth for the foreign-born population - Croatia (%)
Place of birth for the foreign-born population - Czechoslovakia (%)
Place of birth for the foreign-born population - Hungary (%)
Place of birth for the foreign-born population - Latvia (%)
Place of birth for the foreign-born population - Lithuania (%)
Place of birth for the foreign-born population - North Macedonia (Macedonia) (%)
Place of birth for the foreign-born population - Moldova (%)
Place of birth for the foreign-born population - Poland (%)
Place of birth for the foreign-born population - Romania (%)
Place of birth for the foreign-born population - Russia (%)
Place of birth for the foreign-born population - Serbia (%)
Place of birth for the foreign-born population - Ukraine (%)
Place of birth for the foreign-born population - Other Eastern Europe (%)
Place of birth for the foreign-born population - China (%)
Place of birth for the foreign-born population - Hong Kong (%)
Place of birth for the foreign-born population - Taiwan (%)
Place of birth for the foreign-born population - Japan (%)
Place of birth for the foreign-born population - Korea (%)
Place of birth for the foreign-born population - Other Eastern Asia (%)
Place of birth for the foreign-born population - Afghanistan (%)
Place of birth for the foreign-born population - Bangladesh (%)
Place of birth for the foreign-born population - India (%)
Place of birth for the foreign-born population - Iran (%)
Place of birth for the foreign-born population - Kazakhstan (%)
Place of birth for the foreign-born population - Nepal (%)
Place of birth for the foreign-born population - Pakistan (%)
Place of birth for the foreign-born population - Sri Lanka (%)
Place of birth for the foreign-born population - Uzbekistan (%)
Place of birth for the foreign-born population - Other South Central Asia (%)
Place of birth for the foreign-born population - Burma (%)
Place of birth for the foreign-born population - Cambodia (%)
Place of birth for the foreign-born population - Indonesia (%)
Place of birth for the foreign-born population - Laos (%)
Place of birth for the foreign-born population - Malaysia (%)
Place of birth for the foreign-born population - Philippines (%)
Place of birth for the foreign-born population - Singapore (%)
Place of birth for the foreign-born population - Thailand (%)
Place of birth for the foreign-born population - Vietnam (%)
Place of birth for the foreign-born population - Other South Eastern Asia (%)
Place of birth for the foreign-born population - Armenia (%)
Place of birth for the foreign-born population - Iraq (%)
Place of birth for the foreign-born population - Israel (%)
Place of birth for the foreign-born population - Jordan (%)
Place of birth for the foreign-born population - Kuwait (%)
Place of birth for the foreign-born population - Lebanon (%)
Place of birth for the foreign-born population - Saudi Arabia (%)
Place of birth for the foreign-born population - Syria (%)
Place of birth for the foreign-born population - Turkey (%)
Place of birth for the foreign-born population - Yemen (%)
Place of birth for the foreign-born population - Other Western Asia (%)
Place of birth for the foreign-born population - Eritrea (%)
Place of birth for the foreign-born population - Ethiopia (%)
Place of birth for the foreign-born population - Kenya (%)
Place of birth for the foreign-born population - Somalia (%)
Place of birth for the foreign-born population - Uganda (%)
Place of birth for the foreign-born population - Zimbabwe (%)
Place of birth for the foreign-born population - Other Eastern Africa (%)
Place of birth for the foreign-born population - Cameroon (%)
Place of birth for the foreign-born population - Congo (%)
Place of birth for the foreign-born population - Democratic Republic of Congo (Zaire) (%)
Place of birth for the foreign-born population - Other Middle Africa (%)
Place of birth for the foreign-born population - Egypt (%)
Place of birth for the foreign-born population - Morocco (%)
Place of birth for the foreign-born population - Sudan (%)
Place of birth for the foreign-born population - Other Northern Africa (%)
Place of birth for the foreign-born population - South Africa (%)
Place of birth for the foreign-born population - Other Southern Africa (%)
Place of birth for the foreign-born population - Cabo Verde (%)
Place of birth for the foreign-born population - Ghana (%)
Place of birth for the foreign-born population - Liberia (%)
Place of birth for the foreign-born population - Nigeria (%)
Place of birth for the foreign-born population - Senegal (%)
Place of birth for the foreign-born population - Sierra Leone (%)
Place of birth for the foreign-born population - Other Western Africa (%)
Place of birth for the foreign-born population - Australia (%)
Place of birth for the foreign-born population - New Zealand (%)
Place of birth for the foreign-born population - Fiji (%)
Place of birth for the foreign-born population - Micronesia (%)
Place of birth for the foreign-born population - Bahamas (%)
Place of birth for the foreign-born population - Barbados (%)
Place of birth for the foreign-born population - Cuba (%)
Place of birth for the foreign-born population - Dominica (%)
Place of birth for the foreign-born population - Dominican Republic (%)
Place of birth for the foreign-born population - Grenada (%)
Place of birth for the foreign-born population - Haiti (%)
Place of birth for the foreign-born population - Jamaica (%)
Place of birth for the foreign-born population - St. Vincent and the Grenadines (%)
Place of birth for the foreign-born population - Trinidad and Tobago (%)
Place of birth for the foreign-born population - West Indies (%)
Place of birth for the foreign-born population - Other Caribbean (%)
Place of birth for the foreign-born population - Belize (%)
Place of birth for the foreign-born population - Costa Rica (%)
Place of birth for the foreign-born population - El Salvador (%)
Place of birth for the foreign-born population - Guatemala (%)
Place of birth for the foreign-born population - Honduras (%)
Place of birth for the foreign-born population - Mexico (%)
Place of birth for the foreign-born population - Nicaragua (%)
Place of birth for the foreign-born population - Panama (%)
Place of birth for the foreign-born population - Other Central America (%)
Place of birth for the foreign-born population - Argentina (%)
Place of birth for the foreign-born population - Bolivia (%)
Place of birth for the foreign-born population - Brazil (%)
Place of birth for the foreign-born population - Chile (%)
Place of birth for the foreign-born population - Colombia (%)
Place of birth for the foreign-born population - Ecuador (%)
Place of birth for the foreign-born population - Guyana (%)
Place of birth for the foreign-born population - Peru (%)
Place of birth for the foreign-born population - Uruguay (%)
Place of birth for the foreign-born population - Venezuela (%)
Place of birth for the foreign-born population - Other South America (%)
Place of birth for the foreign-born population - Canada (%)
Place of birth for the foreign-born population - Other Northern America (%)
Place of birth for the foreign-born population - Other (%)
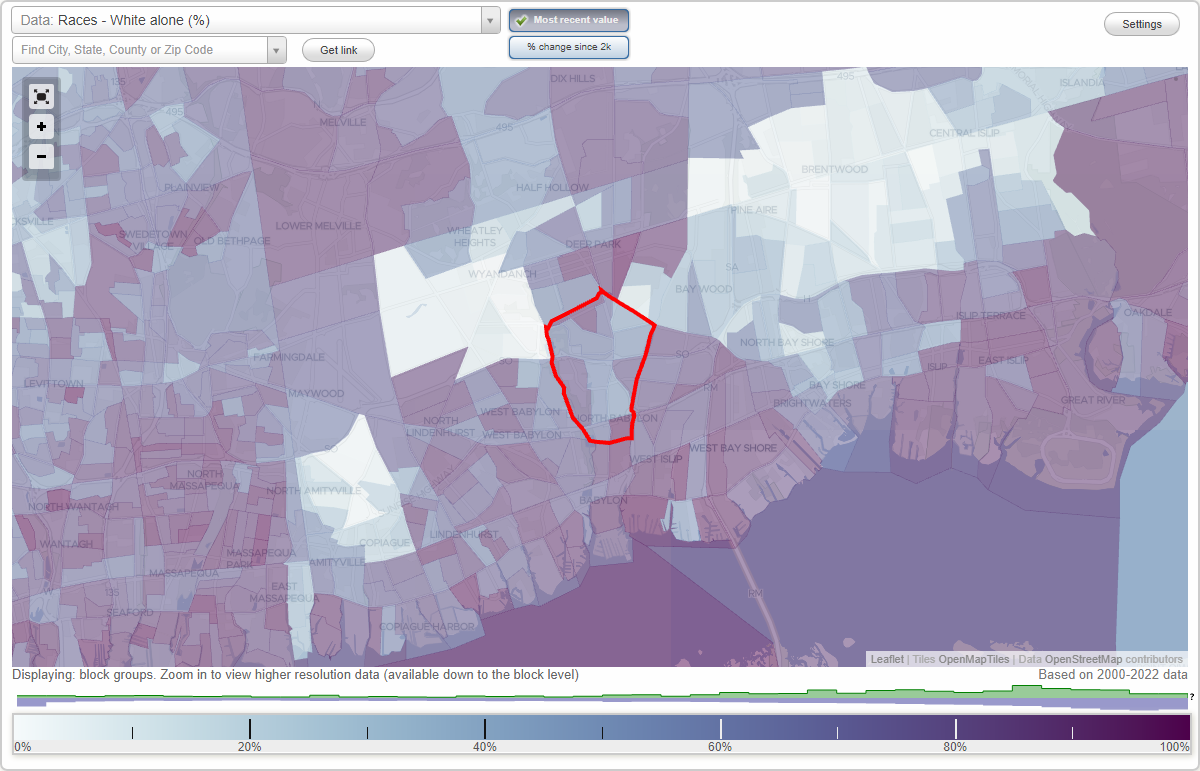
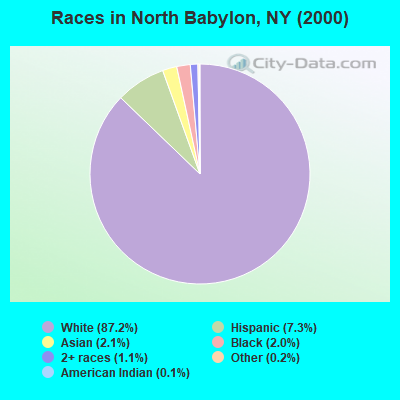
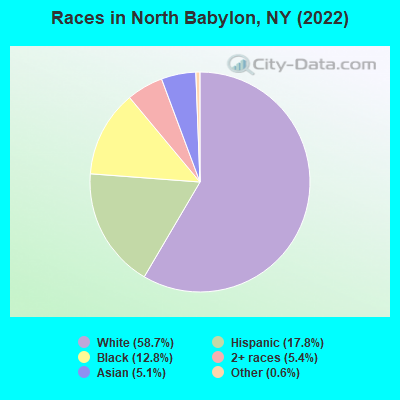
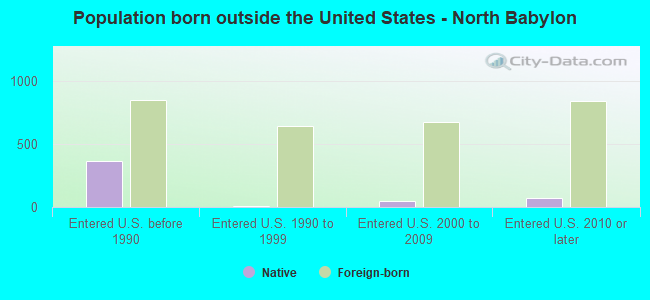
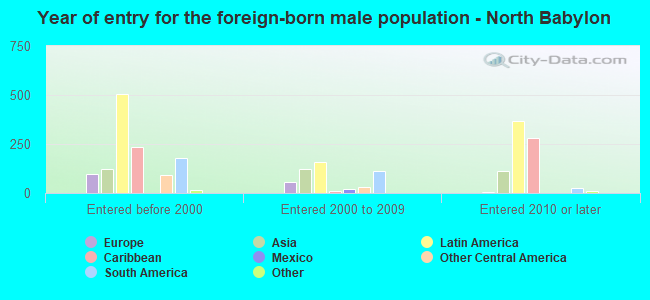
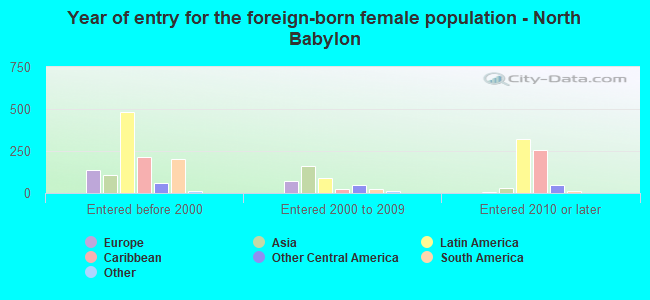
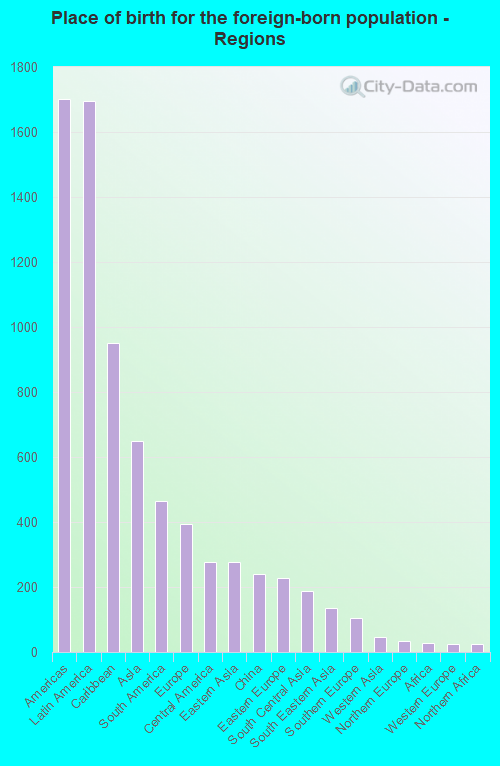
According to 2022 data, the most numerous races in North Babylon, NY are White alone (10,799 residents), Hispanic (3,280 residents), and Black alone (2,357 residents). 75.1% of North Babylon residents speak English at home. 15.1% of North Babylon, NY residents are foreign-born (9.3% born in Latin America, 3.6% born in Asia, 2.2% born in Europe), which is 45.8% less than the foreign-born rate of 22.0% across the entire state of New York.
Race distribution in North Babylon
2000 2022
11,760,981 62.0% White alone 2,867,583 15.1% Hispanic 2,812,623 14.8% Black alone 1,035,926 5.5% Asian alone 366,116 1.9% Two or more races 75,499 0.4% Other race alone 52,499 0.3% American Indian alone 5,230 0.03% Native Hawaiian and Other
10,408,933 52.9% White alone 3,867,299 19.7% Hispanic 2,633,840 13.4% Black alone 1,776,286 9.0% Asian alone 732,670 3.7% Two or more races 216,110 1.1% Other race alone 35,082 0.2% American Indian alone 6,931 0.04% Native Hawaiian and Other
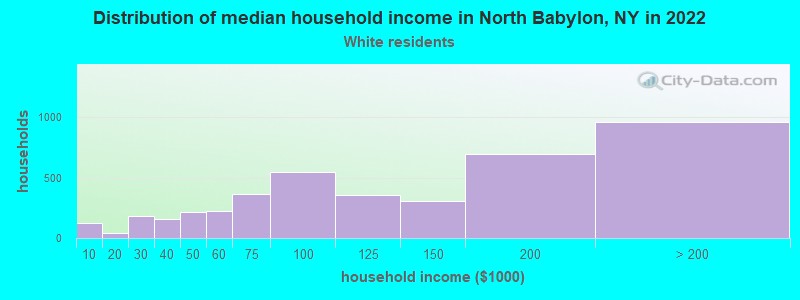
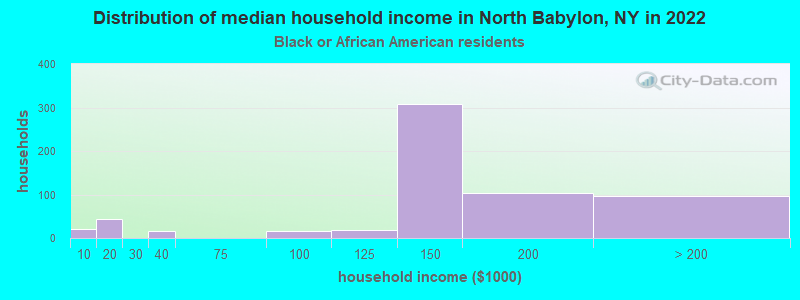
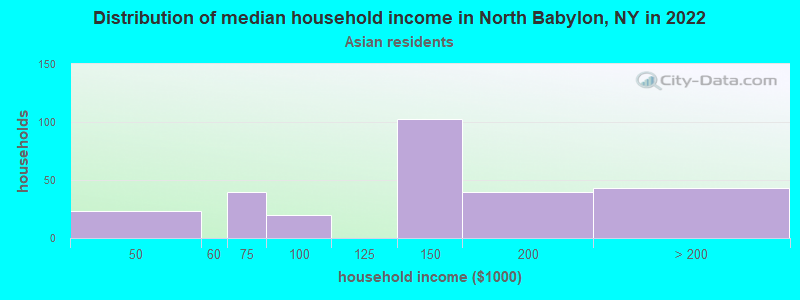
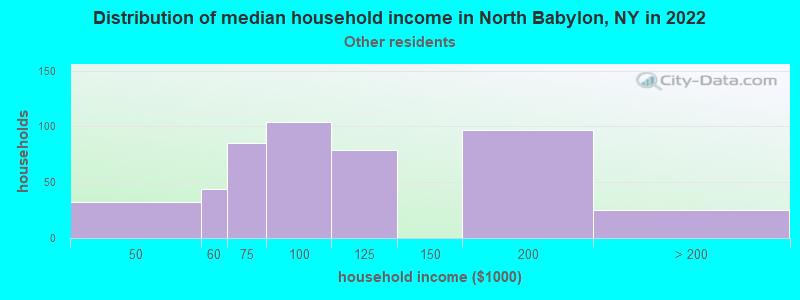
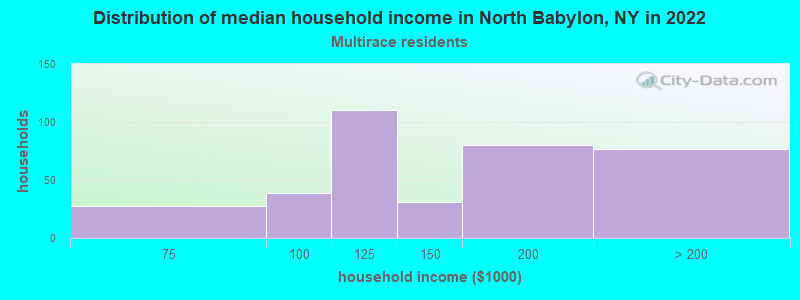
Income and house value in North Babylon Median household income in 2022 $118,692 White non-Hispanic householders$136,658 Black householders$141,803 Asian householders$84,031 Some other race householders$141,045 Two or more races householders$91,354 Hispanic or Latino race householdersMedian 2022 house value $498,429 White Non-Hispanic householders$509,195 Black or African American householders $454,784 Asian householdersover $1,000,000 Native Hawaiian and other Pacific Islander householders$498,429 Some other race householders$615,107 Two or more races householders$500,466 Hispanic or Latino householders
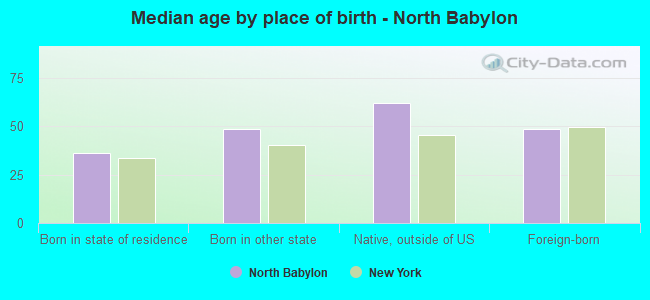
Median age by race in North Babylon
51.5 Median age for White residents50.6 53.0 23.3 Median age for Black or African American residents19.2 29.5 34.4 Median age for American Indian / Alaska Native residents43.9 23.2 43.7 Median age for Asian residents42.1 45.9 -742,816,091.2 Median age for Native Hawaiian / Pacific Islander residents-831,187,409.8 -771,300,447.7 34.4 Median age for Other race residents33.9 35.4 27.3 Median age for Two or more races residents24.4 37.7 51.5 Median age for White alone residents51.0 52.3 35.2 Median age for Hispanic or Latino residents35.6 34.7
Owner/renter occupied households by race in North Babylon
House owners and renters - White residents 3,598 86.6% Owner occupied556 13.4% Renter occupiedHouse owners and renters - Black or African American residents 453 78.3% Owner occupied126 21.7% Renter occupiedHouse owners and renters - American Indian / Alaska Native residents 8 100.0% Owner occupiedHouse owners and renters - Asian residents 260 98.4% Owner occupied4 1.6% Renter occupiedHouse owners and renters - Native Hawaiian / Pacific Islander residents 7 100.0% Owner occupiedHouse owners and renters - Other race residents 298 62.9% Owner occupied176 37.1% Renter occupiedHouse owners and renters - Two or more races residents 294 85.6% Owner occupied49 14.4% Renter occupiedHouse owners and renters - White alone residents 3,518 87.2% Owner occupied516 12.8% Renter occupiedHouse owners and renters - Hispanic or Latino residents 545 70.0% Owner occupied233 30.0% Renter occupied
Language usage in North Babylon
English speakers - Total 75.1% of residents of North Babylon speak English at home.
10.7% of residents speak Spanish at home 1,225 65.0% Speak English very well660 35.0% Speak English less than very well14.0% of residents speak other language at home 1,411 57.5% Speak English very well1,043 42.5% Speak English less than very well
English speakers - Born in the United States 99.7% of residents of North Babylon speak English at home.
1.0% of residents speak other language at home 8 100.0% Speak English very well
English speakers - Native, born elsewhere 27.5% of residents of North Babylon speak English at home.
51.4% of residents speak Spanish at home 245 93.2% Speak English very well18 6.8% Speak English less than very well24.0% of residents speak other language at home 114 92.7% Speak English very well9 7.3% Speak English less than very well
English speakers - Foreign-born 16.4% of residents of North Babylon speak English at home.
29.4% of residents speak Spanish at home 424 48.2% Speak English very well456 51.8% Speak English less than very well52.0% of residents speak other language at home 776 49.8% Speak English very well783 50.2% Speak English less than very well
White (Caucasian) - Speak only English Native:
94.4% (9,733)Foreign-born:
22.9% (122)
White (Caucasian) - Speak another language Native:
5.5% (563)Foreign-born:
75.1% (401)
Black or African American - Speak only English Native:
80.3% (1,346)Foreign-born:
25.5% (187)
Black or African American - Speak another language Native:
22.4% (375)Foreign-born:
68.8% (504)
American Indian / Alaska Native - Speak another language Native:
54.4% (30)Foreign-born:
100.0% (19)
Asian - Speak only English Native:
69.4% (278)Foreign-born:
8.5% (49)
Asian - Speak another language Native:
26.2% (105)Foreign-born:
93.6% (543)
Other race - Speak only English Native:
39.2% (405)Foreign-born:
4.0% (26)
Other race - Speak another language Native:
60.8% (630)Foreign-born:
96.8% (627)
Two or more races - Speak only English Native:
86.9% (1,008)Foreign-born:
28.4% (129)
Two or more races - Speak another language Native:
13.9% (161)Foreign-born:
69.4% (316)
White alone - Speak only English Native:
94.7% (9,529)Foreign-born:
22.1% (106)
White alone - Speak another language Native:
5.4% (547)Foreign-born:
77.9% (372)
Hispanic or Latino - Speak only English Native:
55.3% (1,059)Foreign-born:
8.8% (82)
Hispanic or Latino - Speak another language Native:
45.1% (865)Foreign-born:
91.0% (855)
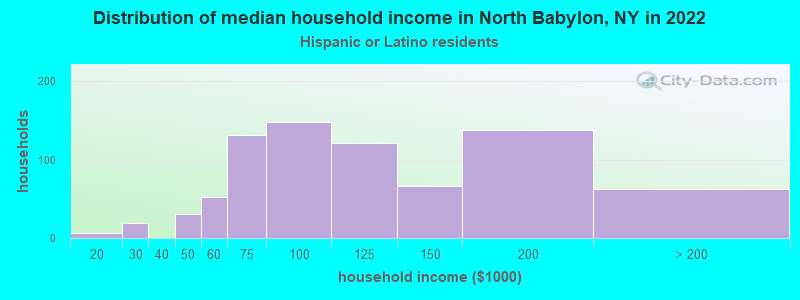
Foreign-born residents in North Babylon 2,778 residents are foreign born (9.3% Latin America , 3.6% Asia , 2.2% Europe ).
This city:
15.1%New York:
22.6%
Marital status for residents in North Babylon Marital status - White (Caucasian) population 15 years and over
Males 33.9% Never married53.5% Now married0.4% Separated4.3% Widowed7.9% DivorcedFemales 28.8% Never married50.4% Now married1.3% Separated9.9% Widowed9.5% DivorcedWomen who gave birth in the past 12 months Now married:
68.9% (44)Unmarried:
31.1% (20)
Women who did not give birth in the past 12 months Now married:
37.1% (732)Unmarried:
62.9% (1,241)
Marital status - Black or African American population 15 years and over
Males 36.0% Never married61.7% Now married0.0% Separated1.3% Widowed1.0% DivorcedFemales 43.3% Never married48.4% Now married2.0% Separated0.0% Widowed6.3% DivorcedWomen who gave birth in the past 12 months Now married:
41.0% (16)Unmarried:
59.0% (23)
Women who did not give birth in the past 12 months Now married:
48.0% (291)Unmarried:
52.0% (316)
Marital status - American Indian / Alaska Native population 15 years and over
Males 0.0% Never married100.0% Now married0.0% Separated0.0% Widowed0.0% DivorcedFemales 56.3% Never married43.8% Now married0.0% Separated0.0% Widowed0.0% DivorcedWomen who gave birth in the past 12 months Now married:
0.0% (0)Unmarried:
100.0% (13)
Marital status - Asian population 15 years and over
Males 20.9% Never married64.5% Now married0.0% Separated1.8% Widowed12.8% DivorcedFemales 30.2% Never married61.8% Now married0.0% Separated3.2% Widowed4.8% DivorcedWomen who gave birth in the past 12 months Now married:
100.0% (46)Unmarried:
0.0% (0)
Women who did not give birth in the past 12 months Now married:
55.7% (148)Unmarried:
44.3% (118)
Marital status - Native Hawaiian / Pacific Islander population 15 years and over
Males 0.0% Never married100.0% Now married0.0% Separated0.0% Widowed0.0% DivorcedFemales 100.0% Never married0.0% Now married0.0% Separated0.0% Widowed0.0% DivorcedMarital status - Other race population 15 years and over
Males 20.5% Never married68.8% Now married0.0% Separated8.0% Widowed2.6% DivorcedFemales 19.6% Never married73.7% Now married0.0% Separated4.3% Widowed2.4% DivorcedWomen who gave birth in the past 12 months Now married:
100.0% (54)Unmarried:
0.0% (0)
Women who did not give birth in the past 12 months Now married:
55.6% (197)Unmarried:
44.4% (158)
Marital status - Two or more races population 15 years and over
Males 49.7% Never married44.2% Now married0.0% Separated0.0% Widowed6.2% DivorcedFemales 32.4% Never married44.8% Now married6.6% Separated8.8% Widowed7.4% DivorcedWomen who did not give birth in the past 12 months Now married:
44.1% (138)Unmarried:
55.9% (174)
Marital status - White alone, not Hispanic / Latino population 15 years and over
Males 33.1% Never married54.5% Now married0.4% Separated4.1% Widowed7.9% DivorcedFemales 28.5% Never married51.2% Now married0.7% Separated9.6% Widowed10.0% DivorcedWomen who gave birth in the past 12 months Now married:
100.0% (34)Unmarried:
0.0% (0)
Women who did not give birth in the past 12 months Now married:
36.5% (733)Unmarried:
63.5% (1,274)
Marital status - Hispanic or Latino population 15 years and over
Males 31.4% Never married55.1% Now married0.0% Separated5.8% Widowed7.7% DivorcedFemales 35.5% Never married49.2% Now married4.6% Separated7.4% Widowed3.3% DivorcedWomen who gave birth in the past 12 months Now married:
61.9% (54)Unmarried:
38.1% (33)
Women who did not give birth in the past 12 months Now married:
33.3% (173)Unmarried:
66.7% (347)
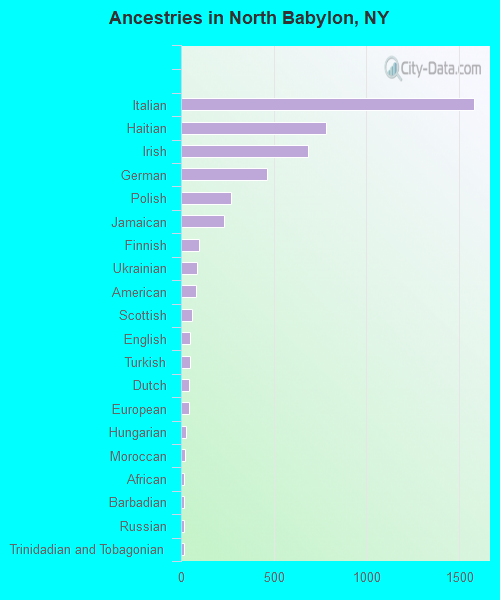
Ancestries in North Babylon
1,582 22.2% Italian781 10.9% Haitian686 9.6% Irish463 6.5% German270 3.8% Polish232 3.3% Jamaican95 1.3% Finnish84 1.2% Ukrainian80 1.1% American59 0.8% Scottish49 0.7% English46 0.6% Turkish44 0.6% Dutch42 0.6% European25 0.4% Hungarian22 0.3% Moroccan18 0.3% African18 0.3% Barbadian17 0.2% Russian16 0.2% Trinidadian and Tobagonian12 0.2% Albanian12 0.2% Brazilian12 0.2% Greek12 0.2% Slovak11 0.2% Scotch-Irish10 0.1% Lebanese9 0.1% Norwegian7 0.10% British6 0.08% Czech6 0.08% Eastern European
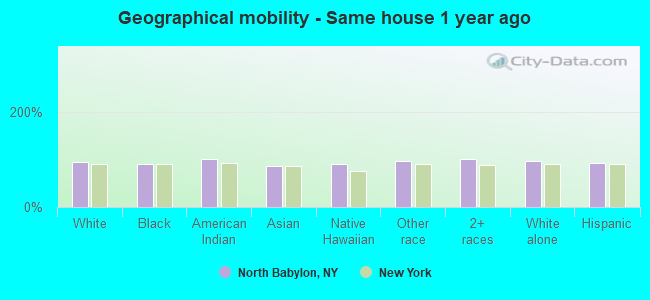
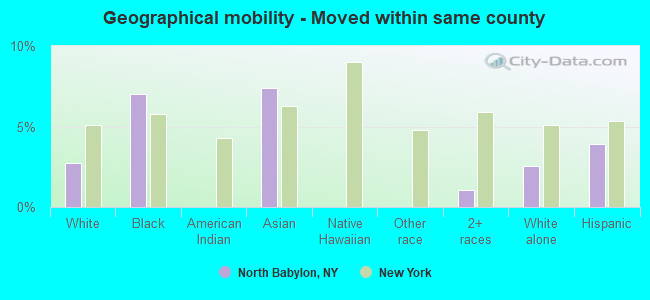
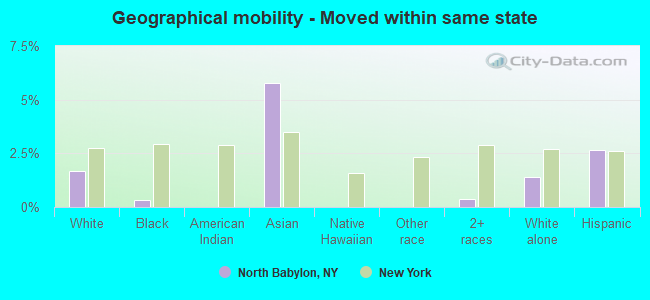
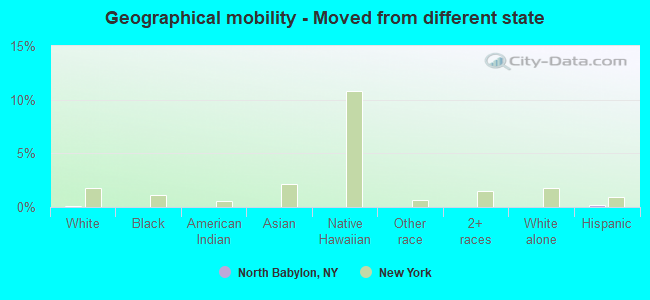
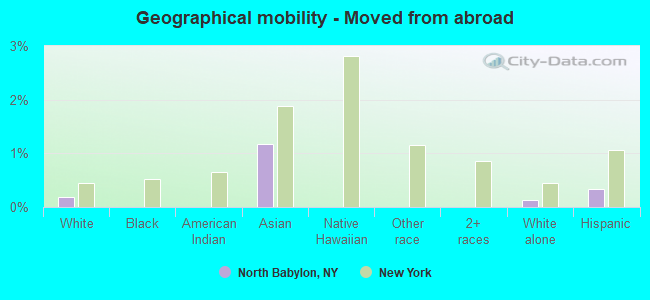
Geographical mobility in North Babylon Same house 1 year ago 10,486 95.5% White (Caucasian)2,254 90.8% Black or African American86 100.0% American Indian / Alaska Native875 85.7% Asian10 89.7% Native Hawaiian / Pacific Islander1,838 97.3% Other race1,783 99.6% Two or more races10,315 96.0% White alone, not Hispanic / Latino2,954 92.7% Hispanic or LatinoMoved within same county 300 2.7% White / Caucasian175 7.0% Black or African American75 7.4% Asian19 1.1% Two or more races274 2.5% White alone, not Hispanic / Latino125 3.9% Hispanic or LatinoMoved within same state 182 1.7% White / Caucasian8 0.3% Black or African American59 5.8% Asian6 0.4% Two or more races148 1.4% White alone, not Hispanic / Latino84 2.6% Hispanic or LatinoMoved from different state 9 0.1% White / Caucasian6 0.2% Hispanic or LatinoMoved from abroad 21 0.2% White12 1.2% Asian14 0.1% White alone, not Hispanic / Latino11 0.3% Hispanic or Latino
Children Nativity (place of birth) in North Babylon
Children under 6 years - Living with two parents Both parents native 310 100.0% NativeBoth parents foreign-born 319 100.0% NativeOne native, one foreign-born parent 183 100.0% NativeChildren under 6 years - Living with one parent Native parent 336 99.7% Native1 0.3% Foreign-bornForeign-born parent 50 85.9% Native8 14.1% Foreign-bornChildren 6 to 17 years - Living with two parents Both parents native 704 97.3% Native19 2.7% Foreign-bornBoth parents foreign-born 675 96.2% Native26 3.8% Foreign-bornOne native, one foreign-born parent 262 100.0% NativeChildren 6 to 17 years - Living with one parent Native parent 420 100.0% NativeForeign-born parent 49 61.1% Native31 38.9% Foreign-born
Grandparents responsible for own grandchildren in North Babylon
Grandparents (30 to 59 years) White / Caucasian 40 34.6% Responsible for grandchildren75 65.4% Not responsible for grandchildrenBlack or African American 24 100.0% Not responsible for grandchildrenAsian 31 100.0% Not responsible for grandchildrenTwo or more races 34 100.0% Not responsible for grandchildrenWhite alone, not Hispanic / Latino 39 31.1% Responsible for grandchildren86 68.9% Not responsible for grandchildrenHispanic or Latino 14 100.0% Not responsible for grandchildrenGrandparents (60 years and over) White / Caucasian 19 11.4% Responsible for grandchildren151 88.6% Not responsible for grandchildrenBlack or African American 24 100.0% Not responsible for grandchildrenAsian 33 100.0% Not responsible for grandchildrenTwo or more races 30 54.8% Responsible for grandchildren25 45.2% Not responsible for grandchildrenWhite alone, not Hispanic / Latino 16 9.3% Responsible for grandchildren156 90.7% Not responsible for grandchildrenHispanic or Latino 21 56.7% Responsible for grandchildren16 43.3% Not responsible for grandchildren