Estimated zip code population in 2022: 17,137 Zip code population in 2010: 16,415 Zip code population in 2000: 16,336
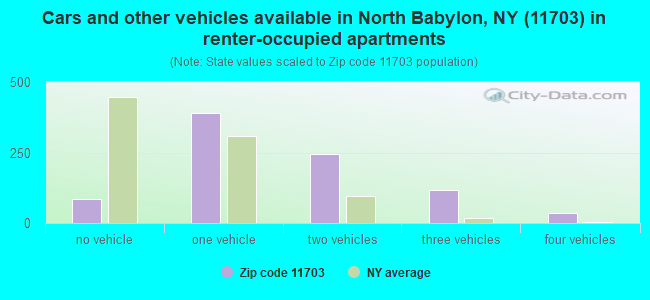
Houses and condos: 5,823 Renter-occupied apartments: 875
% of renters here:
16%
State:
46%
March 2022 cost of living index in zip code 11703: 148.4 (very high, U.S. average is 100)
Land area: 3.1 sq. mi. Water area: 0.0 sq. mi.
Population density: 5,503 people per square mile
(average).
OSM Map
General Map
Google Map
MSN Map
OSM Map
General Map
Google Map
MSN Map
OSM Map
General Map
Google Map
MSN Map
OSM Map
General Map
Google Map
MSN Map
Please wait while loading the map...
Real estate property taxes paid for housing units in 2022:
This zip code:
2.1% ($9,805)
New York:
1.5% ($6,180)
Median real estate property taxes paid for housing units with mortgages in 2022: $9,858 (2.0%) Median real estate property taxes paid for housing units with no mortgage in 2022: $9,755 (2.2%)
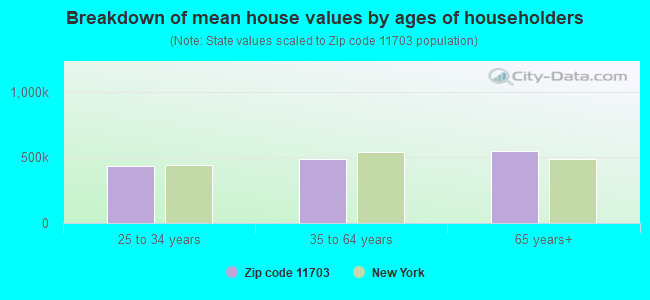
Estimated median house/condo value in 2022: $467,637
11703:
$467,637
New York:
$400,400
According to our research of New York and other state lists, there was 1 registered sex offender living in 11703 zip code as of April 27, 2024. The ratio of all residents to sex offenders in zip code 11703 is 16,744 to 1. The ratio of registered sex offenders to all residents in this zip code is much lower than the state average.
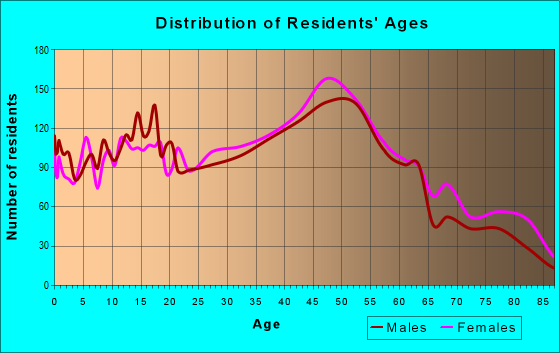
Median resident age:
This zip code:
43.2 years
New York median age:
40.0 years
Average household size:
This zip code:
3.0 people
New York:
2.5 people
Averages for the 2020 tax year for zip code 11703, filed in 2021:
Average Adjusted Gross Income (AGI) in 2020: $71,987 (Individual Income Tax Returns)
Here:
$71,987
State:
$90,930
Salary/wage: $65,564 (reported on 84.0% of returns)
Here:
$65,564
State:
$72,104
(% of AGI for various income ranges: 1110.7% for AGIs below $25k, 3568.7% for AGIs $25k-50k, 6545.5% for AGIs $50k-75k, 9604.2% for AGIs $75k-100k, 17953.6% for AGIs $100k-200k, 49022.9% for AGIs over 200k)
Taxable interest for individuals: $755 (reported on 42.4% of returns)
This zip code:
$755
New York:
$3,075
(% of AGI for various income ranges: 23.3% for AGIs below $25k, 23.0% for AGIs $25k-50k, 35.5% for AGIs $50k-75k, 63.6% for AGIs $75k-100k, 92.1% for AGIs $100k-200k, 173.5% for AGIs over 200k)
Ordinary dividends: $2,626 (reported on 19.9% of returns)
Here:
$2,626
State:
$11,095
(% of AGI for various income ranges: 30.8% for AGIs below $25k, 36.6% for AGIs $25k-50k, 70.1% for AGIs $50k-75k, 70.7% for AGIs $75k-100k, 151.2% for AGIs $100k-200k, 424.1% for AGIs over 200k)
Net capital gain/loss in AGI: +$4,961 (reported on 17.6% of returns)
Here:
+$4,961
State:
+$44,925
(% of AGI for various income ranges: 6.9% for AGIs below $25k, 26.7% for AGIs $25k-50k, 71.7% for AGIs $50k-75k, 101.9% for AGIs $75k-100k, 230.3% for AGIs $100k-200k, 2039.4% for AGIs over 200k)
Profit/loss from business: +$8,520 (reported on 13.0% of returns)
Here:
+$8,520
State:
+$14,940
(% of AGI for various income ranges: 101.6% for AGIs below $25k, 83.3% for AGIs $25k-50k, 60.3% for AGIs $50k-75k, 79.0% for AGIs $75k-100k, 303.6% for AGIs $100k-200k, 1632.9% for AGIs over 200k)
Taxable individual retirement arrangement distribution: $16,070 (reported on 9.0% of returns)
11703:
$16,070
New York:
$19,609
(% of AGI for various income ranges: 62.0% for AGIs below $25k, 92.3% for AGIs $25k-50k, 155.9% for AGIs $50k-75k, 281.4% for AGIs $75k-100k, 427.5% for AGIs $100k-200k, 1311.2% for AGIs over 200k)
Total itemized deductions: $25,266 (reported on 17.4% of returns)
Here:
$25,266
State:
$39,326
(% of AGI for various income ranges: 111.1% for AGIs below $25k, 293.0% for AGIs $25k-50k, 580.0% for AGIs $50k-75k, 916.8% for AGIs $75k-100k, 1442.9% for AGIs $100k-200k, 2464.1% for AGIs over 200k)
Charity contributions: $3,797 (reported on 14.6% of returns)
Here:
$3,797
State:
$15,420
(% of AGI for various income ranges: 5.3% for AGIs below $25k, 21.0% for AGIs $25k-50k, 49.5% for AGIs $50k-75k, 99.5% for AGIs $75k-100k, 215.1% for AGIs $100k-200k, 547.1% for AGIs over 200k)
Taxes paid: $9,552 (reported on 17.4% of returns)
11703:
$9,552
State:
$9,183
(% of AGI for various income ranges: 37.0% for AGIs below $25k, 109.3% for AGIs $25k-50k, 233.7% for AGIs $50k-75k, 349.8% for AGIs $75k-100k, 554.3% for AGIs $100k-200k, 805.9% for AGIs over 200k)
Earned income credit: $1,769 (reported on 8.6% of returns)
Here:
$1,769
State:
$2,138
(% of AGI for various income ranges: 51.3% for AGIs below $25k, 41.4% for AGIs $25k-50k)
Percentage of individuals using paid preparers for their 2020 taxes: 95.3%
Here:
95%
State:
95%
(% for various income ranges: 94.1% for AGIs below $25k, 95.6% for AGIs $25k-50k, 95.3% for AGIs $50k-75k, 95.7% for AGIs $75k-100k, 96.1% for AGIs $100k-200k, 95.1% for AGIs over 200k)
Averages for the 2012 tax year for zip code 11703, filed in 2013:
Average Adjusted Gross Income (AGI) in 2012: $60,719 (Individual Income Tax Returns)
Here:
$60,719
State:
$77,088
Salary/wage: $57,526 (reported on 84.5% of returns)
Here:
$57,526
State:
$60,593
(% of AGI for various income ranges: 67.4% for AGIs below $25k, 79.0% for AGIs $25k-50k, 80.3% for AGIs $50k-75k, 81.4% for AGIs $75k-100k, 83.3% for AGIs $100k-200k, 73.5% for AGIs over 200k)
Taxable interest for individuals: $718 (reported on 48.0% of returns)
This zip code:
$718
New York:
$3,125
(% of AGI for various income ranges: 1.4% for AGIs below $25k, 0.6% for AGIs $25k-50k, 0.6% for AGIs $50k-75k, 0.6% for AGIs $75k-100k, 0.4% for AGIs $100k-200k, 0.4% for AGIs over 200k)
Ordinary dividends: $2,058 (reported on 21.7% of returns)
Here:
$2,058
State:
$10,299
(% of AGI for various income ranges: 1.9% for AGIs below $25k, 0.7% for AGIs $25k-50k, 0.9% for AGIs $50k-75k, 0.8% for AGIs $75k-100k, 0.5% for AGIs $100k-200k, 0.5% for AGIs over 200k)
Net capital gain/loss in AGI: +$1,500 (reported on 15.5% of returns)
Here:
+$1,500
State:
+$42,474
(% of AGI for various income ranges: 0.1% for AGIs $50k-75k, 0.4% for AGIs $100k-200k, 2.7% for AGIs over 200k)
Profit/loss from business: +$9,292 (reported on 11.3% of returns)
Here:
+$9,292
State:
+$16,168
(% of AGI for various income ranges: 7.8% for AGIs below $25k, 2.5% for AGIs $25k-50k, 1.2% for AGIs $50k-75k, 0.6% for AGIs $75k-100k, 1.1% for AGIs $100k-200k, 1.9% for AGIs over 200k)
Taxable individual retirement arrangement distribution: $11,627 (reported on 10.2% of returns)
11703:
$11,627
New York:
$17,621
(% of AGI for various income ranges: 3.8% for AGIs below $25k, 2.4% for AGIs $25k-50k, 2.3% for AGIs $50k-75k, 2.1% for AGIs $75k-100k, 1.5% for AGIs $100k-200k, 1.2% for AGIs over 200k)
Self-employment retirement plans: $10,000 (reported on 0.3% of returns)
11703:
$10,000
New York:
$27,330
Total itemized deductions: $24,700 (27% of AGI, reported on 49.7% of returns)
Here:
$24,700
State:
$34,985
Here:
27.0% of AGI
State:
21.3% of AGI
(% of AGI for various income ranges: 15.5% for AGIs below $25k, 17.7% for AGIs $25k-50k, 20.9% for AGIs $50k-75k, 22.9% for AGIs $75k-100k, 21.2% for AGIs $100k-200k, 16.3% for AGIs over 200k)
Charity contributions: $2,221 (reported on 44.9% of returns)
Here:
$2,221
State:
$5,572
(% of AGI for various income ranges: 0.9% for AGIs below $25k, 1.3% for AGIs $25k-50k, 1.7% for AGIs $50k-75k, 1.9% for AGIs $75k-100k, 1.8% for AGIs $100k-200k, 1.3% for AGIs over 200k)
Taxes paid: $11,574 (reported on 49.7% of returns)
11703:
$11,574
State:
$18,656
(% of AGI for various income ranges: 6.3% for AGIs below $25k, 7.0% for AGIs $25k-50k, 9.2% for AGIs $50k-75k, 10.5% for AGIs $75k-100k, 10.5% for AGIs $100k-200k, 9.3% for AGIs over 200k)
Earned income credit: $1,995 (reported on 10.1% of returns)
Here:
$1,995
State:
$2,230
(% of AGI for various income ranges: 4.0% for AGIs below $25k, 0.7% for AGIs $25k-50k)
Percentage of individuals using paid preparers for their 2012 taxes: 69.0%
Here:
69%
State:
66%
(% for various income ranges: 61.2% for AGIs below $25k, 66.8% for AGIs $25k-50k, 72.7% for AGIs $50k-75k, 75.0% for AGIs $75k-100k, 76.9% for AGIs $100k-200k, 77.8% for AGIs over 200k)
Averages for the 2004 tax year for zip code 11703, filed in 2005:
Average Adjusted Gross Income (AGI) in 2004: $50,041 (Individual Income Tax Returns)
Here:
$50,041
State:
$59,519
Salary/wage: $47,939 (reported on 86.4% of returns)
Here:
$47,939
State:
$50,673
(% of AGI for various income ranges: 88.8% for AGIs below $10k, 72.2% for AGIs $10k-25k, 82.6% for AGIs $25k-50k, 84.2% for AGIs $50k-75k, 85.0% for AGIs $75k-100k, 82.5% for AGIs over 100k)
Taxable interest for individuals: $950 (reported on 60.1% of returns)
This zip code:
$950
New York:
$2,377
(% of AGI for various income ranges: 5.2% for AGIs below $10k, 2.5% for AGIs $10k-25k, 1.2% for AGIs $25k-50k, 1.1% for AGIs $50k-75k, 1.0% for AGIs $75k-100k, 0.8% for AGIs over 100k)
Taxable dividends: $1,556 (reported on 26.5% of returns)
Here:
$1,556
State:
$5,394
(% of AGI for various income ranges: 3.3% for AGIs below $10k, 1.4% for AGIs $10k-25k, 0.7% for AGIs $25k-50k, 0.7% for AGIs $50k-75k, 0.6% for AGIs $75k-100k, 0.9% for AGIs over 100k)
Net capital gain/loss: +$1,830 (reported on 19.7% of returns)
Here:
+$1,830
State:
+$23,581
(% of AGI for various income ranges: -2.5% for AGIs below $10k, -0.1% for AGIs $10k-25k, -0.1% for AGIs $25k-50k, 0.1% for AGIs $50k-75k, 0.3% for AGIs $75k-100k, 2.2% for AGIs over 100k)
Profit/loss from business: +$9,454 (reported on 10.9% of returns)
Here:
+$9,454
State:
+$13,809
(% of AGI for various income ranges: 9.9% for AGIs below $10k, 5.9% for AGIs $10k-25k, 2.1% for AGIs $25k-50k, 1.2% for AGIs $50k-75k, 1.5% for AGIs $75k-100k, 1.9% for AGIs over 100k)
IRA payment deduction: $3,147 (reported on 3.1% of returns)
11703:
$3,147
New York:
$3,115
(% of AGI for various income ranges: 0.3% for AGIs below $10k, 0.2% for AGIs $10k-25k, 0.3% for AGIs $25k-50k, 0.2% for AGIs $50k-75k, 0.2% for AGIs $75k-100k, 0.1% for AGIs over 100k)
Self-employed pension: $9,333 (reported on 0.3% of returns)
Here:
$9,333
New York:
$19,016
Total itemized deductions: $20,666 (28% of AGI, reported on 53.2% of returns)
Here:
$20,666
State:
$25,864
Here:
28.4% of AGI
State:
21.9% of AGI
(% of AGI for various income ranges: 12.7% for AGIs below $10k, 19.7% for AGIs $10k-25k, 21.0% for AGIs $25k-50k, 25.1% for AGIs $50k-75k, 24.4% for AGIs $75k-100k, 19.7% for AGIs over 100k)
Charity contributions deductions: $2,408 (3% of AGI, reported on 50.2% of returns)
Here:
$2,408
State:
$4,439
Here:
3.2% of AGI
State:
3.6% of AGI
(% of AGI for various income ranges: 0.7% for AGIs below $10k, 1.6% for AGIs $10k-25k, 2.3% for AGIs $25k-50k, 2.7% for AGIs $50k-75k, 2.7% for AGIs $75k-100k, 2.3% for AGIs over 100k)
Total tax: $6,305 (reported on 79.4% of returns)
11703:
$6,305
State:
$11,730
(% of AGI for various income ranges: 2.6% for AGIs below $10k, 4.1% for AGIs $10k-25k, 6.9% for AGIs $25k-50k, 8.5% for AGIs $50k-75k, 9.3% for AGIs $75k-100k, 14.8% for AGIs over 100k)
Earned income credit: $1,521 (reported on 9.2% of returns)
Here:
$1,521
State:
$1,757
Percentage of individuals using paid preparers for their 2004 taxes: 70.0%
Here:
70%
State:
67%
(% for various income ranges: 61.1% for AGIs below $10k, 67.2% for AGIs $10k-25k, 68.1% for AGIs $25k-50k, 75.7% for AGIs $50k-75k, 75.9% for AGIs $75k-100k, 76.3% for AGIs over 100k)
Likely homosexual households (counted as self-reported same-sex unmarried-partner households)
Lesbian couples: 0.2% of all households
Gay men: 0.0% of all households
Household received Food Stamps/SNAP in the past 12 months: 353 Household did not receive Food Stamps/SNAP in the past 12 months: 5,194
Women who had a birth in the past 12 months: 191 (133 now married, 58 unmarried) Women who did not have a birth in the past 12 months: 3,370 (1,318 now married, 2,047 unmarried)
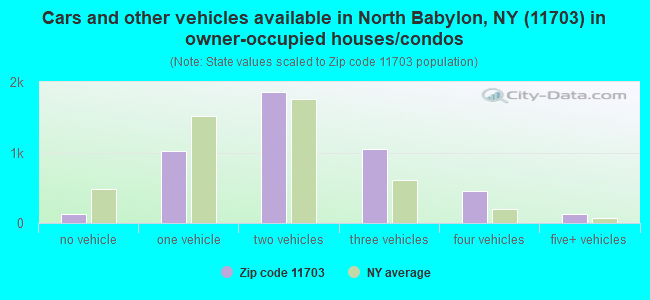
Housing units in zip code 11703 with a mortgage: 3,135 (305 second mortgage, 288 both second mortgage and home equity loan) Houses without a mortgage: 377
Median monthly owner costs for units with a mortgage: $2,765 Median monthly owner costs for units without a mortgage: $1,347
Residents with income below the poverty level in 2022:
This zip code:
3.5%
Whole state:
14.3%
Residents with income below 50% of the poverty level in 2022:
This zip code:
1.4%
Whole state:
6.8%
Median number of rooms in houses and condos:
Here:
6.5
State:
6.3
Median number of rooms in apartments:
Here:
3.6
State:
3.8
Notable locations in this zip code not listed on our city pages
In group quarters: 75 (-1 institutionalized population)
Size of family households: 1,238 2-persons, 928 3-persons, 1,059 4-persons, 499 5-persons, 173 6-persons, 176 7-or-more-persons
Size of nonfamily households: 1,219 1-person, 231 2-persons, 25 3-persons
2,557 married couples with children.
244 single-parent households (108 men, 136 women).
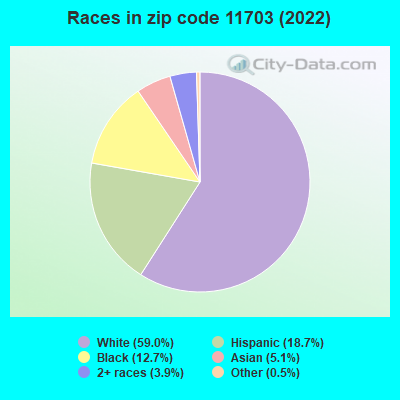
75.3% of residents of 11703 zip code speak English at home.
11.5% of residents speak Spanish at home (69% very well, 23% well, 5% not well, 2% not at all).
9.1% of residents speak other Indo-European language at home (48% very well, 31% well, 20% not well, 1% not at all).
3.3% of residents speak Asian or Pacific Island language at home (65% very well, 19% well, 16% not well).
0.3% of residents speak other language at home (80% very well, 20% well).
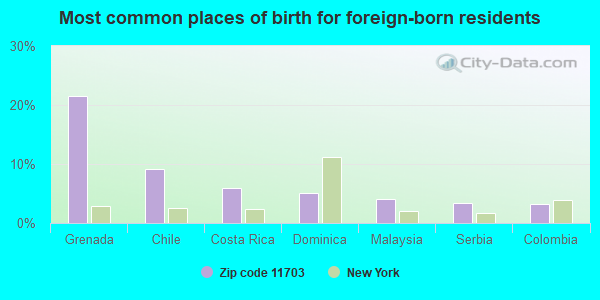
Foreign born population: 2,715 (15.8%) (78.5% of them are naturalized citizens)
This zip code:
15.8%
Whole state:
22.7%
22%Grenada
9%Chile
6%Costa Rica
5%Dominica
4%Malaysia
3%Serbia
3%Colombia
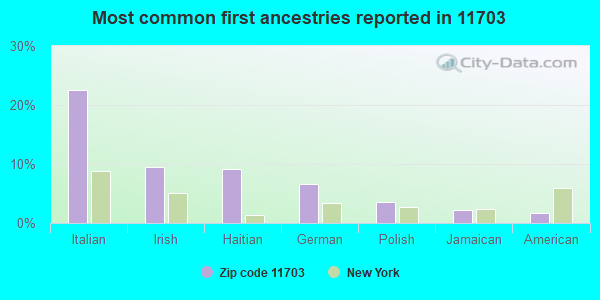
23%Italian
9%Irish
9%Haitian
7%German
4%Polish
2%Jamaican
2%American
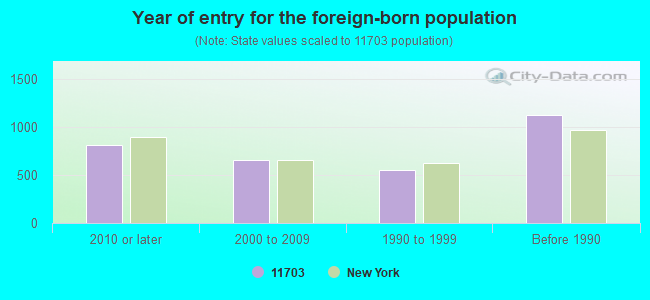
Year of entry for the foreign-born population
8122010 or later
6532000 to 2009
5581990 to 1999
1,128Before 1990
Facilities with environmental interests located in this zip code:
ASTRO ELECTROPLATING INC (170 CENTRAL AVE in BABYLON, NY)
AIR MINOR (AIRS/AFS) STATE MASTER (New York facility tracking) - AIR PROGRAM, HAZARDOUS WASTE PROGRAM (Integrated Compliance Information System) - ICIS-02-1995-0084, FORMAL ENFORCEMENT ACTION COMPLIANCE ACTIVITY (Tracking inspections of insecticide, fungicide, and rodenticide, and toxic substances) HAZARDOUS WASTE BIENNIAL REPORTER (Resource Conservation and Recovery Act (tracking hazardous waste)) Large Quantity Generators, more that 1000 kg of hazardous waste/month (Resource Conservation and Recovery Act (tracking hazardous waste)) TRI REPORTER (Tracking of toxic chemicals releasing facilities) Business SIC classification: UNSUPPORTED PLASTICS FILM AND SHEET; ELECTROPLATING, PLATING, POLISHING, ANODIZING, AND COLORING Business NAICS classification: ELECTROPLATING, PLATING, POLISHING, ANODIZING, AND COLORING.; ELECTROPLATING, PLATING, POLISHING, ANODIZING, AND COLORING. Organizations: ASTRO ELECTROPLATING, INC. (CONTACT/OPERATOR)
, NOWACK LLC (CONTACT/OWNER)
ADVANCED COATING TECHNIQUES INC (313 WYANDANCH AVENUE in NORTH BABYLON, NY)
AIR SYNTHETIC MINOR (AIRS/AFS) AIR MINOR (AIRS/AFS) FORMAL ENFORCEMENT ACTION (Integrated Compliance Information System) - ICIS-02-2000-0019, ENFORCEMENT/COMPLIANCE ACTIVITY (Integrated Compliance Information System) - ICIS-02-1986-0154, FORMAL ENFORCEMENT ACTION, ICIS-02-2000-1022, HAZARDOUS WASTE BIENNIAL REPORTER (Resource Conservation and Recovery Act (tracking hazardous waste)) Large Quantity Generators, more that 1000 kg of hazardous waste/month (Resource Conservation and Recovery Act (tracking hazardous waste)) Business SIC classification: ELECTROPLATING, PLATING, POLISHING, ANODIZING, AND COLORING; COATING, ENGRAVING, AND ALLIED SERVICES; NONCLASSIFIABLE ESTABLISHMENTS Business NAICS classification: METAL COATING, ENGRAVING (EXCEPT JEWELRY AND SILVERWARE), AND ALLIED SERVICES TO MANUFACTURERS. Alternative names: ADVANCED TECHNQ COATING & FINISHING PLNT, DI-TECH
AIRCRAFT FINISHING CORP (612 RUTGERS ROAD in N BABYLON, NY)
AIR MINOR (AIRS/AFS) STATE MASTER (New York facility tracking) - AIR PROGRAM, HAZARDOUS WASTE PROGRAM HAZARDOUS WASTE BIENNIAL REPORTER (Resource Conservation and Recovery Act (tracking hazardous waste)) Large Quantity Generators, more that 1000 kg of hazardous waste/month (Resource Conservation and Recovery Act (tracking hazardous waste)) - notification TRI REPORTER (Tracking of toxic chemicals releasing facilities) Business SIC classification: ELECTROPLATING, PLATING, POLISHING, ANODIZING, AND COLORING; COATING, ENGRAVING, AND ALLIED SERVICES Business NAICS classification: MACHINE TOOL (METAL CUTTING TYPES) MANUFACTURING. Organizations: AIRCRAFT FINISHING, CORP, IN C. (CONTACT/OPERATOR)
, AIRCRAFT FINISHING CORP. (CONTACT/OWNER)
Alternative names: AIRCRAFT FINISHING CROP
A-ONE CLEANERS (1251 DEER PARK AVENUE in NORTH BABYLON, NY)
AIR MINOR (AIRS/AFS) STATE MASTER (New York facility tracking) - AIR PROGRAM Conditionally Exempt Small Quantity Generators, less than 100 kg/month of hazardous waste (Resource Conservation and Recovery Act (tracking hazardous waste)) - notification Business SIC classification: DRYCLEANING PLANTS, EXCEPT RUG CLEANING Business NAICS classification: DRYCLEANING AND LAUNDRY SERVICES (EXCEPT COIN-OPERATED). Organizations: SAM KIM (CONTACT/OWNER)
, NAXOS CLEANERS INC (LEGALLY RESPONSIBLE PARTY)
Alternative names: A ONE DRY CLEANERS
GETTY PETROLEUM CORP (270 WYANDANCH AVE in NORTH BABYLON, NY)
(Resource Conservation and Recovery Act (tracking hazardous waste))
GETTY PETROLEUM CORP (BAYSHORE & WEEKS RDS in NORTH BABYLON, NY)
(Resource Conservation and Recovery Act (tracking hazardous waste))
GRAPHIQUE ADVERTISING (306 WARREN ST in NORTH BABYLON, NY)
(Resource Conservation and Recovery Act (tracking hazardous waste))
HWANG YUAN T & LIN MATTHEW M MD PC (626 DEER PARK AVE in NORTH BABYLON, NY)
(Resource Conservation and Recovery Act (tracking hazardous waste))
IDEAL DENTAL SERVICE (1251 DEER PARK AVE in NORTH BABYLON, NY)
(Resource Conservation and Recovery Act (tracking hazardous waste))
ALL STOP PHOTO (1203 DEER PARK AVE in NORTH BABYLON, NY)
Small Quantity Generators, between 100 kg and 1000 kg of hazardous waste/month (Resource Conservation and Recovery Act (tracking hazardous waste)) - notification Organizations: SCOTT AXLER (CONTACT/OWNER)
Housing units lacking complete plumbing facilities: 0.4% Housing units lacking complete kitchen facilities: 0.7%
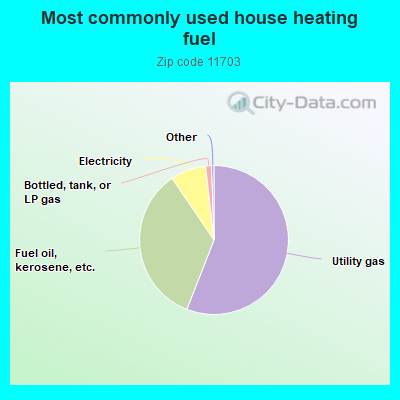
56.0%Utility gas
34.6%Fuel oil, kerosene, etc.
7.7%Electricity
1.3%Bottled, tank, or LP gas
Population in 1990: 17,916.
Place of birth for U.S.-born residents:
This state: 13,159
Northeast: 376
Midwest: 10
South: 226
West: 160
72% of the 11703 zip code residents lived in the same house 5 years ago. Out of people who lived in different houses, 59% lived in this county. Out of people who lived in different counties, 50% lived in New York.
95% of the 11703 zip code residents lived in the same house 1 year ago. Out of people who lived in different houses, 63% moved from this county. Out of people who lived in different houses, 31% moved from different county within same state. Out of people who lived in different houses, 4% moved from abroad.
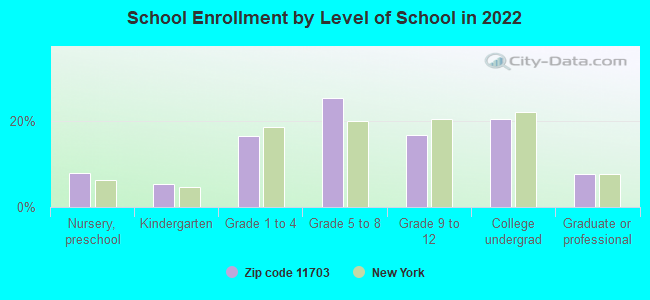
Private vs. public school enrollment:
Students in private schools in grades 1 to 8 (elementary and middle school): 44
Here:
2.7%
New York:
15.6%
Students in private schools in grades 9 to 12 (high school): 22
Here:
3.4%
New York:
15.0%
Students in private undergraduate colleges: 485
Here:
58.7%
New York:
39.2%
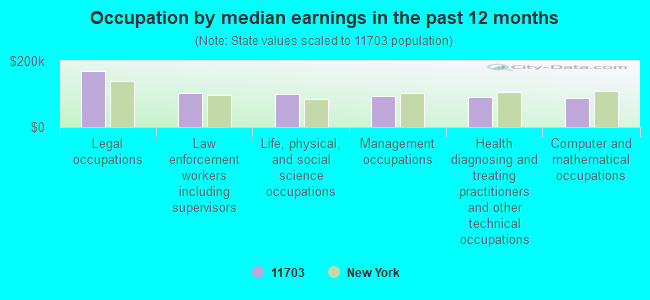
Occupation by median earnings in the past 12 months ($)
168,566Legal occupations
101,645Law enforcement workers including supervisors
99,858Life, physical, and social science occupations
93,190Management occupations
91,485Health diagnosing and treating practitioners and other technical occupations
87,305Computer and mathematical occupations
Top industries in this zip code by the number of employees in 2005:
2002 - 2018 National Fire Incident Reporting System (NFIRS) incidents
Based on the data from the years 2002 - 2018 the average number of fire incidents per year is 7. The highest number of fire incidents - 24 took place in 2018, and the least - 0 in 2003. The data has a growing trend.
When looking into fire subcategories, the most incidents belonged to: Structure Fires (62.9%), and Outside Fires (29.3%).
Fire incident types reported to NFIRS in Zip Code 11703


 Nearest zip codes: 11729, 11704, 11795, 11798, 11757, 11718.


 Based on the data from the years 2002 - 2018 the average number of fire incidents per year is 7. The highest number of fire incidents - 24 took place in 2018, and the least - 0 in 2003. The data has a growing trend.
 When looking into fire subcategories, the most incidents belonged to: Structure Fires (62.9%), and Outside Fires (29.3%).