Races in North Bay Shore, New York (NY) Detailed Stats
Data:
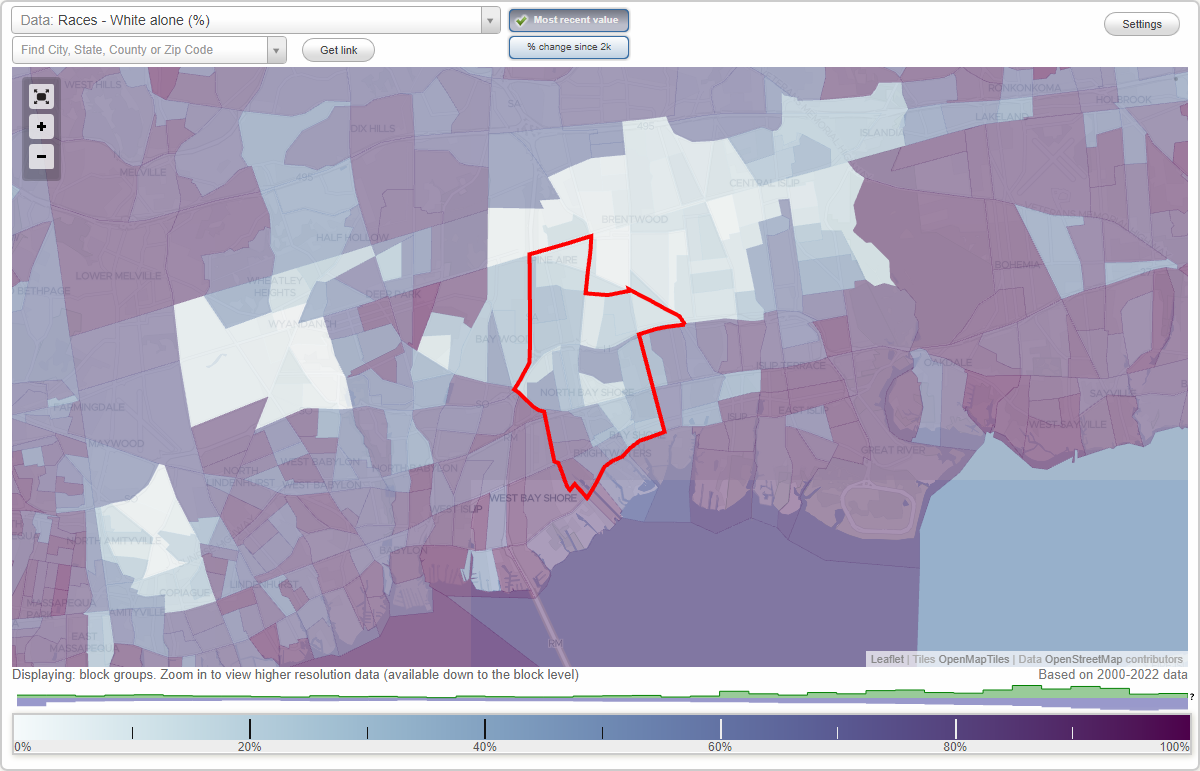
Races - White alone (%)
Races - White alone (% change since 2000)
Races - Black alone (%)
Races - Black alone (% change since 2000)
Races - American Indian alone (%)
Races - American Indian alone (% change since 2000)
Races - Asian alone (%)
Races - Asian alone (% change since 2000)
Races - Hispanic (%)
Races - Hispanic (% change since 2000)
Races - Native Hawaiian and Other Pacific Islander alone (%)
Races - Native Hawaiian and Other Pacific Islander alone (% change since 2000)
Races - Two or more races(%)
Races - Two or more races(% change since 2000)
Races - Other race alone (%)
Races - Other race alone (% change since 2000)
Racial diversity
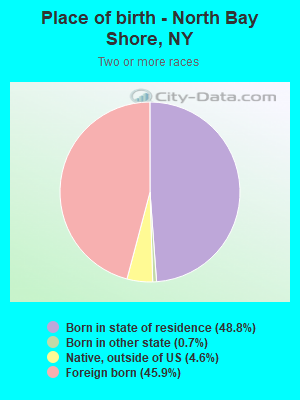
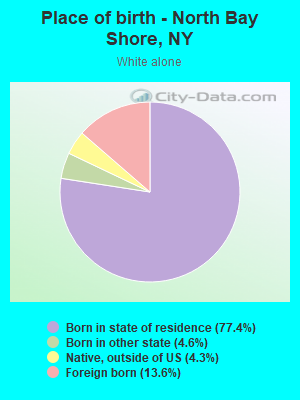
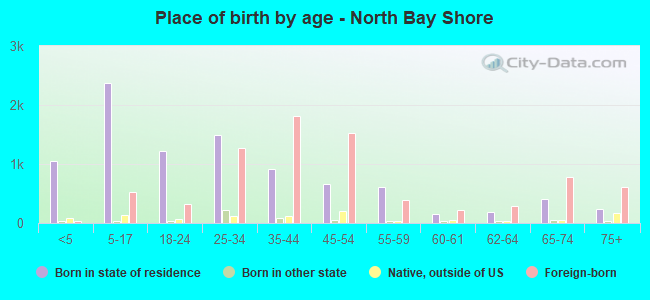
Place of birth - Born in state of residence (%)
Place of birth - Born in state of residence (%) - White
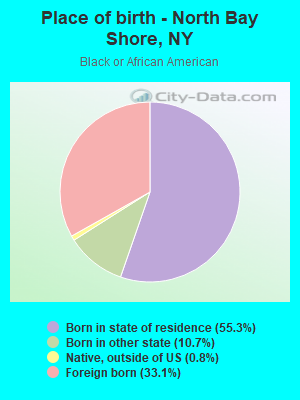
Place of birth - Born in state of residence (%) - Black or African American
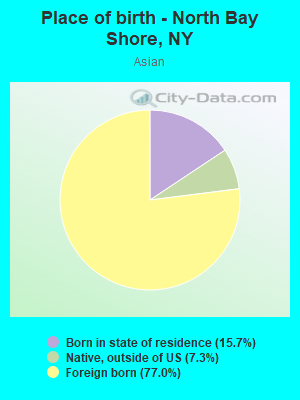
Place of birth - Born in state of residence (%) - Asian
Place of birth - Born in state of residence (%) - Hispanic or Latino
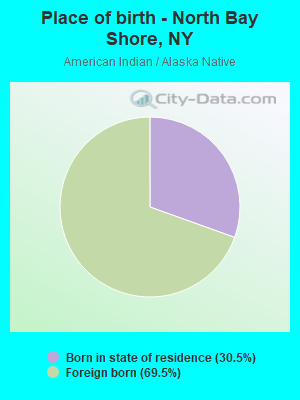
Place of birth - Born in state of residence (%) - American Indian and Alaska Native
Place of birth - Born in state of residence (%) - Multirace
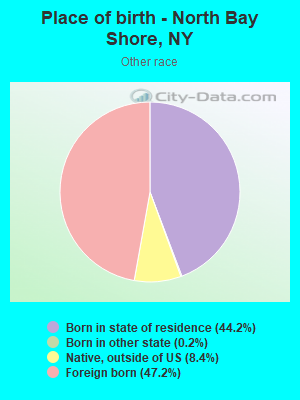
Place of birth - Born in state of residence (%) - Other Race
Place of birth - Born in other state (%)
Place of birth - Born in other state (%) - White
Place of birth - Born in other state (%) - Black or African American
Place of birth - Born in other state (%) - Asian
Place of birth - Born in other state (%) - Hispanic or Latino
Place of birth - Born in other state (%) - American Indian and Alaska Native
Place of birth - Born in other state (%) - Multirace
Place of birth - Born in other state (%) - Other Race
Place of birth - Native, outside of US (%)
Place of birth - Native, outside of US (%) - White
Place of birth - Native, outside of US (%) - Black or African American
Place of birth - Native, outside of US (%) - Asian
Place of birth - Native, outside of US (%) - Hispanic or Latino
Place of birth - Native, outside of US (%) - American Indian and Alaska Native
Place of birth - Native, outside of US (%) - Multirace
Place of birth - Native, outside of US (%) - Other Race
Place of birth - Foreign born (%)
Place of birth - Foreign born (%) - White
Place of birth - Foreign born (%) - Black or African American
Place of birth - Foreign born (%) - Asian
Place of birth - Foreign born (%) - Hispanic or Latino
Place of birth - Foreign born (%) - American Indian and Alaska Native
Place of birth - Foreign born (%) - Multirace
Place of birth - Foreign born (%) - Other Race
Residents speaking English at home (%)
Residents speaking English at home - Born in the United States (%)
Residents speaking English at home - Native, born elsewhere (%)
Residents speaking English at home - Foreign born (%)
Residents speaking Spanish at home (%)
Residents speaking Spanish at home - Born in the United States (%)
Residents speaking Spanish at home - Native, born elsewhere (%)
Residents speaking Spanish at home - Foreign born (%)
Residents speaking other language at home (%)
Residents speaking other language at home - Born in the United States (%)
Residents speaking other language at home - Native, born elsewhere (%)
Residents speaking other language at home - Foreign born (%)
Marital status - Never married (%)
Marital status - Now married (%)
Marital status - Separated (%)
Marital status - Widowed (%)
Marital status - Divorced (%)
Ancestries Reported - Arab (%)
Ancestries Reported - Czech (%)
Ancestries Reported - Danish (%)
Ancestries Reported - Dutch (%)
Ancestries Reported - English (%)
Ancestries Reported - French (%)
Ancestries Reported - French Canadian (%)
Ancestries Reported - German (%)
Ancestries Reported - Greek (%)
Ancestries Reported - Hungarian (%)
Ancestries Reported - Irish (%)
Ancestries Reported - Italian (%)
Ancestries Reported - Lithuanian (%)
Ancestries Reported - Norwegian (%)
Ancestries Reported - Polish (%)
Ancestries Reported - Portuguese (%)
Ancestries Reported - Russian (%)
Ancestries Reported - Scotch-Irish (%)
Ancestries Reported - Scottish (%)
Ancestries Reported - Slovak (%)
Ancestries Reported - Subsaharan African (%)
Ancestries Reported - Swedish (%)
Ancestries Reported - Swiss (%)
Ancestries Reported - Ukrainian (%)
Ancestries Reported - United States (%)
Ancestries Reported - Welsh (%)
Ancestries Reported - West Indian (%)
Ancestries Reported - Other (%)
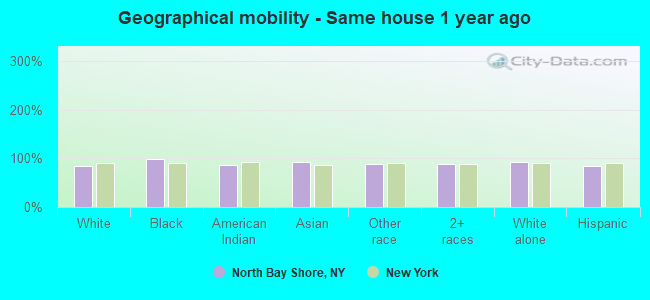
Geographical mobility - Same house 1 year ago (%)
Geographical mobility - Same house 1 year ago (%) - White
Geographical mobility - Same house 1 year ago (%) - Black or African American
Geographical mobility - Same house 1 year ago (%) - Asian
Geographical mobility - Same house 1 year ago (%) - Hispanic or Latino
Geographical mobility - Same house 1 year ago (%) - American Indian and Alaska Native
Geographical mobility - Same house 1 year ago (%) - Multirace
Geographical mobility - Same house 1 year ago (%) - Other Race
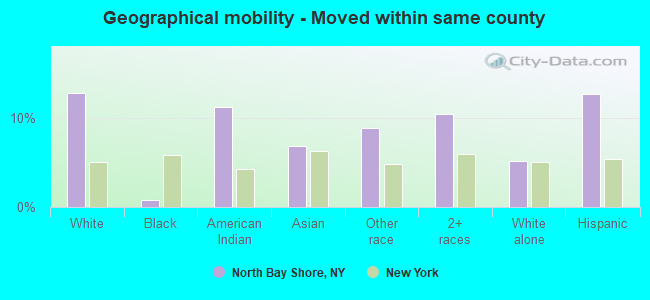
Geographical mobility - Moved within same county (%)
Geographical mobility - Moved within same county (%) - White
Geographical mobility - Moved within same county (%) - Black or African American
Geographical mobility - Moved within same county (%) - Asian
Geographical mobility - Moved within same county (%) - Hispanic or Latino
Geographical mobility - Moved within same county (%) - American Indian and Alaska Native
Geographical mobility - Moved within same county (%) - Multirace
Geographical mobility - Moved within same county (%) - Other Race
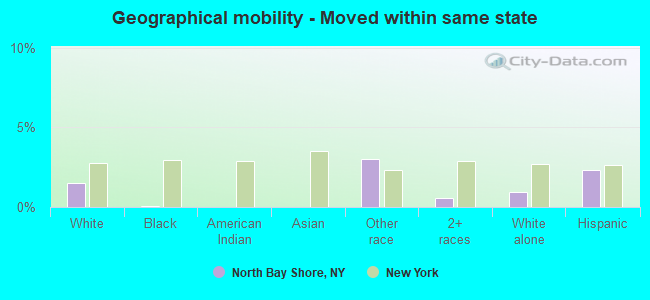
Geographical mobility - Moved from different county within same state (%)
Geographical mobility - Moved from different county within same state (%) - White
Geographical mobility - Moved from different county within same state (%) - Black or African American
Geographical mobility - Moved from different county within same state (%) - Asian
Geographical mobility - Moved from different county within same state (%) - Hispanic or Latino
Geographical mobility - Moved from different county within same state (%) - American Indian and Alaska Native
Geographical mobility - Moved from different county within same state (%) - Multirace
Geographical mobility - Moved from different county within same state (%) - Other Race
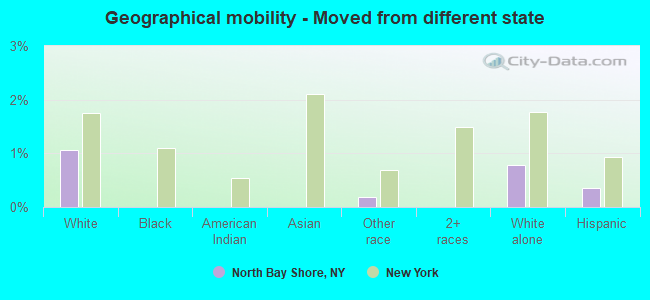
Geographical mobility - Moved from different state (%)
Geographical mobility - Moved from different state (%) - White
Geographical mobility - Moved from different state (%) - Black or African American
Geographical mobility - Moved from different state (%) - Asian
Geographical mobility - Moved from different state (%) - Hispanic or Latino
Geographical mobility - Moved from different state (%) - American Indian and Alaska Native
Geographical mobility - Moved from different state (%) - Multirace
Geographical mobility - Moved from different state (%) - Other Race
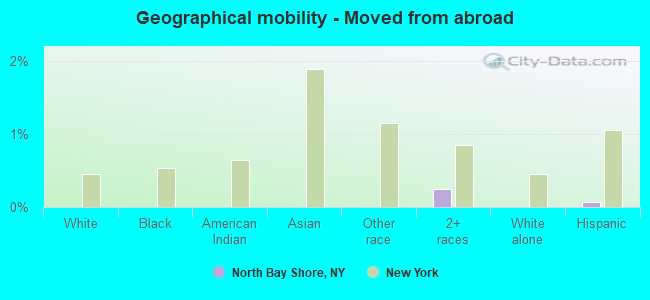
Geographical mobility - Moved from abroad (%)
Geographical mobility - Moved from abroad (%) - White
Geographical mobility - Moved from abroad (%) - Black or African American
Geographical mobility - Moved from abroad (%) - Asian
Geographical mobility - Moved from abroad (%) - Hispanic or Latino
Geographical mobility - Moved from abroad (%) - American Indian and Alaska Native
Geographical mobility - Moved from abroad (%) - Multirace
Geographical mobility - Moved from abroad (%) - Other Race
Place of birth for the foreign-born population - Ireland (%)
Place of birth for the foreign-born population - Denmark (%)
Place of birth for the foreign-born population - Norway (%)
Place of birth for the foreign-born population - Sweden (%)
Place of birth for the foreign-born population - United Kingdom (%)
Place of birth for the foreign-born population - England (%)
Place of birth for the foreign-born population - Scotland (%)
Place of birth for the foreign-born population - Other Northern Europe (%)
Place of birth for the foreign-born population - Austria (%)
Place of birth for the foreign-born population - Belgium (%)
Place of birth for the foreign-born population - France (%)
Place of birth for the foreign-born population - Germany (%)
Place of birth for the foreign-born population - Netherlands (%)
Place of birth for the foreign-born population - Switzerland (%)
Place of birth for the foreign-born population - Other Western Europe (%)
Place of birth for the foreign-born population - Greece (%)
Place of birth for the foreign-born population - Italy (%)
Place of birth for the foreign-born population - Portugal (%)
Place of birth for the foreign-born population - Spain (%)
Place of birth for the foreign-born population - Other Southern Europe (%)
Place of birth for the foreign-born population - Albania (%)
Place of birth for the foreign-born population - Belarus (%)
Place of birth for the foreign-born population - Bosnia and Herzegovina (%)
Place of birth for the foreign-born population - Bulgaria (%)
Place of birth for the foreign-born population - Croatia (%)
Place of birth for the foreign-born population - Czechoslovakia (%)
Place of birth for the foreign-born population - Hungary (%)
Place of birth for the foreign-born population - Latvia (%)
Place of birth for the foreign-born population - Lithuania (%)
Place of birth for the foreign-born population - North Macedonia (Macedonia) (%)
Place of birth for the foreign-born population - Moldova (%)
Place of birth for the foreign-born population - Poland (%)
Place of birth for the foreign-born population - Romania (%)
Place of birth for the foreign-born population - Russia (%)
Place of birth for the foreign-born population - Serbia (%)
Place of birth for the foreign-born population - Ukraine (%)
Place of birth for the foreign-born population - Other Eastern Europe (%)
Place of birth for the foreign-born population - China (%)
Place of birth for the foreign-born population - Hong Kong (%)
Place of birth for the foreign-born population - Taiwan (%)
Place of birth for the foreign-born population - Japan (%)
Place of birth for the foreign-born population - Korea (%)
Place of birth for the foreign-born population - Other Eastern Asia (%)
Place of birth for the foreign-born population - Afghanistan (%)
Place of birth for the foreign-born population - Bangladesh (%)
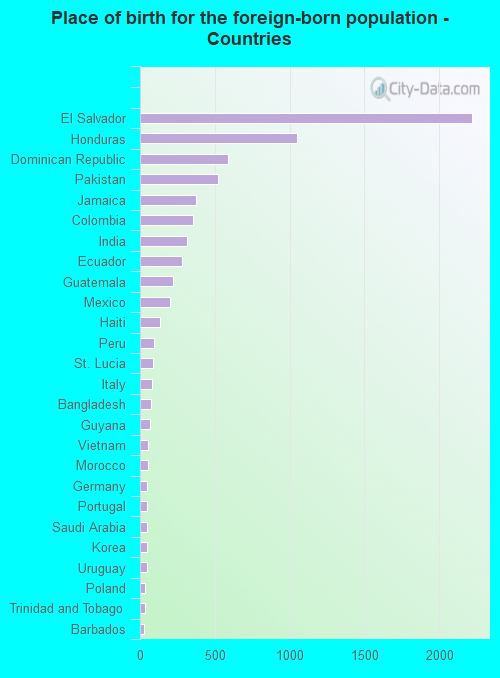
Place of birth for the foreign-born population - India (%)
Place of birth for the foreign-born population - Iran (%)
Place of birth for the foreign-born population - Kazakhstan (%)
Place of birth for the foreign-born population - Nepal (%)
Place of birth for the foreign-born population - Pakistan (%)
Place of birth for the foreign-born population - Sri Lanka (%)
Place of birth for the foreign-born population - Uzbekistan (%)
Place of birth for the foreign-born population - Other South Central Asia (%)
Place of birth for the foreign-born population - Burma (%)
Place of birth for the foreign-born population - Cambodia (%)
Place of birth for the foreign-born population - Indonesia (%)
Place of birth for the foreign-born population - Laos (%)
Place of birth for the foreign-born population - Malaysia (%)
Place of birth for the foreign-born population - Philippines (%)
Place of birth for the foreign-born population - Singapore (%)
Place of birth for the foreign-born population - Thailand (%)
Place of birth for the foreign-born population - Vietnam (%)
Place of birth for the foreign-born population - Other South Eastern Asia (%)
Place of birth for the foreign-born population - Armenia (%)
Place of birth for the foreign-born population - Iraq (%)
Place of birth for the foreign-born population - Israel (%)
Place of birth for the foreign-born population - Jordan (%)
Place of birth for the foreign-born population - Kuwait (%)
Place of birth for the foreign-born population - Lebanon (%)
Place of birth for the foreign-born population - Saudi Arabia (%)
Place of birth for the foreign-born population - Syria (%)
Place of birth for the foreign-born population - Turkey (%)
Place of birth for the foreign-born population - Yemen (%)
Place of birth for the foreign-born population - Other Western Asia (%)
Place of birth for the foreign-born population - Eritrea (%)
Place of birth for the foreign-born population - Ethiopia (%)
Place of birth for the foreign-born population - Kenya (%)
Place of birth for the foreign-born population - Somalia (%)
Place of birth for the foreign-born population - Uganda (%)
Place of birth for the foreign-born population - Zimbabwe (%)
Place of birth for the foreign-born population - Other Eastern Africa (%)
Place of birth for the foreign-born population - Cameroon (%)
Place of birth for the foreign-born population - Congo (%)
Place of birth for the foreign-born population - Democratic Republic of Congo (Zaire) (%)
Place of birth for the foreign-born population - Other Middle Africa (%)
Place of birth for the foreign-born population - Egypt (%)
Place of birth for the foreign-born population - Morocco (%)
Place of birth for the foreign-born population - Sudan (%)
Place of birth for the foreign-born population - Other Northern Africa (%)
Place of birth for the foreign-born population - South Africa (%)
Place of birth for the foreign-born population - Other Southern Africa (%)
Place of birth for the foreign-born population - Cabo Verde (%)
Place of birth for the foreign-born population - Ghana (%)
Place of birth for the foreign-born population - Liberia (%)
Place of birth for the foreign-born population - Nigeria (%)
Place of birth for the foreign-born population - Senegal (%)
Place of birth for the foreign-born population - Sierra Leone (%)
Place of birth for the foreign-born population - Other Western Africa (%)
Place of birth for the foreign-born population - Australia (%)
Place of birth for the foreign-born population - New Zealand (%)
Place of birth for the foreign-born population - Fiji (%)
Place of birth for the foreign-born population - Micronesia (%)
Place of birth for the foreign-born population - Bahamas (%)
Place of birth for the foreign-born population - Barbados (%)
Place of birth for the foreign-born population - Cuba (%)
Place of birth for the foreign-born population - Dominica (%)
Place of birth for the foreign-born population - Dominican Republic (%)
Place of birth for the foreign-born population - Grenada (%)
Place of birth for the foreign-born population - Haiti (%)
Place of birth for the foreign-born population - Jamaica (%)
Place of birth for the foreign-born population - St. Vincent and the Grenadines (%)
Place of birth for the foreign-born population - Trinidad and Tobago (%)
Place of birth for the foreign-born population - West Indies (%)
Place of birth for the foreign-born population - Other Caribbean (%)
Place of birth for the foreign-born population - Belize (%)
Place of birth for the foreign-born population - Costa Rica (%)
Place of birth for the foreign-born population - El Salvador (%)
Place of birth for the foreign-born population - Guatemala (%)
Place of birth for the foreign-born population - Honduras (%)
Place of birth for the foreign-born population - Mexico (%)
Place of birth for the foreign-born population - Nicaragua (%)
Place of birth for the foreign-born population - Panama (%)
Place of birth for the foreign-born population - Other Central America (%)
Place of birth for the foreign-born population - Argentina (%)
Place of birth for the foreign-born population - Bolivia (%)
Place of birth for the foreign-born population - Brazil (%)
Place of birth for the foreign-born population - Chile (%)
Place of birth for the foreign-born population - Colombia (%)
Place of birth for the foreign-born population - Ecuador (%)
Place of birth for the foreign-born population - Guyana (%)
Place of birth for the foreign-born population - Peru (%)
Place of birth for the foreign-born population - Uruguay (%)
Place of birth for the foreign-born population - Venezuela (%)
Place of birth for the foreign-born population - Other South America (%)
Place of birth for the foreign-born population - Canada (%)
Place of birth for the foreign-born population - Other Northern America (%)
Place of birth for the foreign-born population - Other (%)
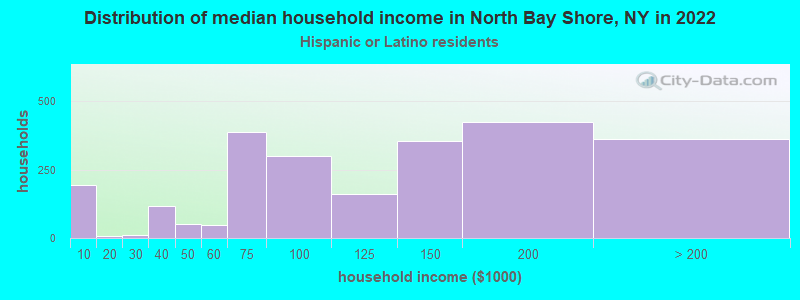
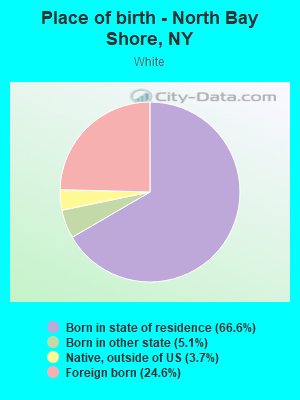
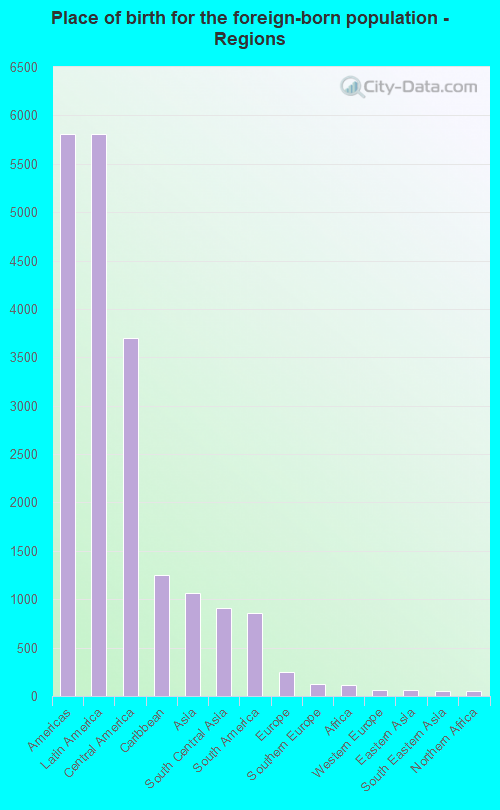
According to 2022 data, the most numerous races in North Bay Shore, NY are White alone (2,982 residents), Hispanic (11,729 residents), and Black alone (2,108 residents). 35.1% of North Bay Shore residents speak English at home. 39.3% of North Bay Shore, NY residents are foreign-born (31.9% born in Latin America, 5.9% born in Asia), which is 44.1% greater than the foreign-born rate of 22.0% across the entire state of New York.
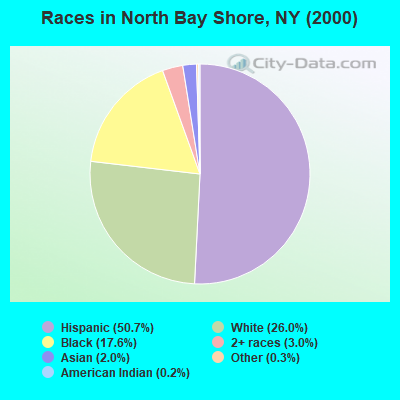
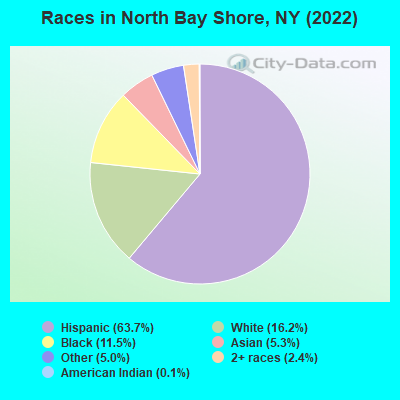
Race distribution in North Bay Shore
2000 2022
11,760,981 62.0% White alone 2,867,583 15.1% Hispanic 2,812,623 14.8% Black alone 1,035,926 5.5% Asian alone 366,116 1.9% Two or more races 75,499 0.4% Other race alone 52,499 0.3% American Indian alone 5,230 0.03% Native Hawaiian and Other
10,408,933 52.9% White alone 3,867,299 19.7% Hispanic 2,633,840 13.4% Black alone 1,776,286 9.0% Asian alone 732,670 3.7% Two or more races 216,110 1.1% Other race alone 35,082 0.2% American Indian alone 6,931 0.04% Native Hawaiian and Other
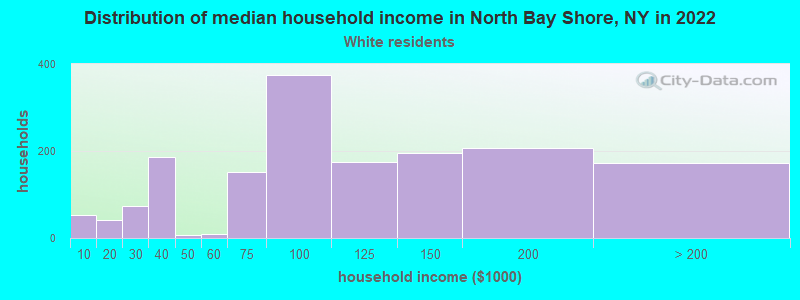
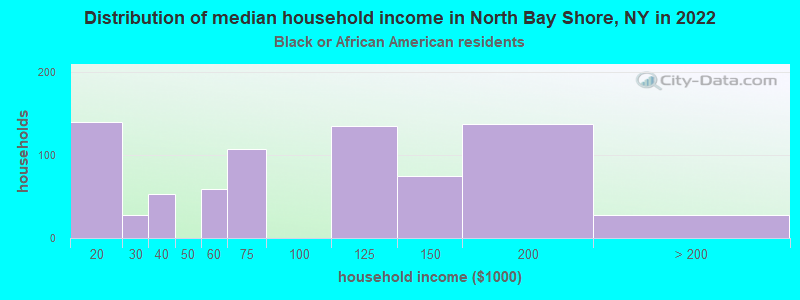
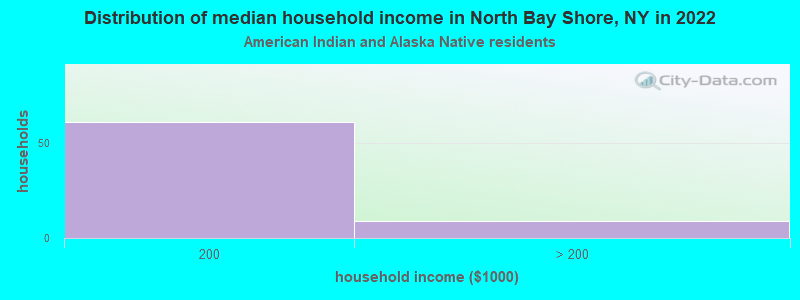
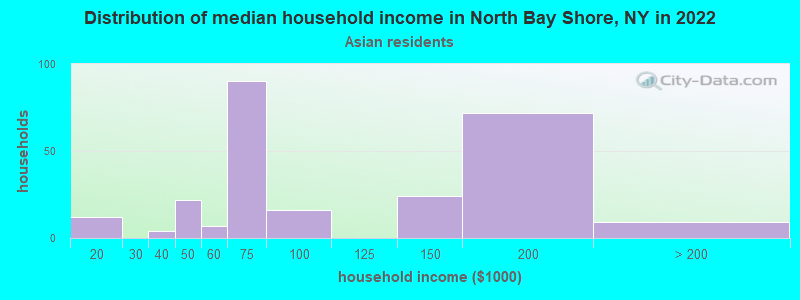
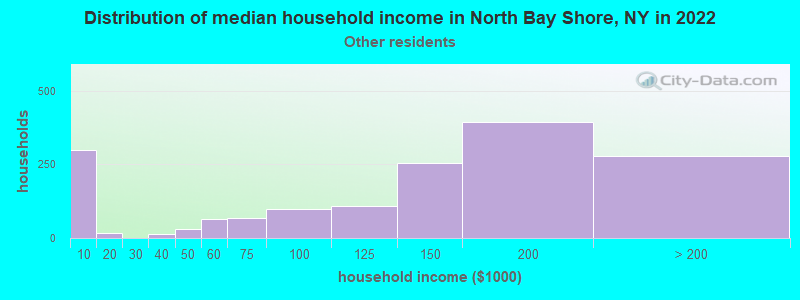
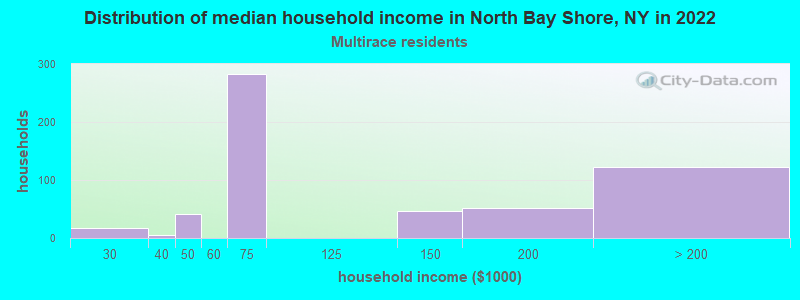
Income and house value in North Bay Shore Median household income in 2022 $87,323 White non-Hispanic householders$70,495 Black householders$139,767 Some other race householders$66,332 Two or more races householders$118,527 Hispanic or Latino race householdersMedian 2022 house value $422,172 White Non-Hispanic householders$444,866 Black or African American householders$699,474 American Indian or Alaska Native householders $559,579 Asian householders$478,751 Some other race householders$461,031 Two or more races householders$447,353 Hispanic or Latino householders
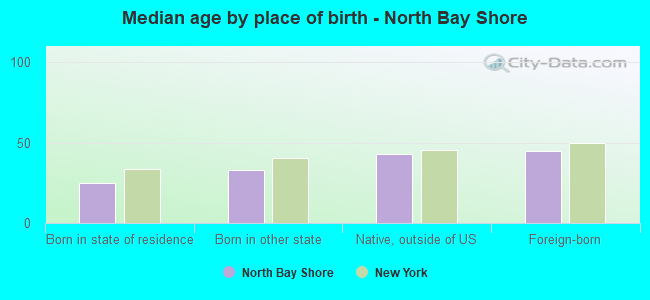
Median age by race in North Bay Shore
33.6 Median age for White residents30.4 38.5 38.4 Median age for Black or African American residents38.2 38.2 56.3 Median age for American Indian / Alaska Native residents61.6 20.8 53.2 Median age for Asian residents52.0 74.5 -742,816,091.2 Median age for Native Hawaiian / Pacific Islander residents-831,187,409.8 -771,300,447.7 32.1 Median age for Other race residents33.9 30.5 38.4 Median age for Two or more races residents29.5 44.0 37.6 Median age for White alone residents29.6 50.8 34.6 Median age for Hispanic or Latino residents34.7 34.4
Owner/renter occupied households by race in North Bay Shore
House owners and renters - White residents 1,350 82.6% Owner occupied285 17.4% Renter occupiedHouse owners and renters - Black or African American residents 536 69.0% Owner occupied241 31.0% Renter occupiedHouse owners and renters - American Indian / Alaska Native residents 49 100.0% Owner occupiedHouse owners and renters - Asian residents 177 72.3% Owner occupied68 27.7% Renter occupiedHouse owners and renters - Other race residents 1,060 68.2% Owner occupied494 31.8% Renter occupiedHouse owners and renters - Two or more races residents 668 97.3% Owner occupied19 2.7% Renter occupiedHouse owners and renters - White alone residents 740 86.0% Owner occupied121 14.0% Renter occupiedHouse owners and renters - Hispanic or Latino residents 1,817 76.3% Owner occupied564 23.7% Renter occupied
Language usage in North Bay Shore
English speakers - Total 35.1% of residents of North Bay Shore speak English at home.
57.1% of residents speak Spanish at home 4,775 48.5% Speak English very well5,077 51.5% Speak English less than very well10.9% of residents speak other language at home 868 46.3% Speak English very well1,006 53.7% Speak English less than very well
English speakers - Born in the United States 62.3% of residents of North Bay Shore speak English at home.
34.1% of residents speak Spanish at home 205 100.0% Speak English very well
English speakers - Native, born elsewhere 32.0% of residents of North Bay Shore speak English at home.
56.1% of residents speak Spanish at home 249 44.9% Speak English very well305 55.1% Speak English less than very well5.3% of residents speak other language at home 46 88.5% Speak English very well6 11.5% Speak English less than very well
English speakers - Foreign-born 13.6% of residents of North Bay Shore speak English at home.
68.4% of residents speak Spanish at home 1,469 27.5% Speak English very well3,874 72.5% Speak English less than very well20.1% of residents speak other language at home 553 35.2% Speak English very well1,016 64.8% Speak English less than very well
White (Caucasian) - Speak only English Native:
59.7% (2,398)Foreign-born:
20.7% (305)
White (Caucasian) - Speak another language Native:
30.9% (1,241)Foreign-born:
76.6% (1,130)
Black or African American - Speak only English Native:
90.0% (1,297)Foreign-born:
79.1% (572)
Black or African American - Speak another language Native:
9.4% (136)Foreign-born:
25.7% (186)
American Indian / Alaska Native - Speak only English Native:
39.5% (24)Foreign-born:
18.7% (29)
American Indian / Alaska Native - Speak another language Native:
48.4% (30)Foreign-born:
65.0% (101)
Asian - Speak only English Native:
28.2% (43)Foreign-born:
4.6% (35)
Asian - Speak another language Native:
75.0% (114)Foreign-born:
100.0% (749)
Other race - Speak only English Native:
24.8% (987)Foreign-born:
2.7% (106)
Other race - Speak another language Native:
73.5% (2,918)Foreign-born:
98.3% (3,865)
Two or more races - Speak only English Native:
45.4% (728)Foreign-born:
6.2% (88)
Two or more races - Speak another language Native:
53.8% (862)Foreign-born:
94.6% (1,342)
White alone - Speak only English Native:
85.2% (2,023)Foreign-born:
25.6% (101)
White alone - Speak another language Native:
15.6% (370)Foreign-born:
74.4% (293)
Hispanic or Latino - Speak only English Native:
23.6% (1,266)Foreign-born:
6.6% (369)
Hispanic or Latino - Speak another language Native:
74.8% (4,011)Foreign-born:
93.5% (5,245)
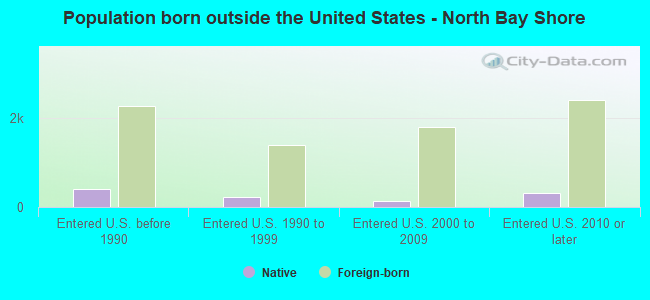
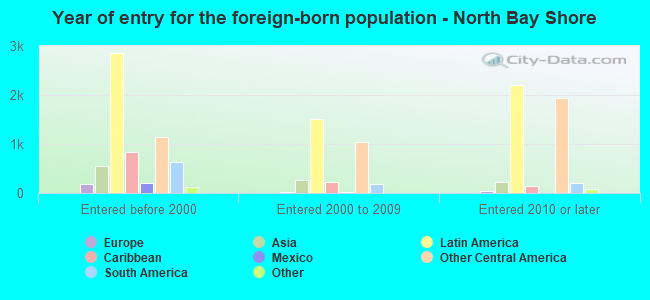
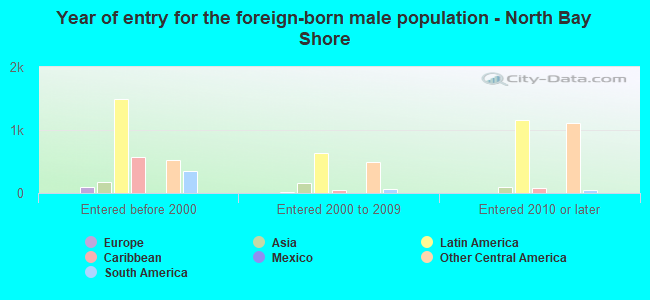
Foreign-born residents in North Bay Shore 7,238 residents are foreign born (31.9% Latin America , 5.9% Asia ).
This city:
39.3%New York:
22.6%
Marital status for residents in North Bay Shore Marital status - White (Caucasian) population 15 years and over
Males 44.6% Never married39.6% Now married0.9% Separated3.2% Widowed11.7% DivorcedFemales 30.7% Never married42.8% Now married2.4% Separated13.9% Widowed10.1% DivorcedWomen who gave birth in the past 12 months Now married:
92.9% (68)Unmarried:
7.1% (5)
Women who did not give birth in the past 12 months Now married:
34.1% (433)Unmarried:
65.9% (836)
Marital status - Black or African American population 15 years and over
Males 32.5% Never married57.4% Now married2.6% Separated0.0% Widowed7.5% DivorcedFemales 40.0% Never married35.6% Now married5.9% Separated1.9% Widowed16.6% DivorcedWomen who did not give birth in the past 12 months Now married:
40.7% (289)Unmarried:
59.3% (421)
Marital status - American Indian / Alaska Native population 15 years and over
Males 13.1% Never married34.5% Now married0.0% Separated41.7% Widowed10.7% DivorcedFemales 56.0% Never married0.0% Now married0.0% Separated0.0% Widowed44.0% DivorcedWomen who did not give birth in the past 12 months Now married:
0.0% (0)Unmarried:
100.0% (20)
Marital status - Asian population 15 years and over
Males 11.0% Never married89.0% Now married0.0% Separated0.0% Widowed0.0% DivorcedFemales 10.8% Never married85.7% Now married0.0% Separated3.4% Widowed0.0% DivorcedWomen who gave birth in the past 12 months Now married:
100.0% (27)Unmarried:
0.0% (0)
Women who did not give birth in the past 12 months Now married:
65.9% (115)Unmarried:
34.1% (59)
Marital status - Other race population 15 years and over
Males 43.0% Never married42.9% Now married2.4% Separated0.0% Widowed11.6% DivorcedFemales 50.0% Never married38.7% Now married4.3% Separated2.9% Widowed4.1% DivorcedWomen who gave birth in the past 12 months Now married:
27.4% (66)Unmarried:
72.6% (174)
Women who did not give birth in the past 12 months Now married:
42.2% (1,021)Unmarried:
57.8% (1,400)
Marital status - Two or more races population 15 years and over
Males 69.6% Never married29.8% Now married0.0% Separated0.6% Widowed0.0% DivorcedFemales 51.5% Never married24.9% Now married8.1% Separated2.4% Widowed13.1% DivorcedWomen who gave birth in the past 12 months Now married:
100.0% (104)Unmarried:
0.0% (0)
Women who did not give birth in the past 12 months Now married:
19.0% (189)Unmarried:
81.0% (805)
Marital status - White alone, not Hispanic / Latino population 15 years and over
Males 53.9% Never married30.8% Now married0.0% Separated3.3% Widowed12.1% DivorcedFemales 27.9% Never married39.0% Now married1.1% Separated18.7% Widowed13.3% DivorcedWomen who gave birth in the past 12 months Now married:
100.0% (60)Unmarried:
0.0% (0)
Women who did not give birth in the past 12 months Now married:
26.6% (129)Unmarried:
73.4% (355)
Marital status - Hispanic or Latino population 15 years and over
Males 44.0% Never married42.1% Now married1.7% Separated1.9% Widowed10.3% DivorcedFemales 43.8% Never married41.3% Now married4.5% Separated5.3% Widowed5.1% DivorcedWomen who gave birth in the past 12 months Now married:
51.0% (134)Unmarried:
49.0% (129)
Women who did not give birth in the past 12 months Now married:
37.5% (1,120)Unmarried:
62.5% (1,870)
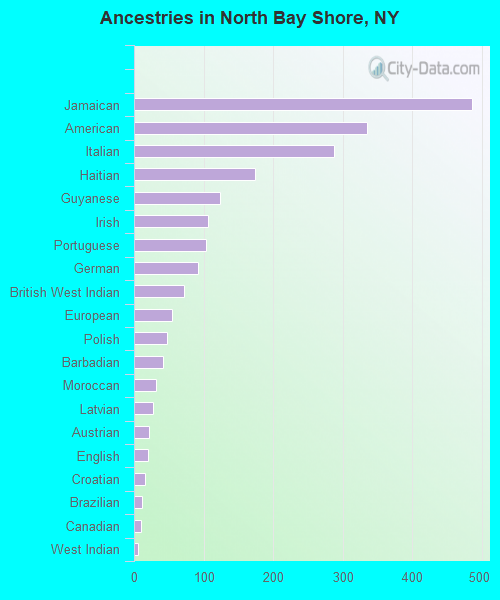
Ancestries in North Bay Shore
486 5.2% Jamaican335 3.6% American287 3.1% Italian174 1.9% Haitian123 1.3% Guyanese106 1.1% Irish104 1.1% Portuguese92 1.0% German72 0.8% British West Indian54 0.6% European47 0.5% Polish42 0.5% Barbadian32 0.3% Moroccan27 0.3% Latvian22 0.2% Austrian20 0.2% English16 0.2% Croatian12 0.1% Brazilian10 0.1% Canadian6 0.06% West Indian
Geographical mobility in North Bay Shore Same house 1 year ago 5,427 84.5% White (Caucasian)2,138 98.2% Black or African American137 86.2% American Indian / Alaska Native908 93.1% Asian7,255 87.7% Other race2,735 88.2% Two or more races2,776 93.0% White alone, not Hispanic / Latino9,834 84.7% Hispanic or LatinoMoved within same county 820 12.8% White / Caucasian18 0.8% Black or African American18 11.1% American Indian / Alaska Native66 6.8% Asian727 8.8% Other race322 10.4% Two or more races154 5.2% White alone, not Hispanic / Latino1,473 12.7% Hispanic or LatinoMoved within same state 96 1.5% White / Caucasian1 0.1% Black or African American248 3.0% Other race17 0.6% Two or more races29 1.0% White alone, not Hispanic / Latino267 2.3% Hispanic or LatinoMoved from different state 68 1.1% White / Caucasian16 0.2% Other race23 0.8% White alone, not Hispanic / Latino41 0.4% Hispanic or LatinoMoved from abroad 8 0.2% Two or more races8 0.1% Hispanic or Latino
Children Nativity (place of birth) in North Bay Shore
Children under 6 years - Living with two parents Both parents native 384 100.0% NativeBoth parents foreign-born 365 100.0% NativeOne native, one foreign-born parent 231 100.0% NativeChildren under 6 years - Living with one parent Native parent 64 78.8% Native17 21.2% Foreign-bornForeign-born parent 240 78.8% Native64 21.2% Foreign-bornChildren 6 to 17 years - Living with two parents Both parents native 236 99.8% Native0 0.2% Foreign-bornBoth parents foreign-born 745 91.3% Native71 8.7% Foreign-bornOne native, one foreign-born parent 358 96.9% Native11 3.1% Foreign-bornChildren 6 to 17 years - Living with one parent Native parent 37 100.0% NativeForeign-born parent 878 59.5% Native597 40.5% Foreign-born
Grandparents responsible for own grandchildren in North Bay Shore
Grandparents (30 to 59 years) White / Caucasian 7 8.0% Responsible for grandchildren76 92.0% Not responsible for grandchildrenBlack or African American 101 100.0% Not responsible for grandchildrenAsian 6 100.0% Not responsible for grandchildrenOther race 88 42.3% Responsible for grandchildren120 57.7% Not responsible for grandchildrenTwo or more races 7 100.0% Not responsible for grandchildrenHispanic or Latino 108 31.5% Responsible for grandchildren234 68.5% Not responsible for grandchildren
Grandparents (60 years and over) White / Caucasian 5 3.9% Responsible for grandchildren132 96.1% Not responsible for grandchildrenBlack or African American 36 100.0% Not responsible for grandchildrenOther race 63 100.0% Not responsible for grandchildrenTwo or more races 197 100.0% Not responsible for grandchildrenHispanic or Latino 4 1.3% Responsible for grandchildren306 98.7% Not responsible for grandchildren