Races in North Valley Stream, New York (NY) Detailed Stats
Data:
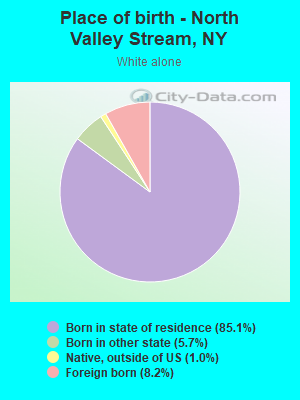
Races - White alone (%)
Races - White alone (% change since 2000)
Races - Black alone (%)
Races - Black alone (% change since 2000)
Races - American Indian alone (%)
Races - American Indian alone (% change since 2000)
Races - Asian alone (%)
Races - Asian alone (% change since 2000)
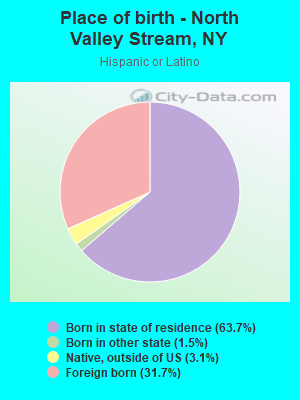
Races - Hispanic (%)
Races - Hispanic (% change since 2000)
Races - Native Hawaiian and Other Pacific Islander alone (%)
Races - Native Hawaiian and Other Pacific Islander alone (% change since 2000)
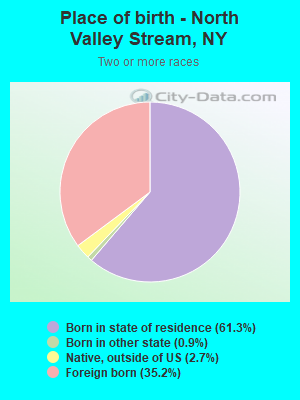
Races - Two or more races(%)
Races - Two or more races(% change since 2000)
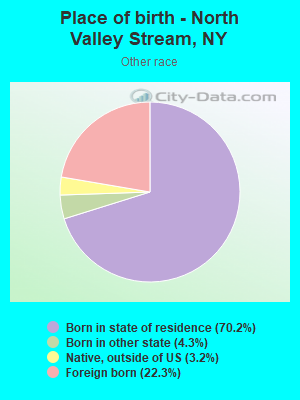
Races - Other race alone (%)
Races - Other race alone (% change since 2000)
Racial diversity
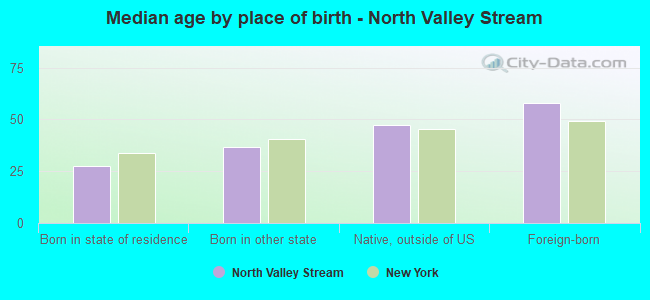
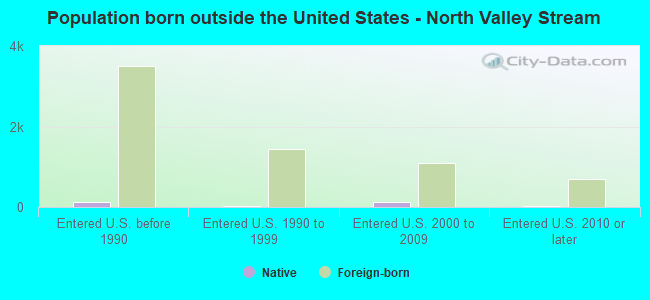
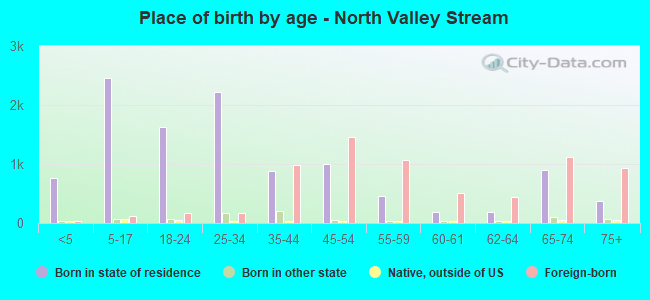
Place of birth - Born in state of residence (%)
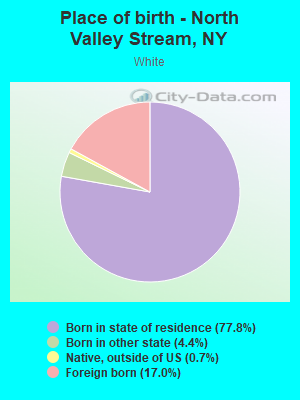
Place of birth - Born in state of residence (%) - White
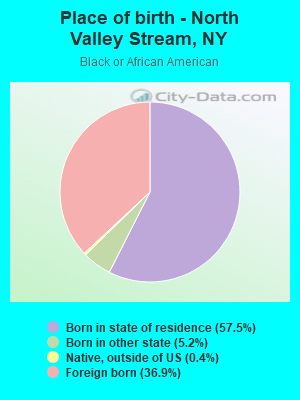
Place of birth - Born in state of residence (%) - Black or African American
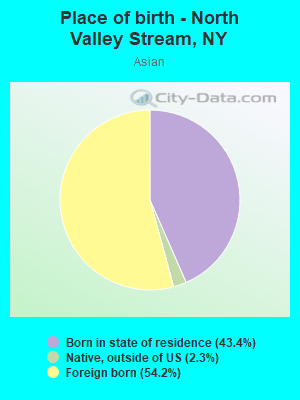
Place of birth - Born in state of residence (%) - Asian
Place of birth - Born in state of residence (%) - Hispanic or Latino
Place of birth - Born in state of residence (%) - American Indian and Alaska Native
Place of birth - Born in state of residence (%) - Multirace
Place of birth - Born in state of residence (%) - Other Race
Place of birth - Born in other state (%)
Place of birth - Born in other state (%) - White
Place of birth - Born in other state (%) - Black or African American
Place of birth - Born in other state (%) - Asian
Place of birth - Born in other state (%) - Hispanic or Latino
Place of birth - Born in other state (%) - American Indian and Alaska Native
Place of birth - Born in other state (%) - Multirace
Place of birth - Born in other state (%) - Other Race
Place of birth - Native, outside of US (%)
Place of birth - Native, outside of US (%) - White
Place of birth - Native, outside of US (%) - Black or African American
Place of birth - Native, outside of US (%) - Asian
Place of birth - Native, outside of US (%) - Hispanic or Latino
Place of birth - Native, outside of US (%) - American Indian and Alaska Native
Place of birth - Native, outside of US (%) - Multirace
Place of birth - Native, outside of US (%) - Other Race
Place of birth - Foreign born (%)
Place of birth - Foreign born (%) - White
Place of birth - Foreign born (%) - Black or African American
Place of birth - Foreign born (%) - Asian
Place of birth - Foreign born (%) - Hispanic or Latino
Place of birth - Foreign born (%) - American Indian and Alaska Native
Place of birth - Foreign born (%) - Multirace
Place of birth - Foreign born (%) - Other Race
Residents speaking English at home (%)
Residents speaking English at home - Born in the United States (%)
Residents speaking English at home - Native, born elsewhere (%)
Residents speaking English at home - Foreign born (%)
Residents speaking Spanish at home (%)
Residents speaking Spanish at home - Born in the United States (%)
Residents speaking Spanish at home - Native, born elsewhere (%)
Residents speaking Spanish at home - Foreign born (%)
Residents speaking other language at home (%)
Residents speaking other language at home - Born in the United States (%)
Residents speaking other language at home - Native, born elsewhere (%)
Residents speaking other language at home - Foreign born (%)
Marital status - Never married (%)
Marital status - Now married (%)
Marital status - Separated (%)
Marital status - Widowed (%)
Marital status - Divorced (%)
Ancestries Reported - Arab (%)
Ancestries Reported - Czech (%)
Ancestries Reported - Danish (%)
Ancestries Reported - Dutch (%)
Ancestries Reported - English (%)
Ancestries Reported - French (%)
Ancestries Reported - French Canadian (%)
Ancestries Reported - German (%)
Ancestries Reported - Greek (%)
Ancestries Reported - Hungarian (%)
Ancestries Reported - Irish (%)
Ancestries Reported - Italian (%)
Ancestries Reported - Lithuanian (%)
Ancestries Reported - Norwegian (%)
Ancestries Reported - Polish (%)
Ancestries Reported - Portuguese (%)
Ancestries Reported - Russian (%)
Ancestries Reported - Scotch-Irish (%)
Ancestries Reported - Scottish (%)
Ancestries Reported - Slovak (%)
Ancestries Reported - Subsaharan African (%)
Ancestries Reported - Swedish (%)
Ancestries Reported - Swiss (%)
Ancestries Reported - Ukrainian (%)
Ancestries Reported - United States (%)
Ancestries Reported - Welsh (%)
Ancestries Reported - West Indian (%)
Ancestries Reported - Other (%)
Geographical mobility - Same house 1 year ago (%)
Geographical mobility - Same house 1 year ago (%) - White
Geographical mobility - Same house 1 year ago (%) - Black or African American
Geographical mobility - Same house 1 year ago (%) - Asian
Geographical mobility - Same house 1 year ago (%) - Hispanic or Latino
Geographical mobility - Same house 1 year ago (%) - American Indian and Alaska Native
Geographical mobility - Same house 1 year ago (%) - Multirace
Geographical mobility - Same house 1 year ago (%) - Other Race
Geographical mobility - Moved within same county (%)
Geographical mobility - Moved within same county (%) - White
Geographical mobility - Moved within same county (%) - Black or African American
Geographical mobility - Moved within same county (%) - Asian
Geographical mobility - Moved within same county (%) - Hispanic or Latino
Geographical mobility - Moved within same county (%) - American Indian and Alaska Native
Geographical mobility - Moved within same county (%) - Multirace
Geographical mobility - Moved within same county (%) - Other Race
Geographical mobility - Moved from different county within same state (%)
Geographical mobility - Moved from different county within same state (%) - White
Geographical mobility - Moved from different county within same state (%) - Black or African American
Geographical mobility - Moved from different county within same state (%) - Asian
Geographical mobility - Moved from different county within same state (%) - Hispanic or Latino
Geographical mobility - Moved from different county within same state (%) - American Indian and Alaska Native
Geographical mobility - Moved from different county within same state (%) - Multirace
Geographical mobility - Moved from different county within same state (%) - Other Race
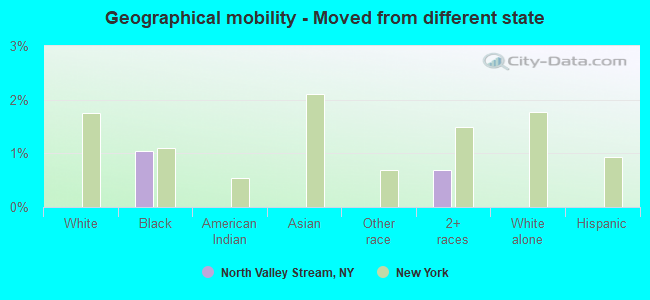
Geographical mobility - Moved from different state (%)
Geographical mobility - Moved from different state (%) - White
Geographical mobility - Moved from different state (%) - Black or African American
Geographical mobility - Moved from different state (%) - Asian
Geographical mobility - Moved from different state (%) - Hispanic or Latino
Geographical mobility - Moved from different state (%) - American Indian and Alaska Native
Geographical mobility - Moved from different state (%) - Multirace
Geographical mobility - Moved from different state (%) - Other Race
Geographical mobility - Moved from abroad (%)
Geographical mobility - Moved from abroad (%) - White
Geographical mobility - Moved from abroad (%) - Black or African American
Geographical mobility - Moved from abroad (%) - Asian
Geographical mobility - Moved from abroad (%) - Hispanic or Latino
Geographical mobility - Moved from abroad (%) - American Indian and Alaska Native
Geographical mobility - Moved from abroad (%) - Multirace
Geographical mobility - Moved from abroad (%) - Other Race
Place of birth for the foreign-born population - Ireland (%)
Place of birth for the foreign-born population - Denmark (%)
Place of birth for the foreign-born population - Norway (%)
Place of birth for the foreign-born population - Sweden (%)
Place of birth for the foreign-born population - United Kingdom (%)
Place of birth for the foreign-born population - England (%)
Place of birth for the foreign-born population - Scotland (%)
Place of birth for the foreign-born population - Other Northern Europe (%)
Place of birth for the foreign-born population - Austria (%)
Place of birth for the foreign-born population - Belgium (%)
Place of birth for the foreign-born population - France (%)
Place of birth for the foreign-born population - Germany (%)
Place of birth for the foreign-born population - Netherlands (%)
Place of birth for the foreign-born population - Switzerland (%)
Place of birth for the foreign-born population - Other Western Europe (%)
Place of birth for the foreign-born population - Greece (%)
Place of birth for the foreign-born population - Italy (%)
Place of birth for the foreign-born population - Portugal (%)
Place of birth for the foreign-born population - Spain (%)
Place of birth for the foreign-born population - Other Southern Europe (%)
Place of birth for the foreign-born population - Albania (%)
Place of birth for the foreign-born population - Belarus (%)
Place of birth for the foreign-born population - Bosnia and Herzegovina (%)
Place of birth for the foreign-born population - Bulgaria (%)
Place of birth for the foreign-born population - Croatia (%)
Place of birth for the foreign-born population - Czechoslovakia (%)
Place of birth for the foreign-born population - Hungary (%)
Place of birth for the foreign-born population - Latvia (%)
Place of birth for the foreign-born population - Lithuania (%)
Place of birth for the foreign-born population - North Macedonia (Macedonia) (%)
Place of birth for the foreign-born population - Moldova (%)
Place of birth for the foreign-born population - Poland (%)
Place of birth for the foreign-born population - Romania (%)
Place of birth for the foreign-born population - Russia (%)
Place of birth for the foreign-born population - Serbia (%)
Place of birth for the foreign-born population - Ukraine (%)
Place of birth for the foreign-born population - Other Eastern Europe (%)
Place of birth for the foreign-born population - China (%)
Place of birth for the foreign-born population - Hong Kong (%)
Place of birth for the foreign-born population - Taiwan (%)
Place of birth for the foreign-born population - Japan (%)
Place of birth for the foreign-born population - Korea (%)
Place of birth for the foreign-born population - Other Eastern Asia (%)
Place of birth for the foreign-born population - Afghanistan (%)
Place of birth for the foreign-born population - Bangladesh (%)
Place of birth for the foreign-born population - India (%)
Place of birth for the foreign-born population - Iran (%)
Place of birth for the foreign-born population - Kazakhstan (%)
Place of birth for the foreign-born population - Nepal (%)
Place of birth for the foreign-born population - Pakistan (%)
Place of birth for the foreign-born population - Sri Lanka (%)
Place of birth for the foreign-born population - Uzbekistan (%)
Place of birth for the foreign-born population - Other South Central Asia (%)
Place of birth for the foreign-born population - Burma (%)
Place of birth for the foreign-born population - Cambodia (%)
Place of birth for the foreign-born population - Indonesia (%)
Place of birth for the foreign-born population - Laos (%)
Place of birth for the foreign-born population - Malaysia (%)
Place of birth for the foreign-born population - Philippines (%)
Place of birth for the foreign-born population - Singapore (%)
Place of birth for the foreign-born population - Thailand (%)
Place of birth for the foreign-born population - Vietnam (%)
Place of birth for the foreign-born population - Other South Eastern Asia (%)
Place of birth for the foreign-born population - Armenia (%)
Place of birth for the foreign-born population - Iraq (%)
Place of birth for the foreign-born population - Israel (%)
Place of birth for the foreign-born population - Jordan (%)
Place of birth for the foreign-born population - Kuwait (%)
Place of birth for the foreign-born population - Lebanon (%)
Place of birth for the foreign-born population - Saudi Arabia (%)
Place of birth for the foreign-born population - Syria (%)
Place of birth for the foreign-born population - Turkey (%)
Place of birth for the foreign-born population - Yemen (%)
Place of birth for the foreign-born population - Other Western Asia (%)
Place of birth for the foreign-born population - Eritrea (%)
Place of birth for the foreign-born population - Ethiopia (%)
Place of birth for the foreign-born population - Kenya (%)
Place of birth for the foreign-born population - Somalia (%)
Place of birth for the foreign-born population - Uganda (%)
Place of birth for the foreign-born population - Zimbabwe (%)
Place of birth for the foreign-born population - Other Eastern Africa (%)
Place of birth for the foreign-born population - Cameroon (%)
Place of birth for the foreign-born population - Congo (%)
Place of birth for the foreign-born population - Democratic Republic of Congo (Zaire) (%)
Place of birth for the foreign-born population - Other Middle Africa (%)
Place of birth for the foreign-born population - Egypt (%)
Place of birth for the foreign-born population - Morocco (%)
Place of birth for the foreign-born population - Sudan (%)
Place of birth for the foreign-born population - Other Northern Africa (%)
Place of birth for the foreign-born population - South Africa (%)
Place of birth for the foreign-born population - Other Southern Africa (%)
Place of birth for the foreign-born population - Cabo Verde (%)
Place of birth for the foreign-born population - Ghana (%)
Place of birth for the foreign-born population - Liberia (%)
Place of birth for the foreign-born population - Nigeria (%)
Place of birth for the foreign-born population - Senegal (%)
Place of birth for the foreign-born population - Sierra Leone (%)
Place of birth for the foreign-born population - Other Western Africa (%)
Place of birth for the foreign-born population - Australia (%)
Place of birth for the foreign-born population - New Zealand (%)
Place of birth for the foreign-born population - Fiji (%)
Place of birth for the foreign-born population - Micronesia (%)
Place of birth for the foreign-born population - Bahamas (%)
Place of birth for the foreign-born population - Barbados (%)
Place of birth for the foreign-born population - Cuba (%)
Place of birth for the foreign-born population - Dominica (%)
Place of birth for the foreign-born population - Dominican Republic (%)
Place of birth for the foreign-born population - Grenada (%)
Place of birth for the foreign-born population - Haiti (%)
Place of birth for the foreign-born population - Jamaica (%)
Place of birth for the foreign-born population - St. Vincent and the Grenadines (%)
Place of birth for the foreign-born population - Trinidad and Tobago (%)
Place of birth for the foreign-born population - West Indies (%)
Place of birth for the foreign-born population - Other Caribbean (%)
Place of birth for the foreign-born population - Belize (%)
Place of birth for the foreign-born population - Costa Rica (%)
Place of birth for the foreign-born population - El Salvador (%)
Place of birth for the foreign-born population - Guatemala (%)
Place of birth for the foreign-born population - Honduras (%)
Place of birth for the foreign-born population - Mexico (%)
Place of birth for the foreign-born population - Nicaragua (%)
Place of birth for the foreign-born population - Panama (%)
Place of birth for the foreign-born population - Other Central America (%)
Place of birth for the foreign-born population - Argentina (%)
Place of birth for the foreign-born population - Bolivia (%)
Place of birth for the foreign-born population - Brazil (%)
Place of birth for the foreign-born population - Chile (%)
Place of birth for the foreign-born population - Colombia (%)
Place of birth for the foreign-born population - Ecuador (%)
Place of birth for the foreign-born population - Guyana (%)
Place of birth for the foreign-born population - Peru (%)
Place of birth for the foreign-born population - Uruguay (%)
Place of birth for the foreign-born population - Venezuela (%)
Place of birth for the foreign-born population - Other South America (%)
Place of birth for the foreign-born population - Canada (%)
Place of birth for the foreign-born population - Other Northern America (%)
Place of birth for the foreign-born population - Other (%)
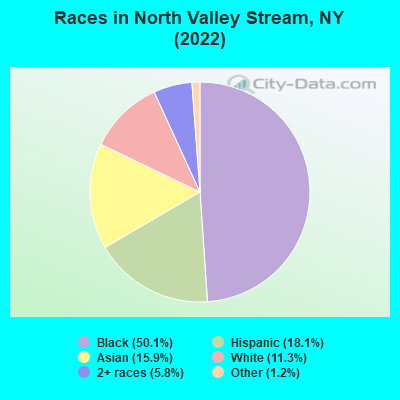
According to 2022 data, the most numerous races in North Valley Stream, NY are White alone (2,146 residents), Hispanic (3,422 residents), and Black alone (9,497 residents). 65.7% of North Valley Stream residents speak English at home. 35.2% of North Valley Stream, NY residents are foreign-born (26.6% born in Latin America, 7.2% born in Asia), which is 37.6% greater than the foreign-born rate of 22.0% across the entire state of New York.
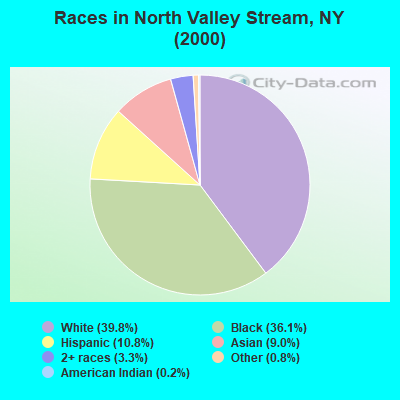
Race distribution in North Valley Stream
2000 2022
11,760,981 62.0% White alone 2,867,583 15.1% Hispanic 2,812,623 14.8% Black alone 1,035,926 5.5% Asian alone 366,116 1.9% Two or more races 75,499 0.4% Other race alone 52,499 0.3% American Indian alone 5,230 0.03% Native Hawaiian and Other
10,408,933 52.9% White alone 3,867,299 19.7% Hispanic 2,633,840 13.4% Black alone 1,776,286 9.0% Asian alone 732,670 3.7% Two or more races 216,110 1.1% Other race alone 35,082 0.2% American Indian alone 6,931 0.04% Native Hawaiian and Other
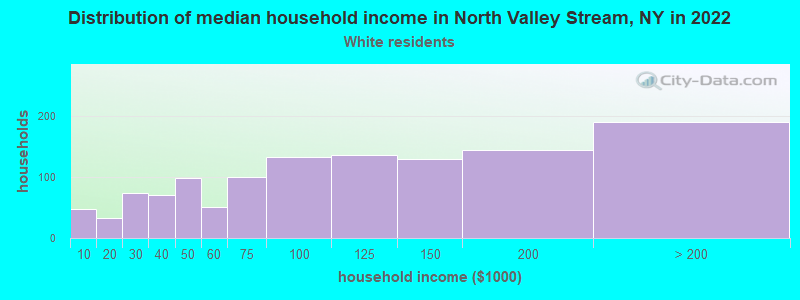
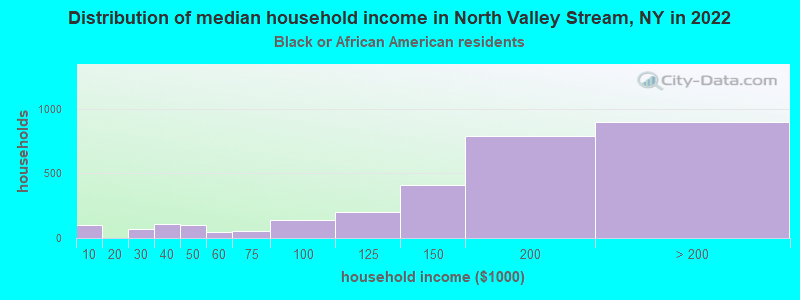
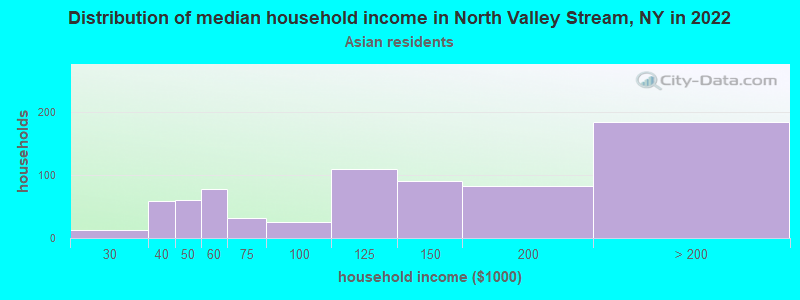
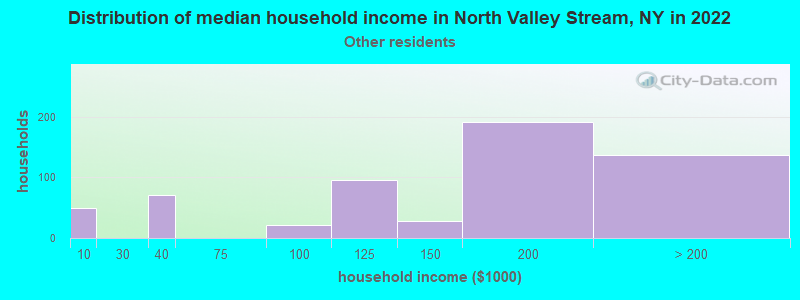
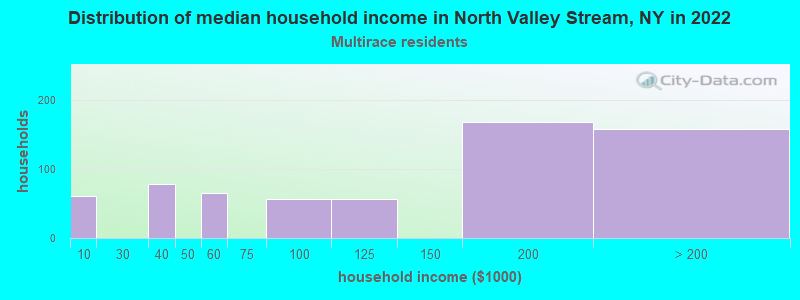
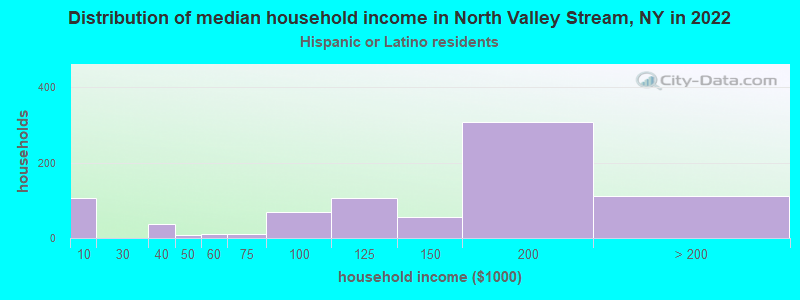
Income and house value in North Valley Stream Median household income in 2022 $86,627 White non-Hispanic householders$164,199 Black householders$122,198 Asian householders$159,221 Some other race householders$159,833 Two or more races householders$148,282 Hispanic or Latino race householdersMedian 2022 house value $586,664 White Non-Hispanic householders$601,817 Black or African American householders$536,060 American Indian or Alaska Native householders $578,087 Asian householders$624,403 Some other race householders$582,661 Two or more races householders$613,539 Hispanic or Latino householders
Median age by race in North Valley Stream
55.5 Median age for White residents47.9 61.1 41.4 Median age for Black or African American residents33.3 45.9 -855,158,729.3 Median age for American Indian / Alaska Native residents-607,543,322.5 -837,121,211.3 38.8 Median age for Asian residents37.1 40.6 -487,992,314.6 Median age for Native Hawaiian / Pacific Islander residents-477,502,295.2 -497,387,669.3 42.6 Median age for Other race residents43.9 34.4 38.6 Median age for Two or more races residents37.8 39.6 60.1 Median age for White alone residents56.6 65.9 39.6 Median age for Hispanic or Latino residents27.2 41.5
Owner/renter occupied households by race in North Valley Stream
House owners and renters - White residents 1,057 89.6% Owner occupied123 10.4% Renter occupiedHouse owners and renters - Black or African American residents 2,738 96.5% Owner occupied100 3.5% Renter occupiedHouse owners and renters - American Indian / Alaska Native residents 25 100.0% Owner occupiedHouse owners and renters - Asian residents 686 94.2% Owner occupied42 5.8% Renter occupiedHouse owners and renters - Other race residents 543 90.3% Owner occupied58 9.7% Renter occupiedHouse owners and renters - Two or more races residents 606 100.0% Owner occupiedHouse owners and renters - White alone residents 972 90.3% Owner occupied104 9.7% Renter occupiedHouse owners and renters - Hispanic or Latino residents 710 89.9% Owner occupied80 10.1% Renter occupied
Language usage in North Valley Stream
English speakers - Total 65.7% of residents of North Valley Stream speak English at home.
8.6% of residents speak Spanish at home 988 63.0% Speak English very well581 37.0% Speak English less than very well26.2% of residents speak other language at home 3,331 70.2% Speak English very well1,414 29.8% Speak English less than very well
English speakers - Born in the United States 90.8% of residents of North Valley Stream speak English at home.
7.0% of residents speak other language at home 53 100.0% Speak English very well
English speakers - Native, born elsewhere 33.5% of residents of North Valley Stream speak English at home.
36.1% of residents speak Spanish at home 52 54.2% Speak English very well44 45.8% Speak English less than very well30.8% of residents speak other language at home 82 100.0% Speak English very well
English speakers - Foreign-born 42.5% of residents of North Valley Stream speak English at home.
12.6% of residents speak Spanish at home 319 36.8% Speak English very well547 63.2% Speak English less than very well44.0% of residents speak other language at home 1,761 58.2% Speak English very well1,264 41.8% Speak English less than very well
White (Caucasian) - Speak only English Native:
90.1% (2,078)Foreign-born:
41.9% (189)
White (Caucasian) - Speak another language Native:
9.2% (211)Foreign-born:
60.8% (274)
Black or African American - Speak only English Native:
84.6% (4,742)Foreign-born:
58.4% (2,023)
Black or African American - Speak another language Native:
15.8% (888)Foreign-born:
41.6% (1,440)
Asian - Speak only English Native:
34.6% (419)Foreign-born:
10.2% (165)
Asian - Speak another language Native:
64.4% (779)Foreign-born:
90.3% (1,466)
Other race - Speak only English Native:
90.3% (1,123)Foreign-born:
36.9% (145)
Other race - Speak another language Native:
17.5% (218)Foreign-born:
54.0% (212)
Two or more races - Speak only English Native:
67.2% (1,170)Foreign-born:
44.1% (466)
Two or more races - Speak another language Native:
32.5% (566)Foreign-born:
51.9% (549)
White alone - Speak only English Native:
94.6% (1,869)Foreign-born:
47.2% (83)
White alone - Speak another language Native:
5.4% (107)Foreign-born:
52.4% (92)
Hispanic or Latino - Speak only English Native:
63.7% (1,350)Foreign-born:
25.8% (274)
Hispanic or Latino - Speak another language Native:
35.9% (762)Foreign-born:
74.2% (786)
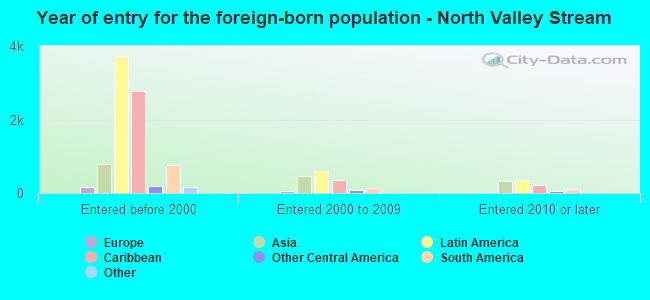
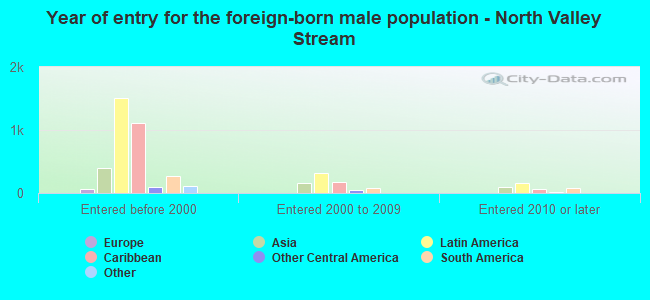
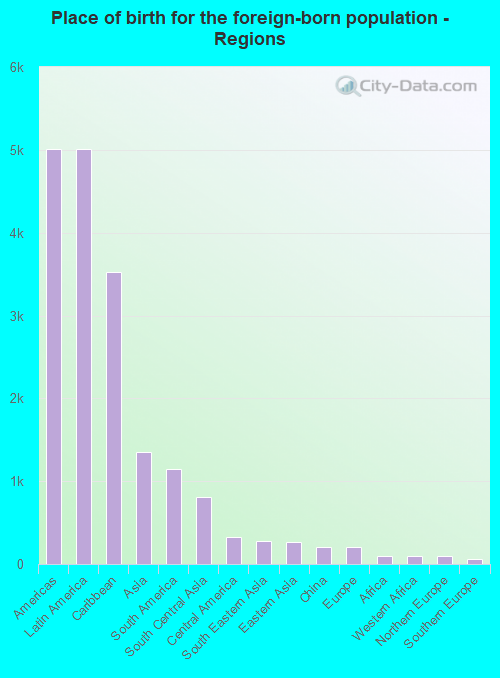
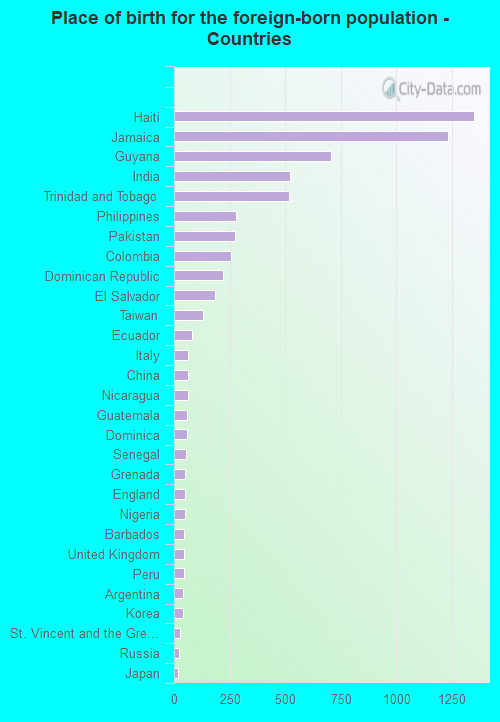
Foreign-born residents in North Valley Stream 6,675 residents are foreign born (26.6% Latin America , 7.2% Asia ).
This city:
35.2%New York:
22.6%
Marital status for residents in North Valley Stream Marital status - White (Caucasian) population 15 years and over
Males 44.8% Never married43.4% Now married0.0% Separated7.3% Widowed4.5% DivorcedFemales 25.8% Never married42.3% Now married0.5% Separated19.6% Widowed11.8% DivorcedWomen who gave birth in the past 12 months Now married:
100.0% (32)Unmarried:
0.0% (0)
Women who did not give birth in the past 12 months Now married:
43.6% (210)Unmarried:
56.4% (272)
Marital status - Black or African American population 15 years and over
Males 48.1% Never married43.7% Now married0.6% Separated2.2% Widowed5.4% DivorcedFemales 37.3% Never married42.1% Now married2.3% Separated8.8% Widowed9.5% DivorcedWomen who gave birth in the past 12 months Now married:
50.3% (72)Unmarried:
49.7% (71)
Women who did not give birth in the past 12 months Now married:
32.2% (637)Unmarried:
67.8% (1,343)
Marital status - Asian population 15 years and over
Males 35.6% Never married61.1% Now married0.0% Separated2.1% Widowed1.1% DivorcedFemales 40.8% Never married44.6% Now married4.1% Separated9.1% Widowed1.4% DivorcedWomen who gave birth in the past 12 months Now married:
100.0% (32)Unmarried:
0.0% (0)
Women who did not give birth in the past 12 months Now married:
28.9% (192)Unmarried:
71.1% (471)
Marital status - Other race population 15 years and over
Males 44.4% Never married55.5% Now married0.0% Separated0.0% Widowed0.2% DivorcedFemales 41.4% Never married40.7% Now married0.0% Separated9.0% Widowed8.8% DivorcedWomen who gave birth in the past 12 months Now married:
14.7% (11)Unmarried:
85.3% (66)
Women who did not give birth in the past 12 months Now married:
39.6% (164)Unmarried:
60.4% (250)
Marital status - Two or more races population 15 years and over
Males 32.4% Never married62.1% Now married3.0% Separated0.0% Widowed2.5% DivorcedFemales 37.6% Never married34.2% Now married6.3% Separated5.1% Widowed16.8% DivorcedWomen who gave birth in the past 12 months Now married:
100.0% (12)Unmarried:
0.0% (0)
Women who did not give birth in the past 12 months Now married:
27.7% (243)Unmarried:
72.3% (635)
Marital status - White alone, not Hispanic / Latino population 15 years and over
Males 31.5% Never married53.6% Now married0.0% Separated10.2% Widowed4.7% DivorcedFemales 29.8% Never married35.5% Now married0.7% Separated20.3% Widowed13.8% DivorcedWomen who gave birth in the past 12 months Now married:
100.0% (34)Unmarried:
0.0% (0)
Women who did not give birth in the past 12 months Now married:
16.2% (55)Unmarried:
83.8% (285)
Marital status - Hispanic or Latino population 15 years and over
Males 52.1% Never married44.7% Now married0.0% Separated0.6% Widowed2.6% DivorcedFemales 30.1% Never married47.8% Now married3.6% Separated8.7% Widowed9.8% DivorcedWomen who gave birth in the past 12 months Now married:
23.7% (18)Unmarried:
76.3% (58)
Women who did not give birth in the past 12 months Now married:
59.5% (432)Unmarried:
40.5% (295)
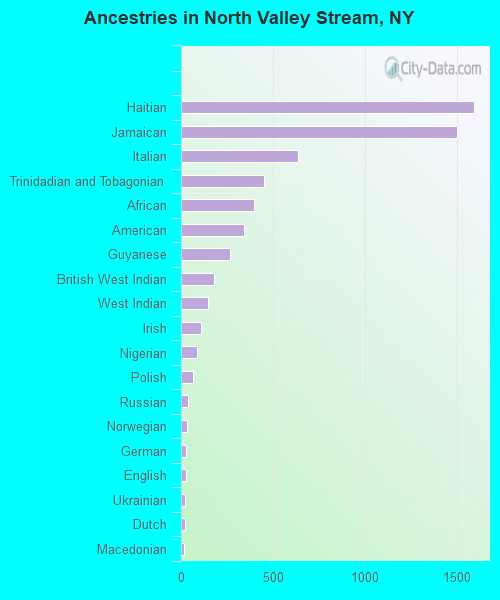
Ancestries in North Valley Stream
1,595 15.4% Haitian1,503 14.5% Jamaican634 6.1% Italian454 4.4% Trinidadian and Tobagonian396 3.8% African342 3.3% American266 2.6% Guyanese181 1.7% British West Indian149 1.4% West Indian108 1.0% Irish88 0.8% Nigerian65 0.6% Polish40 0.4% Russian32 0.3% Norwegian29 0.3% German25 0.2% English22 0.2% Ukrainian21 0.2% Dutch18 0.2% Macedonian9 0.09% Scotch-Irish9 0.09% Belizean8 0.08% Maltese7 0.07% European7 0.07% Greek6 0.06% Afghan5 0.05% Barbadian
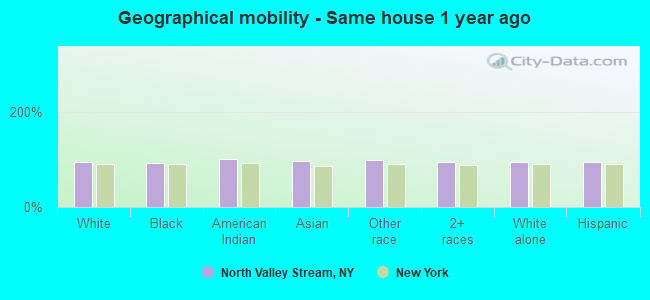
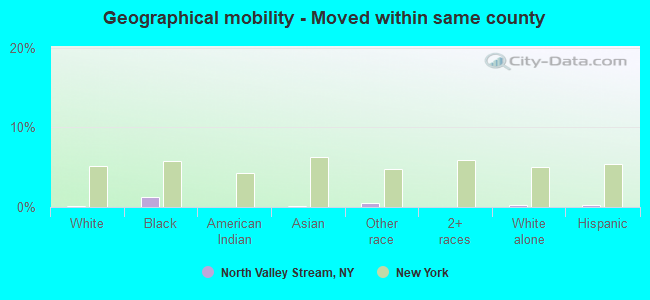
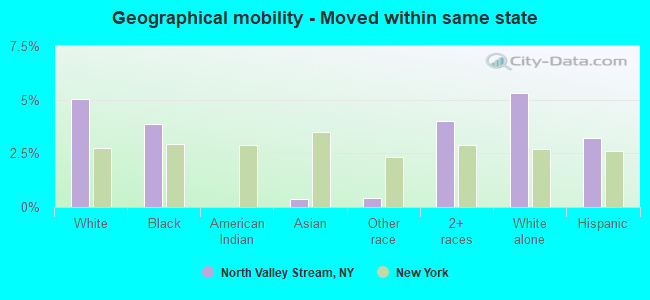
Geographical mobility in North Valley Stream Same house 1 year ago 2,667 94.8% White (Caucasian)8,756 93.1% Black or African American25 100.0% American Indian / Alaska Native2,934 97.3% Asian1,662 98.7% Other race2,801 94.1% Two or more races2,030 94.5% White alone, not Hispanic / Latino3,194 95.4% Hispanic or LatinoMoved within same county 4 0.1% White / Caucasian113 1.2% Black or African American3 0.1% Asian9 0.6% Other race4 0.2% White alone, not Hispanic / Latino8 0.2% Hispanic or LatinoMoved within same state 142 5.0% White / Caucasian364 3.9% Black or African American11 0.4% Asian7 0.4% Other race119 4.0% Two or more races114 5.3% White alone, not Hispanic / Latino108 3.2% Hispanic or LatinoMoved from different state 98 1.0% Black or African American21 0.7% Two or more races
Children Nativity (place of birth) in North Valley Stream
Children under 6 years - Living with two parents Both parents native 341 100.0% NativeBoth parents foreign-born 153 100.0% NativeOne native, one foreign-born parent 57 100.0% NativeChildren under 6 years - Living with one parent Native parent 223 100.0% NativeForeign-born parent 61 57.5% Native45 42.5% Foreign-bornChildren 6 to 17 years - Living with two parents Both parents native 490 100.0% NativeBoth parents foreign-born 866 94.6% Native49 5.4% Foreign-bornOne native, one foreign-born parent 116 100.0% NativeChildren 6 to 17 years - Living with one parent Native parent 482 100.0% NativeForeign-born parent 462 48.4% Native492 51.6% Foreign-born
Grandparents responsible for own grandchildren in North Valley Stream
Grandparents (30 to 59 years) Black or African American 96 83.7% Responsible for grandchildren19 16.3% Not responsible for grandchildrenAsian 8 8.4% Responsible for grandchildren82 91.6% Not responsible for grandchildrenTwo or more races 18 100.0% Responsible for grandchildren
Grandparents (60 years and over) Black or African American 19 2.7% Responsible for grandchildren683 97.3% Not responsible for grandchildrenAsian 111 100.0% Not responsible for grandchildrenTwo or more races 178 100.0% Not responsible for grandchildren