Races in Olmsted Falls, Ohio (OH) Detailed Stats
Data:
Races - White alone (%)
Races - White alone (% change since 2000)
Races - Black alone (%)
Races - Black alone (% change since 2000)
Races - American Indian alone (%)
Races - American Indian alone (% change since 2000)
Races - Asian alone (%)
Races - Asian alone (% change since 2000)
Races - Hispanic (%)
Races - Hispanic (% change since 2000)
Races - Native Hawaiian and Other Pacific Islander alone (%)
Races - Native Hawaiian and Other Pacific Islander alone (% change since 2000)
Races - Two or more races(%)
Races - Two or more races(% change since 2000)
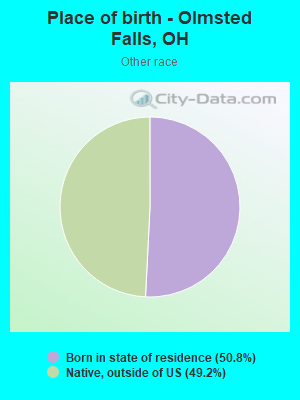
Races - Other race alone (%)
Races - Other race alone (% change since 2000)
Racial diversity
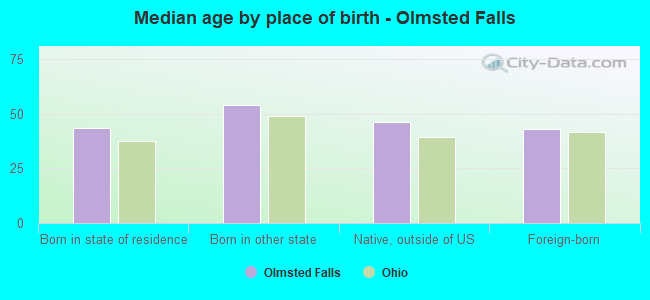
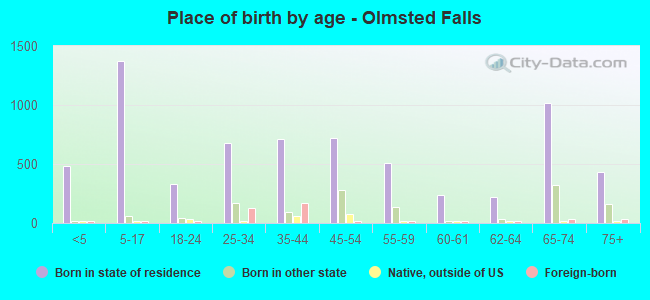
Place of birth - Born in state of residence (%)
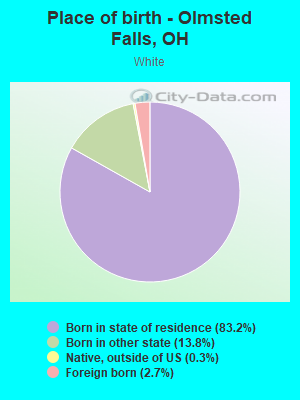
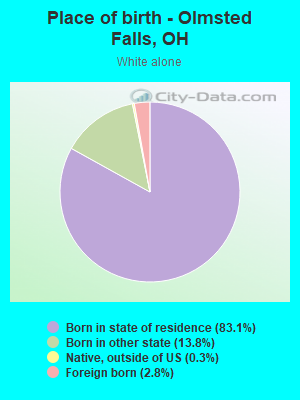
Place of birth - Born in state of residence (%) - White
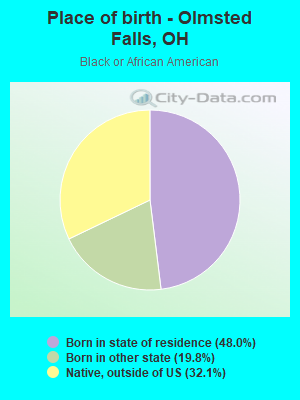
Place of birth - Born in state of residence (%) - Black or African American
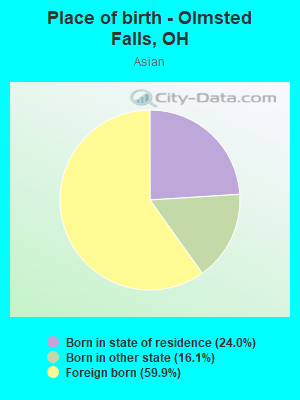
Place of birth - Born in state of residence (%) - Asian
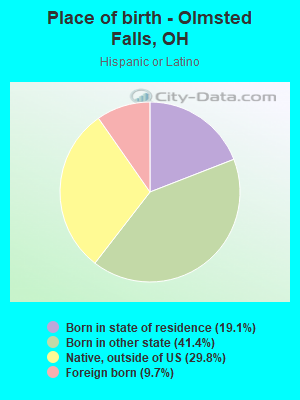
Place of birth - Born in state of residence (%) - Hispanic or Latino
Place of birth - Born in state of residence (%) - American Indian and Alaska Native
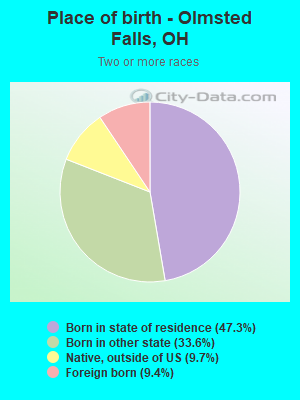
Place of birth - Born in state of residence (%) - Multirace
Place of birth - Born in state of residence (%) - Other Race
Place of birth - Born in other state (%)
Place of birth - Born in other state (%) - White
Place of birth - Born in other state (%) - Black or African American
Place of birth - Born in other state (%) - Asian
Place of birth - Born in other state (%) - Hispanic or Latino
Place of birth - Born in other state (%) - American Indian and Alaska Native
Place of birth - Born in other state (%) - Multirace
Place of birth - Born in other state (%) - Other Race
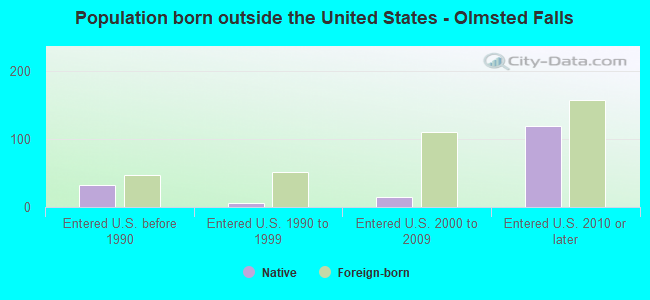
Place of birth - Native, outside of US (%)
Place of birth - Native, outside of US (%) - White
Place of birth - Native, outside of US (%) - Black or African American
Place of birth - Native, outside of US (%) - Asian
Place of birth - Native, outside of US (%) - Hispanic or Latino
Place of birth - Native, outside of US (%) - American Indian and Alaska Native
Place of birth - Native, outside of US (%) - Multirace
Place of birth - Native, outside of US (%) - Other Race
Place of birth - Foreign born (%)
Place of birth - Foreign born (%) - White
Place of birth - Foreign born (%) - Black or African American
Place of birth - Foreign born (%) - Asian
Place of birth - Foreign born (%) - Hispanic or Latino
Place of birth - Foreign born (%) - American Indian and Alaska Native
Place of birth - Foreign born (%) - Multirace
Place of birth - Foreign born (%) - Other Race
Residents speaking English at home (%)
Residents speaking English at home - Born in the United States (%)
Residents speaking English at home - Native, born elsewhere (%)
Residents speaking English at home - Foreign born (%)
Residents speaking Spanish at home (%)
Residents speaking Spanish at home - Born in the United States (%)
Residents speaking Spanish at home - Native, born elsewhere (%)
Residents speaking Spanish at home - Foreign born (%)
Residents speaking other language at home (%)
Residents speaking other language at home - Born in the United States (%)
Residents speaking other language at home - Native, born elsewhere (%)
Residents speaking other language at home - Foreign born (%)
Marital status - Never married (%)
Marital status - Now married (%)
Marital status - Separated (%)
Marital status - Widowed (%)
Marital status - Divorced (%)
Ancestries Reported - Arab (%)
Ancestries Reported - Czech (%)
Ancestries Reported - Danish (%)
Ancestries Reported - Dutch (%)
Ancestries Reported - English (%)
Ancestries Reported - French (%)
Ancestries Reported - French Canadian (%)
Ancestries Reported - German (%)
Ancestries Reported - Greek (%)
Ancestries Reported - Hungarian (%)
Ancestries Reported - Irish (%)
Ancestries Reported - Italian (%)
Ancestries Reported - Lithuanian (%)
Ancestries Reported - Norwegian (%)
Ancestries Reported - Polish (%)
Ancestries Reported - Portuguese (%)
Ancestries Reported - Russian (%)
Ancestries Reported - Scotch-Irish (%)
Ancestries Reported - Scottish (%)
Ancestries Reported - Slovak (%)
Ancestries Reported - Subsaharan African (%)
Ancestries Reported - Swedish (%)
Ancestries Reported - Swiss (%)
Ancestries Reported - Ukrainian (%)
Ancestries Reported - United States (%)
Ancestries Reported - Welsh (%)
Ancestries Reported - West Indian (%)
Ancestries Reported - Other (%)
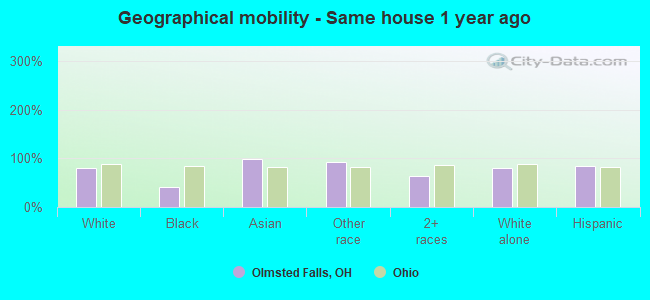
Geographical mobility - Same house 1 year ago (%)
Geographical mobility - Same house 1 year ago (%) - White
Geographical mobility - Same house 1 year ago (%) - Black or African American
Geographical mobility - Same house 1 year ago (%) - Asian
Geographical mobility - Same house 1 year ago (%) - Hispanic or Latino
Geographical mobility - Same house 1 year ago (%) - American Indian and Alaska Native
Geographical mobility - Same house 1 year ago (%) - Multirace
Geographical mobility - Same house 1 year ago (%) - Other Race
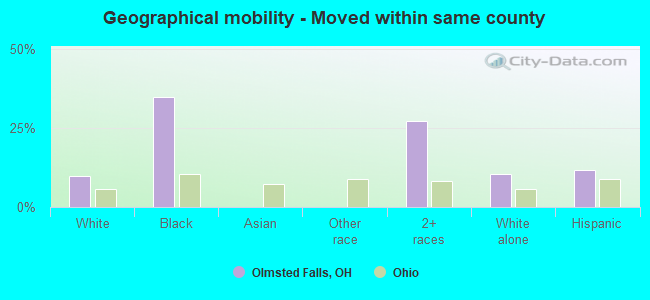
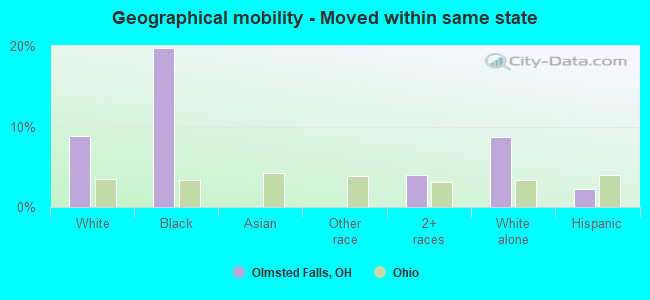
Geographical mobility - Moved within same county (%)
Geographical mobility - Moved within same county (%) - White
Geographical mobility - Moved within same county (%) - Black or African American
Geographical mobility - Moved within same county (%) - Asian
Geographical mobility - Moved within same county (%) - Hispanic or Latino
Geographical mobility - Moved within same county (%) - American Indian and Alaska Native
Geographical mobility - Moved within same county (%) - Multirace
Geographical mobility - Moved within same county (%) - Other Race
Geographical mobility - Moved from different county within same state (%)
Geographical mobility - Moved from different county within same state (%) - White
Geographical mobility - Moved from different county within same state (%) - Black or African American
Geographical mobility - Moved from different county within same state (%) - Asian
Geographical mobility - Moved from different county within same state (%) - Hispanic or Latino
Geographical mobility - Moved from different county within same state (%) - American Indian and Alaska Native
Geographical mobility - Moved from different county within same state (%) - Multirace
Geographical mobility - Moved from different county within same state (%) - Other Race
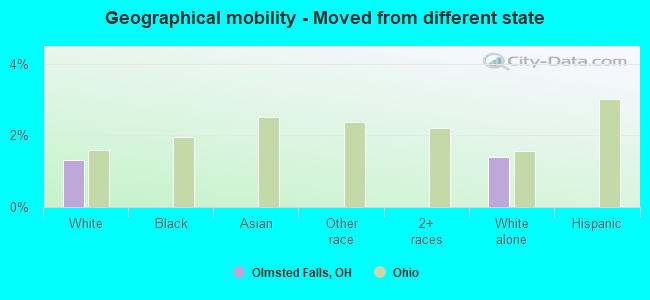
Geographical mobility - Moved from different state (%)
Geographical mobility - Moved from different state (%) - White
Geographical mobility - Moved from different state (%) - Black or African American
Geographical mobility - Moved from different state (%) - Asian
Geographical mobility - Moved from different state (%) - Hispanic or Latino
Geographical mobility - Moved from different state (%) - American Indian and Alaska Native
Geographical mobility - Moved from different state (%) - Multirace
Geographical mobility - Moved from different state (%) - Other Race
Geographical mobility - Moved from abroad (%)
Geographical mobility - Moved from abroad (%) - White
Geographical mobility - Moved from abroad (%) - Black or African American
Geographical mobility - Moved from abroad (%) - Asian
Geographical mobility - Moved from abroad (%) - Hispanic or Latino
Geographical mobility - Moved from abroad (%) - American Indian and Alaska Native
Geographical mobility - Moved from abroad (%) - Multirace
Geographical mobility - Moved from abroad (%) - Other Race
Place of birth for the foreign-born population - Ireland (%)
Place of birth for the foreign-born population - Denmark (%)
Place of birth for the foreign-born population - Norway (%)
Place of birth for the foreign-born population - Sweden (%)
Place of birth for the foreign-born population - United Kingdom (%)
Place of birth for the foreign-born population - England (%)
Place of birth for the foreign-born population - Scotland (%)
Place of birth for the foreign-born population - Other Northern Europe (%)
Place of birth for the foreign-born population - Austria (%)
Place of birth for the foreign-born population - Belgium (%)
Place of birth for the foreign-born population - France (%)
Place of birth for the foreign-born population - Germany (%)
Place of birth for the foreign-born population - Netherlands (%)
Place of birth for the foreign-born population - Switzerland (%)
Place of birth for the foreign-born population - Other Western Europe (%)
Place of birth for the foreign-born population - Greece (%)
Place of birth for the foreign-born population - Italy (%)
Place of birth for the foreign-born population - Portugal (%)
Place of birth for the foreign-born population - Spain (%)
Place of birth for the foreign-born population - Other Southern Europe (%)
Place of birth for the foreign-born population - Albania (%)
Place of birth for the foreign-born population - Belarus (%)
Place of birth for the foreign-born population - Bosnia and Herzegovina (%)
Place of birth for the foreign-born population - Bulgaria (%)
Place of birth for the foreign-born population - Croatia (%)
Place of birth for the foreign-born population - Czechoslovakia (%)
Place of birth for the foreign-born population - Hungary (%)
Place of birth for the foreign-born population - Latvia (%)
Place of birth for the foreign-born population - Lithuania (%)
Place of birth for the foreign-born population - North Macedonia (Macedonia) (%)
Place of birth for the foreign-born population - Moldova (%)
Place of birth for the foreign-born population - Poland (%)
Place of birth for the foreign-born population - Romania (%)
Place of birth for the foreign-born population - Russia (%)
Place of birth for the foreign-born population - Serbia (%)
Place of birth for the foreign-born population - Ukraine (%)
Place of birth for the foreign-born population - Other Eastern Europe (%)
Place of birth for the foreign-born population - China (%)
Place of birth for the foreign-born population - Hong Kong (%)
Place of birth for the foreign-born population - Taiwan (%)
Place of birth for the foreign-born population - Japan (%)
Place of birth for the foreign-born population - Korea (%)
Place of birth for the foreign-born population - Other Eastern Asia (%)
Place of birth for the foreign-born population - Afghanistan (%)
Place of birth for the foreign-born population - Bangladesh (%)
Place of birth for the foreign-born population - India (%)
Place of birth for the foreign-born population - Iran (%)
Place of birth for the foreign-born population - Kazakhstan (%)
Place of birth for the foreign-born population - Nepal (%)
Place of birth for the foreign-born population - Pakistan (%)
Place of birth for the foreign-born population - Sri Lanka (%)
Place of birth for the foreign-born population - Uzbekistan (%)
Place of birth for the foreign-born population - Other South Central Asia (%)
Place of birth for the foreign-born population - Burma (%)
Place of birth for the foreign-born population - Cambodia (%)
Place of birth for the foreign-born population - Indonesia (%)
Place of birth for the foreign-born population - Laos (%)
Place of birth for the foreign-born population - Malaysia (%)
Place of birth for the foreign-born population - Philippines (%)
Place of birth for the foreign-born population - Singapore (%)
Place of birth for the foreign-born population - Thailand (%)
Place of birth for the foreign-born population - Vietnam (%)
Place of birth for the foreign-born population - Other South Eastern Asia (%)
Place of birth for the foreign-born population - Armenia (%)
Place of birth for the foreign-born population - Iraq (%)
Place of birth for the foreign-born population - Israel (%)
Place of birth for the foreign-born population - Jordan (%)
Place of birth for the foreign-born population - Kuwait (%)
Place of birth for the foreign-born population - Lebanon (%)
Place of birth for the foreign-born population - Saudi Arabia (%)
Place of birth for the foreign-born population - Syria (%)
Place of birth for the foreign-born population - Turkey (%)
Place of birth for the foreign-born population - Yemen (%)
Place of birth for the foreign-born population - Other Western Asia (%)
Place of birth for the foreign-born population - Eritrea (%)
Place of birth for the foreign-born population - Ethiopia (%)
Place of birth for the foreign-born population - Kenya (%)
Place of birth for the foreign-born population - Somalia (%)
Place of birth for the foreign-born population - Uganda (%)
Place of birth for the foreign-born population - Zimbabwe (%)
Place of birth for the foreign-born population - Other Eastern Africa (%)
Place of birth for the foreign-born population - Cameroon (%)
Place of birth for the foreign-born population - Congo (%)
Place of birth for the foreign-born population - Democratic Republic of Congo (Zaire) (%)
Place of birth for the foreign-born population - Other Middle Africa (%)
Place of birth for the foreign-born population - Egypt (%)
Place of birth for the foreign-born population - Morocco (%)
Place of birth for the foreign-born population - Sudan (%)
Place of birth for the foreign-born population - Other Northern Africa (%)
Place of birth for the foreign-born population - South Africa (%)
Place of birth for the foreign-born population - Other Southern Africa (%)
Place of birth for the foreign-born population - Cabo Verde (%)
Place of birth for the foreign-born population - Ghana (%)
Place of birth for the foreign-born population - Liberia (%)
Place of birth for the foreign-born population - Nigeria (%)
Place of birth for the foreign-born population - Senegal (%)
Place of birth for the foreign-born population - Sierra Leone (%)
Place of birth for the foreign-born population - Other Western Africa (%)
Place of birth for the foreign-born population - Australia (%)
Place of birth for the foreign-born population - New Zealand (%)
Place of birth for the foreign-born population - Fiji (%)
Place of birth for the foreign-born population - Micronesia (%)
Place of birth for the foreign-born population - Bahamas (%)
Place of birth for the foreign-born population - Barbados (%)
Place of birth for the foreign-born population - Cuba (%)
Place of birth for the foreign-born population - Dominica (%)
Place of birth for the foreign-born population - Dominican Republic (%)
Place of birth for the foreign-born population - Grenada (%)
Place of birth for the foreign-born population - Haiti (%)
Place of birth for the foreign-born population - Jamaica (%)
Place of birth for the foreign-born population - St. Vincent and the Grenadines (%)
Place of birth for the foreign-born population - Trinidad and Tobago (%)
Place of birth for the foreign-born population - West Indies (%)
Place of birth for the foreign-born population - Other Caribbean (%)
Place of birth for the foreign-born population - Belize (%)
Place of birth for the foreign-born population - Costa Rica (%)
Place of birth for the foreign-born population - El Salvador (%)
Place of birth for the foreign-born population - Guatemala (%)
Place of birth for the foreign-born population - Honduras (%)
Place of birth for the foreign-born population - Mexico (%)
Place of birth for the foreign-born population - Nicaragua (%)
Place of birth for the foreign-born population - Panama (%)
Place of birth for the foreign-born population - Other Central America (%)
Place of birth for the foreign-born population - Argentina (%)
Place of birth for the foreign-born population - Bolivia (%)
Place of birth for the foreign-born population - Brazil (%)
Place of birth for the foreign-born population - Chile (%)
Place of birth for the foreign-born population - Colombia (%)
Place of birth for the foreign-born population - Ecuador (%)
Place of birth for the foreign-born population - Guyana (%)
Place of birth for the foreign-born population - Peru (%)
Place of birth for the foreign-born population - Uruguay (%)
Place of birth for the foreign-born population - Venezuela (%)
Place of birth for the foreign-born population - Other South America (%)
Place of birth for the foreign-born population - Canada (%)
Place of birth for the foreign-born population - Other Northern America (%)
Place of birth for the foreign-born population - Other (%)
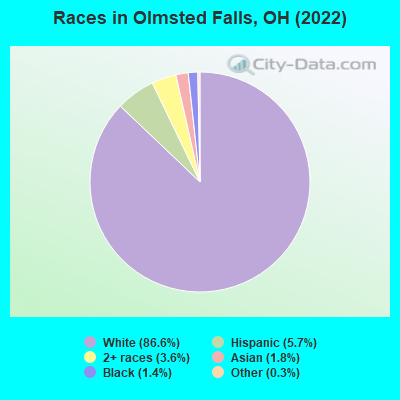
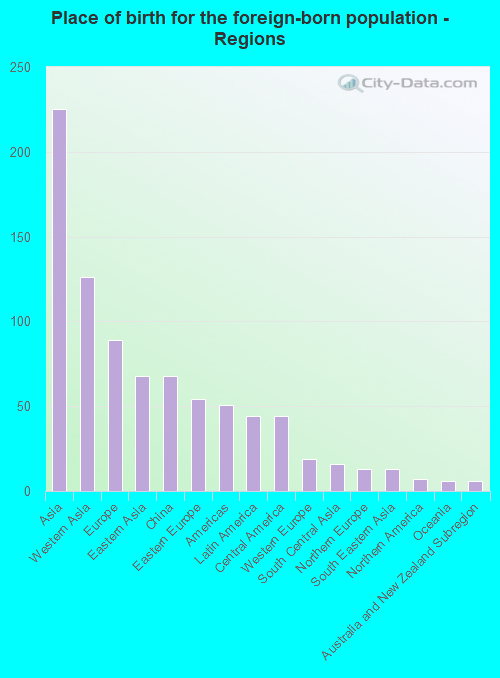
According to 2022 data, the most numerous races in Olmsted Falls, OH are White alone (7,381 residents), Black alone (122 residents), and Two or more races (308 residents). 92.1% of Olmsted Falls residents speak English at home. 4.4% of Olmsted Falls, OH residents are foreign-born (2.5% born in Asia, 1.0% born in Europe, 0.5% born in Latin America), which is 8.1% greater than the foreign-born rate of 4.0% across the entire state of Ohio.
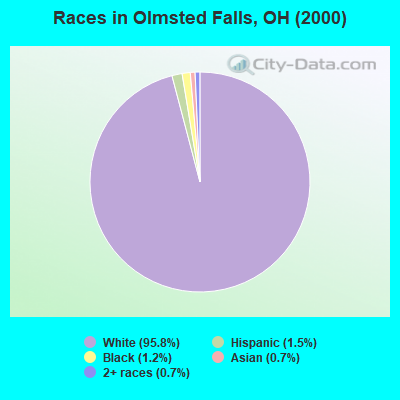
Race distribution in Olmsted Falls
2000 2022
9,538,111 84.0% White alone 1,290,662 11.4% Black alone 217,123 1.9% Hispanic 137,770 1.2% Two or more races 131,670 1.2% Asian alone 21,985 0.2% American Indian alone 13,483 0.1% Other race alone 2,336 0.02% Native Hawaiian and Other
8,948,793 76.1% White alone 1,401,403 11.9% Black alone 529,291 4.5% Two or more races 517,232 4.4% Hispanic 293,387 2.5% Asian alone 52,805 0.4% Other race alone 9,785 0.08% American Indian alone 3,362 0.03% Native Hawaiian and Other
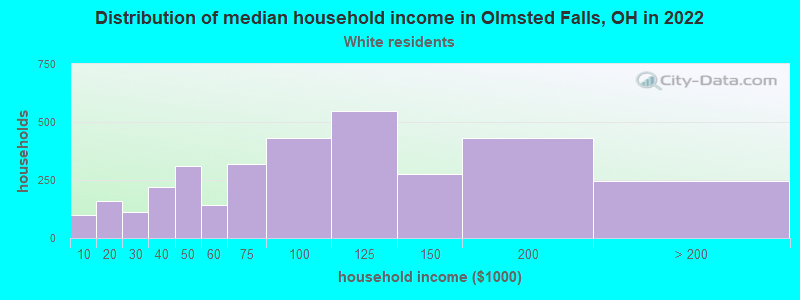
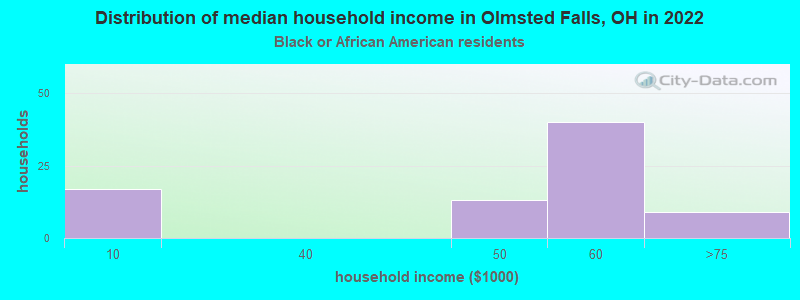
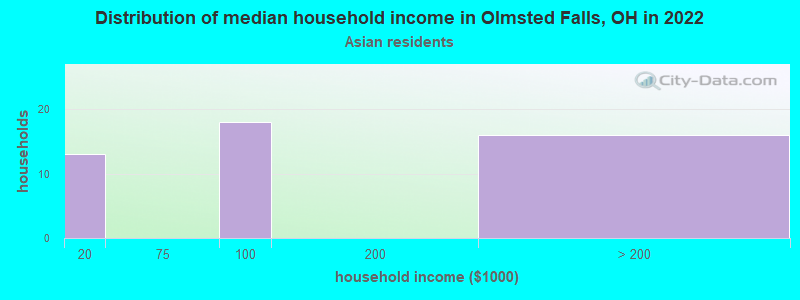
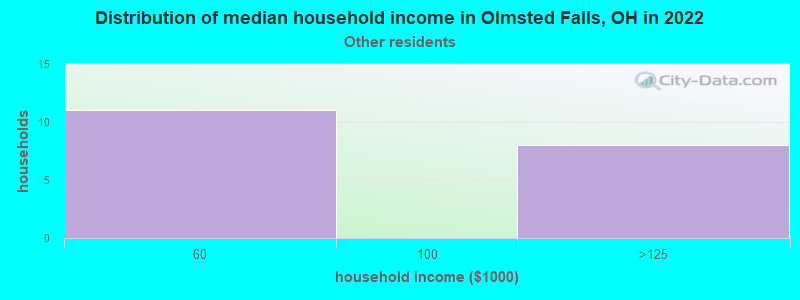
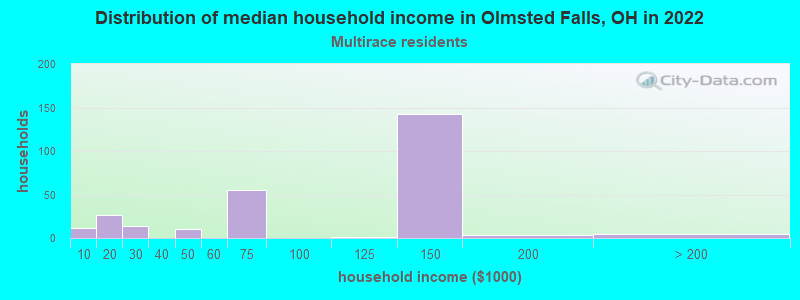
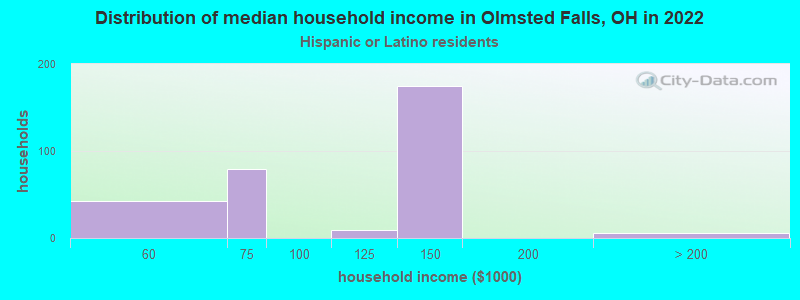
Income and house value in Olmsted Falls Median household income in 2022 $92,005 White non-Hispanic householders$52,614 Black householders$124,911 Two or more races householders$144,369 Hispanic or Latino race householdersMedian 2022 house value $221,386 White Non-Hispanic householders$214,975 Black or African American householders $214,975 Asian householders$323,792 Some other race householders$429,951 Two or more races householders$282,361 Hispanic or Latino householders
Median age by race in Olmsted Falls
46.6 Median age for White residents46.5 46.8 51.7 Median age for Black or African American residents41.8 51.7 -545,601,290.8 Median age for American Indian / Alaska Native residents-734,374,999.3 -499,999,999.5 31.9 Median age for Asian residents32.6 28.3 -706,093,189.3 Median age for Native Hawaiian / Pacific Islander residents-750,242,953.6 -805,394,989.6 20.4 Median age for Other race residents15.5 20.9 38.1 Median age for Two or more races residents50.4 9.4 46.3 Median age for White alone residents46.2 46.5 46.1 Median age for Hispanic or Latino residents45.2 43.8
Owner/renter occupied households by race in Olmsted Falls
House owners and renters - White residents 2,804 85.1% Owner occupied489 14.9% Renter occupiedHouse owners and renters - Black or African American residents 57 72.3% Owner occupied22 27.7% Renter occupiedHouse owners and renters - Asian residents 61 100.0% Owner occupiedHouse owners and renters - Other race residents 13 100.0% Owner occupiedHouse owners and renters - Two or more races residents 284 87.3% Owner occupied41 12.7% Renter occupiedHouse owners and renters - White alone residents 2,795 84.7% Owner occupied505 15.3% Renter occupiedHouse owners and renters - Hispanic or Latino residents 257 100.0% Owner occupied
Language usage in Olmsted Falls
English speakers - Total 92.1% of residents of Olmsted Falls speak English at home.
4.4% of residents speak Spanish at home 228 64.2% Speak English very well127 35.8% Speak English less than very well3.3% of residents speak other language at home 212 80.0% Speak English very well53 20.0% Speak English less than very well
English speakers - Born in the United States 81.8% of residents of Olmsted Falls speak English at home.
11.4% of residents speak Spanish at home 148 100.0% Speak English very well5.4% of residents speak other language at home 70 100.0% Speak English very well
English speakers - Native, born elsewhere 21.4% of residents of Olmsted Falls speak English at home.
79.2% of residents speak Spanish at home 46 34.6% Speak English very well87 65.4% Speak English less than very well
English speakers - Foreign-born 42.0% of residents of Olmsted Falls speak English at home.
14.3% of residents speak Spanish at home 6 11.8% Speak English very well45 88.2% Speak English less than very well43.1% of residents speak other language at home 104 67.5% Speak English very well50 32.5% Speak English less than very well
White (Caucasian) - Speak only English Native:
99.2% (6,683)Foreign-born:
75.8% (150)
White (Caucasian) - Speak another language Native:
1.4% (92)Foreign-born:
25.7% (51)
Asian - Speak another language Native:
44.7% (22)Foreign-born:
99.8% (94)
Two or more races - Speak another language Native:
48.1% (309)Foreign-born:
100.0% (67)
White alone - Speak only English Native:
98.3% (6,645)Foreign-born:
73.7% (152)
White alone - Speak another language Native:
1.5% (103)Foreign-born:
25.9% (53)
Hispanic or Latino - Speak another language Native:
71.5% (317)Foreign-born:
100.0% (47)
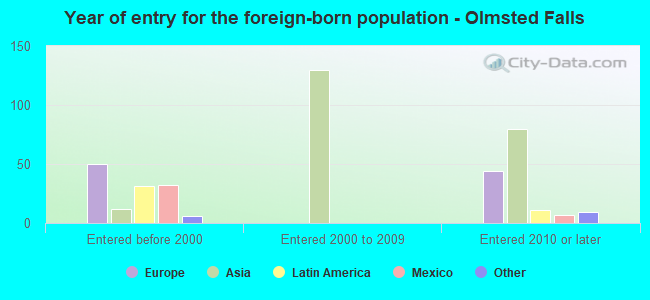
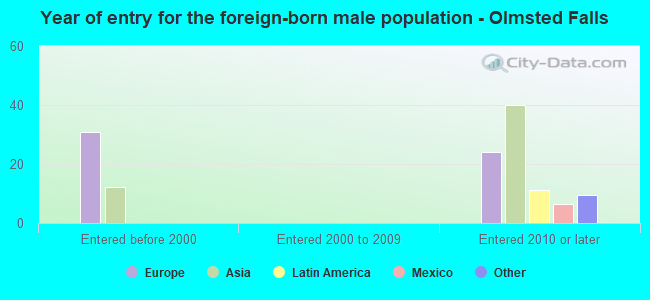
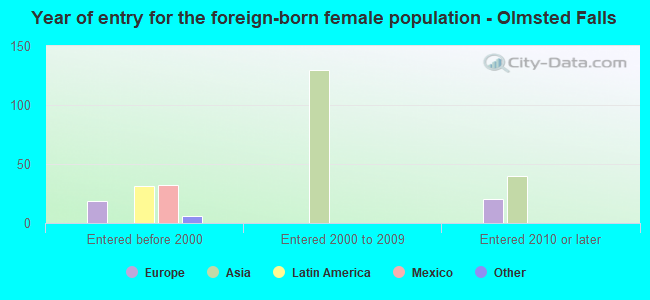
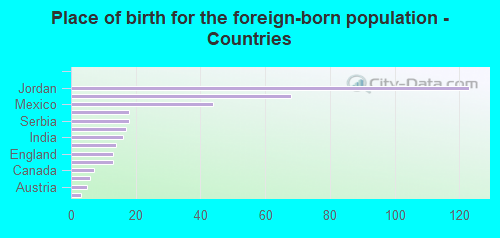
Foreign-born residents in Olmsted Falls 371 residents are foreign born (2.5% Asia , 1.0% Europe , 0.5% Latin America ).
Marital status for residents in Olmsted Falls Marital status - White (Caucasian) population 15 years and over
Males 24.2% Never married61.0% Now married2.2% Separated3.6% Widowed9.0% DivorcedFemales 25.8% Never married46.8% Now married0.0% Separated8.2% Widowed19.2% DivorcedWomen who gave birth in the past 12 months Now married:
100.0% (78)Unmarried:
0.0% (0)
Women who did not give birth in the past 12 months Now married:
40.5% (627)Unmarried:
59.5% (919)
Marital status - Black or African American population 15 years and over
Males 62.4% Never married8.9% Now married16.8% Separated0.0% Widowed11.9% DivorcedFemales 2.8% Never married38.0% Now married0.0% Separated19.7% Widowed39.4% DivorcedWomen who did not give birth in the past 12 months Now married:
87.5% (7)Unmarried:
12.5% (1)
Marital status - Asian population 15 years and over
Males 28.0% Never married54.7% Now married17.3% Separated0.0% Widowed0.0% DivorcedFemales 0.0% Never married100.0% Now married0.0% Separated0.0% Widowed0.0% DivorcedWomen who did not give birth in the past 12 months Now married:
100.0% (68)Unmarried:
0.0% (0)
Marital status - Other race population 15 years and over
Males 38.1% Never married61.9% Now married0.0% Separated0.0% Widowed0.0% DivorcedFemales 27.8% Never married72.2% Now married0.0% Separated0.0% Widowed0.0% DivorcedWomen who did not give birth in the past 12 months Now married:
72.2% (18)Unmarried:
27.8% (7)
Marital status - Two or more races population 15 years and over
Males 7.1% Never married79.0% Now married0.0% Separated0.0% Widowed13.9% DivorcedFemales 52.4% Never married47.6% Now married0.0% Separated0.0% Widowed0.0% DivorcedWomen who did not give birth in the past 12 months Now married:
45.8% (63)Unmarried:
54.2% (75)
Marital status - White alone, not Hispanic / Latino population 15 years and over
Males 23.7% Never married61.4% Now married2.2% Separated3.5% Widowed9.1% DivorcedFemales 25.2% Never married47.2% Now married0.0% Separated8.3% Widowed19.3% DivorcedWomen who gave birth in the past 12 months Now married:
100.0% (80)Unmarried:
0.0% (0)
Women who did not give birth in the past 12 months Now married:
40.9% (641)Unmarried:
59.1% (926)
Marital status - Hispanic or Latino population 15 years and over
Males 19.0% Never married71.4% Now married0.0% Separated1.0% Widowed8.5% DivorcedFemales 44.0% Never married35.5% Now married0.0% Separated0.0% Widowed20.5% DivorcedWomen who did not give birth in the past 12 months Now married:
45.5% (53)Unmarried:
54.5% (64)
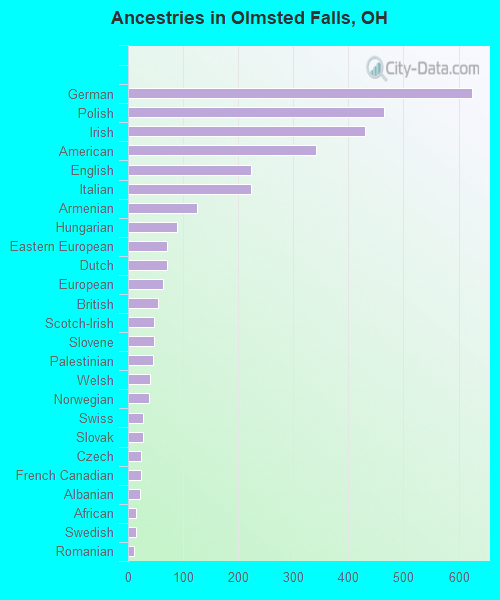
Ancestries in Olmsted Falls
624 15.7% German465 11.7% Polish430 10.8% Irish341 8.6% American223 5.6% English223 5.6% Italian126 3.2% Armenian89 2.2% Hungarian71 1.8% Eastern European70 1.8% Dutch64 1.6% European54 1.4% British48 1.2% Scotch-Irish47 1.2% Slovene45 1.1% Palestinian40 1.0% Welsh39 1.0% Norwegian28 0.7% Swiss27 0.7% Slovak24 0.6% Czech23 0.6% French Canadian22 0.6% Albanian15 0.4% African14 0.4% Swedish11 0.3% Romanian11 0.3% Scandinavian10 0.3% French10 0.3% Ukrainian6 0.2% Croatian6 0.2% Czechoslovakian4 0.1% Scottish3 0.08% Pennsylvania German2 0.05% Maltese
Children Nativity (place of birth) in Olmsted Falls
Children under 6 years - Living with two parents Both parents native 357 100.0% NativeChildren under 6 years - Living with one parent Native parent 193 100.0% Native
Children 6 to 17 years - Living with two parents Both parents native 971 100.0% NativeOne native, one foreign-born parent 42 100.0% NativeChildren 6 to 17 years - Living with one parent Native parent 249 100.0% Native
Grandparents responsible for own grandchildren in Olmsted Falls
Grandparents (30 to 59 years) White / Caucasian 13 100.0% Not responsible for grandchildrenWhite alone, not Hispanic / Latino 13 100.0% Not responsible for grandchildrenGrandparents (60 years and over) White / Caucasian 14 57.6% Responsible for grandchildren11 42.4% Not responsible for grandchildrenWhite alone, not Hispanic / Latino 15 57.0% Responsible for grandchildren11 43.0% Not responsible for grandchildren