Estimated zip code population in 2022: 23,112 Zip code population in 2010: 22,332 Zip code population in 2000: 18,046
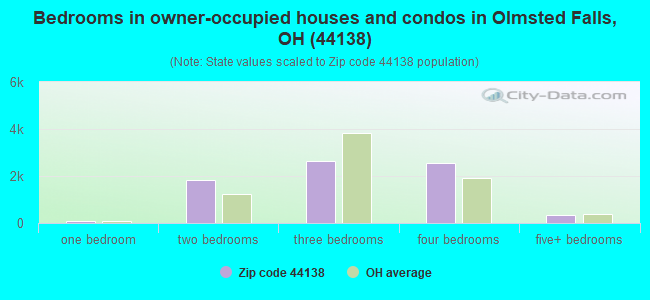
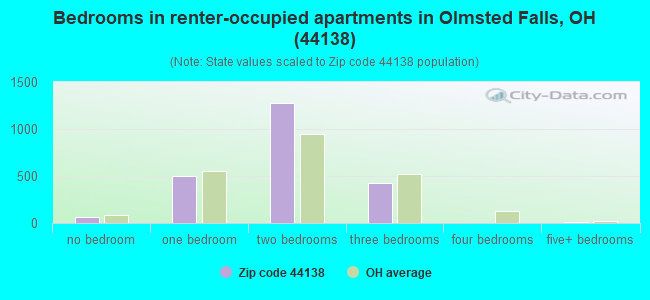
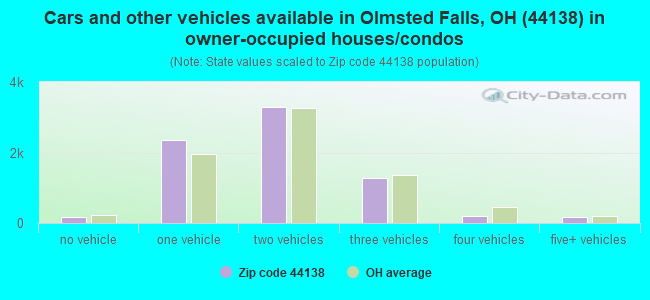
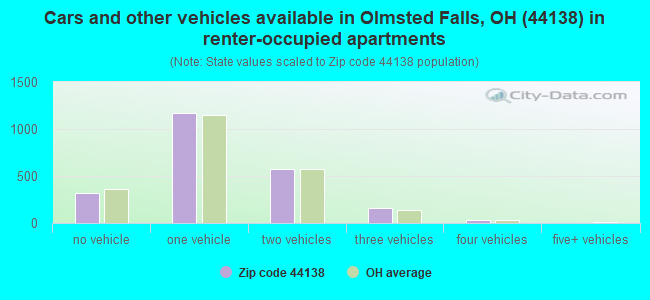
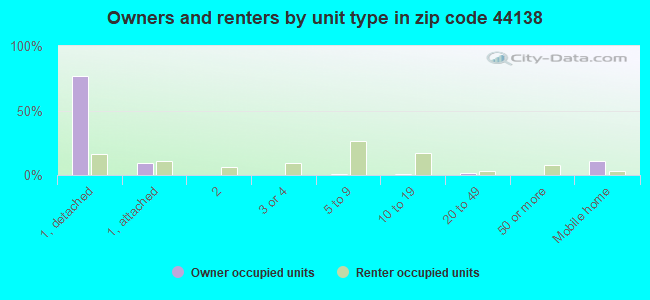
Houses and condos: 9,957 Renter-occupied apartments: 2,255
% of renters here:
23%
State:
33%
March 2022 cost of living index in zip code 44138: 95.7 (near average, U.S. average is 100)
Land area: 13.8 sq. mi. Water area: 0.0 sq. mi.
Population density: 1,679 people per square mile
(low).
OSM Map
General Map
Google Map
MSN Map
OSM Map
General Map
Google Map
MSN Map
OSM Map
General Map
Google Map
MSN Map
OSM Map
General Map
Google Map
MSN Map
Please wait while loading the map...
Real estate property taxes paid for housing units in 2022:
This zip code:
2.2% ($5,447)
Ohio:
1.3% ($2,639)
Median real estate property taxes paid for housing units with mortgages in 2022: $5,979 (2.1%) Median real estate property taxes paid for housing units with no mortgage in 2022: $4,691 (2.6%)
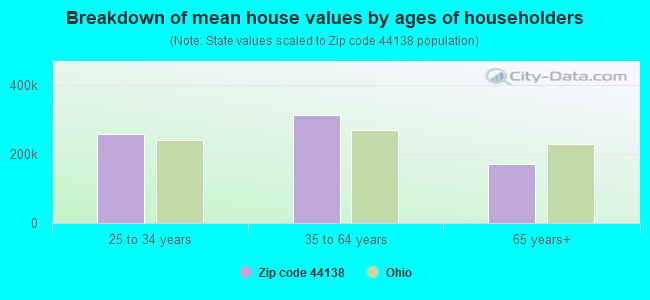
Estimated median house/condo value in 2022: $244,742
44138:
$244,742
Ohio:
$204,100
According to our research of Ohio and other state lists, there were 8 registered sex offenders living in 44138 zip code as of April 27, 2024. The ratio of all residents to sex offenders in zip code 44138 is 2,787 to 1. The ratio of registered sex offenders to all residents in this zip code is much lower than the state average.
Median resident age:
This zip code:
43.2 years
Ohio median age:
39.9 years
Average household size:
This zip code:
2.4 people
Ohio:
2.4 people
Averages for the 2020 tax year for zip code 44138, filed in 2021:
Average Adjusted Gross Income (AGI) in 2020: $71,772 (Individual Income Tax Returns)
Here:
$71,772
State:
$67,288
Salary/wage: $64,283 (reported on 80.3% of returns)
Here:
$64,283
State:
$55,628
(% of AGI for various income ranges: 1013.3% for AGIs below $25k, 3456.7% for AGIs $25k-50k, 6403.5% for AGIs $50k-75k, 9666.5% for AGIs $75k-100k, 18368.2% for AGIs $100k-200k, 73455.6% for AGIs over 200k)
Taxable interest for individuals: $1,017 (reported on 32.3% of returns)
This zip code:
$1,017
Ohio:
$1,518
(% of AGI for various income ranges: 15.9% for AGIs below $25k, 21.7% for AGIs $25k-50k, 37.5% for AGIs $50k-75k, 58.5% for AGIs $75k-100k, 90.7% for AGIs $100k-200k, 598.1% for AGIs over 200k)
Ordinary dividends: $5,356 (reported on 23.1% of returns)
Here:
$5,356
State:
$7,167
(% of AGI for various income ranges: 33.4% for AGIs below $25k, 45.6% for AGIs $25k-50k, 79.7% for AGIs $50k-75k, 151.5% for AGIs $75k-100k, 297.3% for AGIs $100k-200k, 4451.2% for AGIs over 200k)
Net capital gain/loss in AGI: +$11,807 (reported on 20.2% of returns)
Here:
+$11,807
State:
+$18,919
(% of AGI for various income ranges: 18.0% for AGIs below $25k, 28.9% for AGIs $25k-50k, 73.8% for AGIs $50k-75k, 144.5% for AGIs $75k-100k, 420.3% for AGIs $100k-200k, 12840.6% for AGIs over 200k)
Profit/loss from business: +$11,679 (reported on 13.1% of returns)
Here:
+$11,679
State:
+$13,744
(% of AGI for various income ranges: 100.0% for AGIs below $25k, 102.1% for AGIs $25k-50k, 170.1% for AGIs $50k-75k, 233.3% for AGIs $75k-100k, 446.3% for AGIs $100k-200k, 2495.0% for AGIs over 200k)
Taxable individual retirement arrangement distribution: $17,571 (reported on 12.1% of returns)
44138:
$17,571
Ohio:
$18,876
(% of AGI for various income ranges: 114.8% for AGIs below $25k, 181.0% for AGIs $25k-50k, 247.0% for AGIs $50k-75k, 378.3% for AGIs $75k-100k, 700.5% for AGIs $100k-200k, 2183.8% for AGIs over 200k)
Self-employed (Keogh) retirement plans: $19,225 (reported on 0.3% of returns)
44138:
$19,225
Ohio:
$24,898
(% of AGI for various income ranges: 58.7% for AGIs $100k-200k)
Total itemized deductions: $26,378 (reported on 7.0% of returns)
Here:
$26,378
State:
$33,869
(% of AGI for various income ranges: 52.7% for AGIs below $25k, 100.0% for AGIs $25k-50k, 225.3% for AGIs $50k-75k, 419.5% for AGIs $75k-100k, 596.4% for AGIs $100k-200k, 2700.6% for AGIs over 200k)
Charity contributions: $7,104 (reported on 5.5% of returns)
Here:
$7,104
State:
$14,577
(% of AGI for various income ranges: 2.2% for AGIs below $25k, 9.1% for AGIs $25k-50k, 31.3% for AGIs $50k-75k, 66.1% for AGIs $75k-100k, 123.0% for AGIs $100k-200k, 1182.5% for AGIs over 200k)
Taxes paid: $7,717 (reported on 7.0% of returns)
44138:
$7,717
State:
$7,681
(% of AGI for various income ranges: 8.5% for AGIs below $25k, 27.7% for AGIs $25k-50k, 79.4% for AGIs $50k-75k, 135.4% for AGIs $75k-100k, 183.7% for AGIs $100k-200k, 631.2% for AGIs over 200k)
Earned income credit: $1,905 (reported on 7.4% of returns)
Here:
$1,905
State:
$2,304
(% of AGI for various income ranges: 43.7% for AGIs below $25k, 37.4% for AGIs $25k-50k, 0.9% for AGIs $50k-75k)
Percentage of individuals using paid preparers for their 2020 taxes: 93.2%
Here:
93%
State:
94%
(% for various income ranges: 91.4% for AGIs below $25k, 93.5% for AGIs $25k-50k, 93.8% for AGIs $50k-75k, 95.0% for AGIs $75k-100k, 93.4% for AGIs $100k-200k, 96.1% for AGIs over 200k)
Averages for the 2012 tax year for zip code 44138, filed in 2013:
Average Adjusted Gross Income (AGI) in 2012: $59,132 (Individual Income Tax Returns)
Here:
$59,132
State:
$54,926
Salary/wage: $54,117 (reported on 84.2% of returns)
Here:
$54,117
State:
$45,869
(% of AGI for various income ranges: 68.6% for AGIs below $25k, 75.2% for AGIs $25k-50k, 78.5% for AGIs $50k-75k, 80.3% for AGIs $75k-100k, 82.5% for AGIs $100k-200k, 64.5% for AGIs over 200k)
Taxable interest for individuals: $837 (reported on 37.2% of returns)
This zip code:
$837
Ohio:
$1,297
(% of AGI for various income ranges: 1.1% for AGIs below $25k, 0.7% for AGIs $25k-50k, 0.4% for AGIs $50k-75k, 0.4% for AGIs $75k-100k, 0.4% for AGIs $100k-200k, 0.6% for AGIs over 200k)
Ordinary dividends: $3,514 (reported on 22.7% of returns)
Here:
$3,514
State:
$5,821
(% of AGI for various income ranges: 1.7% for AGIs below $25k, 0.9% for AGIs $25k-50k, 0.9% for AGIs $50k-75k, 1.0% for AGIs $75k-100k, 1.1% for AGIs $100k-200k, 3.2% for AGIs over 200k)
Net capital gain/loss in AGI: +$3,632 (reported on 16.3% of returns)
Here:
+$3,632
State:
+$11,232
(% of AGI for various income ranges: 0.3% for AGIs $50k-75k, 0.5% for AGIs $75k-100k, 0.7% for AGIs $100k-200k, 5.0% for AGIs over 200k)
Profit/loss from business: +$9,990 (reported on 11.6% of returns)
Here:
+$9,990
State:
+$12,773
(% of AGI for various income ranges: 5.5% for AGIs below $25k, 2.5% for AGIs $25k-50k, 1.4% for AGIs $50k-75k, 1.9% for AGIs $75k-100k, 1.8% for AGIs $100k-200k, 1.0% for AGIs over 200k)
Taxable individual retirement arrangement distribution: $14,076 (reported on 12.1% of returns)
44138:
$14,076
Ohio:
$14,511
(% of AGI for various income ranges: 5.2% for AGIs below $25k, 3.3% for AGIs $25k-50k, 2.9% for AGIs $50k-75k, 2.7% for AGIs $75k-100k, 2.7% for AGIs $100k-200k, 2.1% for AGIs over 200k)
Self-employment retirement plans: $12,540 (reported on 0.4% of returns)
44138:
$12,540
Ohio:
$20,257
(% of AGI for various income ranges: 0.3% for AGIs $100k-200k)
Total itemized deductions: $19,158 (20% of AGI, reported on 43.3% of returns)
Here:
$19,158
State:
$21,278
Here:
19.9% of AGI
State:
18.8% of AGI
(% of AGI for various income ranges: 10.3% for AGIs below $25k, 10.8% for AGIs $25k-50k, 14.2% for AGIs $50k-75k, 15.7% for AGIs $75k-100k, 15.8% for AGIs $100k-200k, 12.9% for AGIs over 200k)
Charity contributions: $2,293 (reported on 34.9% of returns)
Here:
$2,293
State:
$3,943
(% of AGI for various income ranges: 0.7% for AGIs below $25k, 0.7% for AGIs $25k-50k, 1.2% for AGIs $50k-75k, 1.5% for AGIs $75k-100k, 1.6% for AGIs $100k-200k, 1.9% for AGIs over 200k)
Taxes paid: $9,713 (reported on 43.3% of returns)
44138:
$9,713
State:
$9,568
(% of AGI for various income ranges: 2.7% for AGIs below $25k, 4.1% for AGIs $25k-50k, 6.6% for AGIs $50k-75k, 7.7% for AGIs $75k-100k, 8.8% for AGIs $100k-200k, 8.5% for AGIs over 200k)
Earned income credit: $1,901 (reported on 9.1% of returns)
Here:
$1,901
State:
$2,285
(% of AGI for various income ranges: 3.3% for AGIs below $25k, 0.6% for AGIs $25k-50k)
Percentage of individuals using paid preparers for their 2012 taxes: 49.9%
Here:
50%
State:
51%
(% for various income ranges: 42.1% for AGIs below $25k, 50.4% for AGIs $25k-50k, 56.5% for AGIs $50k-75k, 56.2% for AGIs $75k-100k, 50.6% for AGIs $100k-200k, 69.2% for AGIs over 200k)
Averages for the 2004 tax year for zip code 44138, filed in 2005:
Average Adjusted Gross Income (AGI) in 2004: $48,893 (Individual Income Tax Returns)
Here:
$48,893
State:
$44,480
Salary/wage: $46,102 (reported on 85.2% of returns)
Here:
$46,102
State:
$39,198
(% of AGI for various income ranges: 96.5% for AGIs below $10k, 65.5% for AGIs $10k-25k, 79.6% for AGIs $25k-50k, 83.2% for AGIs $50k-75k, 86.5% for AGIs $75k-100k, 77.3% for AGIs over 100k)
Taxable interest for individuals: $1,142 (reported on 55.0% of returns)
This zip code:
$1,142
Ohio:
$1,532
(% of AGI for various income ranges: 4.9% for AGIs below $10k, 3.3% for AGIs $10k-25k, 1.3% for AGIs $25k-50k, 0.9% for AGIs $50k-75k, 1.0% for AGIs $75k-100k, 1.2% for AGIs over 100k)
Taxable dividends: $2,397 (reported on 29.5% of returns)
Here:
$2,397
State:
$3,496
(% of AGI for various income ranges: 4.8% for AGIs below $10k, 2.4% for AGIs $10k-25k, 1.1% for AGIs $25k-50k, 0.6% for AGIs $50k-75k, 1.0% for AGIs $75k-100k, 2.2% for AGIs over 100k)
Net capital gain/loss: +$3,254 (reported on 21.5% of returns)
Here:
+$3,254
State:
+$8,582
(% of AGI for various income ranges: -0.9% for AGIs below $10k, -0.1% for AGIs $10k-25k, 0.4% for AGIs $25k-50k, 0.6% for AGIs $50k-75k, 0.6% for AGIs $75k-100k, 3.6% for AGIs over 100k)
Profit/loss from business: +$9,817 (reported on 11.6% of returns)
Here:
+$9,817
State:
+$10,813
(% of AGI for various income ranges: 2.4% for AGIs below $10k, 4.5% for AGIs $10k-25k, 2.4% for AGIs $25k-50k, 2.0% for AGIs $50k-75k, 1.8% for AGIs $75k-100k, 2.4% for AGIs over 100k)
IRA payment deduction: $2,835 (reported on 2.6% of returns)
44138:
$2,835
Ohio:
$2,794
(% of AGI for various income ranges: 0.3% for AGIs $10k-25k, 0.3% for AGIs $25k-50k, 0.1% for AGIs $50k-75k, 0.1% for AGIs $75k-100k, 0.1% for AGIs over 100k)
Self-employed pension: $10,138 (reported on 0.5% of returns)
Here:
$10,138
Ohio:
$13,981
(% of AGI for various income ranges: 0.1% for AGIs $50k-75k, 0.1% for AGIs $75k-100k, 0.2% for AGIs over 100k)
Total itemized deductions: $17,525 (23% of AGI, reported on 49.4% of returns)
Here:
$17,525
State:
$17,503
Here:
23.1% of AGI
State:
20.8% of AGI
(% of AGI for various income ranges: 14.0% for AGIs below $10k, 11.9% for AGIs $10k-25k, 15.4% for AGIs $25k-50k, 20.0% for AGIs $50k-75k, 20.2% for AGIs $75k-100k, 17.3% for AGIs over 100k)
Charity contributions deductions: $2,049 (3% of AGI, reported on 43.1% of returns)
Here:
$2,049
State:
$3,087
Here:
2.6% of AGI
State:
3.4% of AGI
(% of AGI for various income ranges: 0.6% for AGIs below $10k, 0.9% for AGIs $10k-25k, 1.3% for AGIs $25k-50k, 1.7% for AGIs $50k-75k, 2.1% for AGIs $75k-100k, 2.2% for AGIs over 100k)
Total tax: $6,437 (reported on 82.0% of returns)
44138:
$6,437
State:
$6,781
(% of AGI for various income ranges: 2.4% for AGIs below $10k, 4.6% for AGIs $10k-25k, 7.8% for AGIs $25k-50k, 9.2% for AGIs $50k-75k, 9.9% for AGIs $75k-100k, 16.0% for AGIs over 100k)
Earned income credit: $1,275 (reported on 6.0% of returns)
Here:
$1,275
State:
$1,696
Percentage of individuals using paid preparers for their 2004 taxes: 51.0%
Here:
51%
State:
55%
(% for various income ranges: 40.6% for AGIs below $10k, 53.0% for AGIs $10k-25k, 54.4% for AGIs $25k-50k, 56.2% for AGIs $50k-75k, 49.8% for AGIs $75k-100k, 49.6% for AGIs over 100k)
Likely homosexual households (counted as self-reported same-sex unmarried-partner households)
Lesbian couples: 0.4% of all households
Gay men: 0.0% of all households
Household received Food Stamps/SNAP in the past 12 months: 541 Household did not receive Food Stamps/SNAP in the past 12 months: 9,121
Women who had a birth in the past 12 months: 145 (125 now married, 21 unmarried) Women who did not have a birth in the past 12 months: 4,742 (2,343 now married, 2,397 unmarried)
Housing units in zip code 44138 with a mortgage: 4,260 (608 second mortgage, 8 home equity loan, 585 both second mortgage and home equity loan) Houses without a mortgage: 101
Median monthly owner costs for units with a mortgage: $1,910 Median monthly owner costs for units without a mortgage: $781
Residents with income below the poverty level in 2022:
This zip code:
4.7%
Whole state:
13.4%
Residents with income below 50% of the poverty level in 2022:
This zip code:
1.8%
Whole state:
7.0%
Median number of rooms in houses and condos:
Here:
6.9
State:
6.7
Median number of rooms in apartments:
Here:
4.5
State:
4.4
Notable locations in this zip code not listed on our city pages
Notable locations in zip code 44138: Lagoon Picnic Area (A), Lewis Road Riding Ring (B), Maple Grove Picnic Area (C), Home Links Golf Club (D), Olmsted Falls Fire Department (E), Olmsted Township Fire Department (F), Olmsted Falls City Hall (G), Olmsted Township Hall (H). Display/hide their locations on the map
4,608 married couples with children.
1,008 single-parent households (518 men, 490 women).
93.2% of residents of 44138 zip code speak English at home.
3.8% of residents speak Spanish at home (76% very well, 9% well, 8% not well, 7% not at all).
1.0% of residents speak other Indo-European language at home (54% very well, 37% well, 9% not well).
1.2% of residents speak Asian or Pacific Island language at home (76% very well, 24% well).
1.0% of residents speak other language at home (88% very well, 9% well, 3% not well).
Foreign born population: 892 (3.9%) (59.0% of them are naturalized citizens)
This zip code:
3.9%
Whole state:
5.0%
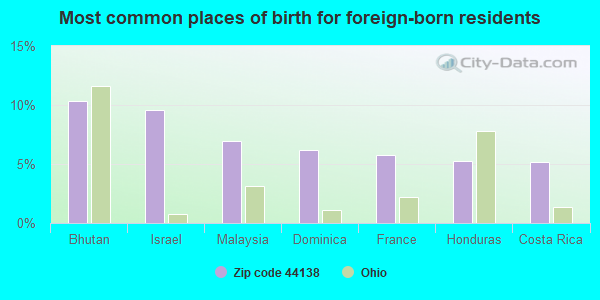
10%Bhutan
10%Israel
7%Malaysia
6%Dominica
6%France
5%Honduras
5%Costa Rica
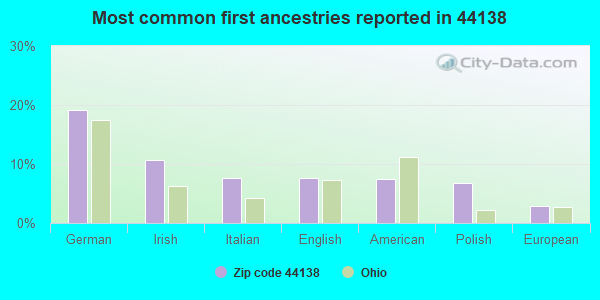
19%German
11%Irish
8%Italian
8%English
7%American
7%Polish
3%European
Year of entry for the foreign-born population
5142010 or later
2332000 to 2009
1771990 to 1999
275Before 1990
Facilities with environmental interests located in this zip code:
BLUE RIDGE PAPER PRODUCT INC (7920 MAPLEWAY DRIVE in OLMSTED FALLS, OH)
AIR SYNTHETIC MINOR (AIRS/AFS) (Integrated Compliance Information System) - ICIS-05-1984-0013, FORMAL ENFORCEMENT ACTION STATE MASTER (Ohio general info) - PCS-OH0000531, National Pollutant Discharge Elimination System Permit, AIR MAJOR, EPCRA, TRIS-44138CHMPN7920M, TRI REPORTER, RCRA-OHD004213153, HAZARDOUS WASTE PROGRAM Small Quantity Generators, between 100 kg and 1000 kg of hazardous waste/month (Resource Conservation and Recovery Act (tracking hazardous waste)) - notification TRI REPORTER (Tracking of toxic chemicals releasing facilities) Business SIC classification: SANITARY FOOD CONTAINERS, EXCEPT FOLDING Business NAICS classification: FOLDING PAPERBOARD BOX MANUFACTURING. Organizations: CHAMPION INTERNATIONAL CORP DAIRYPAK (CONTACT/OPERATOR)
Alternative names: CHAMPION INTL. CORP., CHAMPION INTERNATIONAL CORPORATION DAIRY PAK, CHAMPION INTERNATIONAL CORP. DAIRY PAK P, CHAMPION INTERNATIONAL CORP DAIRYPAK DIV
AMERITECH (25200 BAGLEY RD in OLMSTED FALLS, OH)
STATE MASTER (Ohio general info) - -18-4811-227-19, EPCRA (Resource Conservation and Recovery Act (tracking hazardous waste)) Organizations: OHIO BELL TELEPHONE COMPANY (CONTACT/OWNER)
Alternative names: OHIO BELL TEL CO OLMSTED TWP CO
AMERICAN WIRE & CABLE CO OLMSTED FALL (7951 BRONSON RD. in OLMSTED FALLS, OH)
STATE MASTER (Ohio general info) - AIR MAJOR, TRIS-44138MRCNW7951B, TRI REPORTER TRI REPORTER (Tracking of toxic chemicals releasing facilities) Business SIC classification: PLASTICS PRODUCTS
Housing units lacking complete kitchen facilities: 0.6%
79.7%Utility gas
17.5%Electricity
2.2%Bottled, tank, or LP gas
Population in 1990: 15,722. Population change in the 1990s: +2,324 (+14.8%).
Place of birth for U.S.-born residents:
This state: 18,175
Northeast: 1,151
Midwest: 832
South: 962
West: 821
60% of the 44138 zip code residents lived in the same house 5 years ago. Out of people who lived in different houses, 77% lived in this county. Out of people who lived in different counties, 50% lived in Ohio.
88% of the 44138 zip code residents lived in the same house 1 year ago. Out of people who lived in different houses, 54% moved from this county. Out of people who lived in different houses, 34% moved from different county within same state. Out of people who lived in different houses, 10% moved from different state.
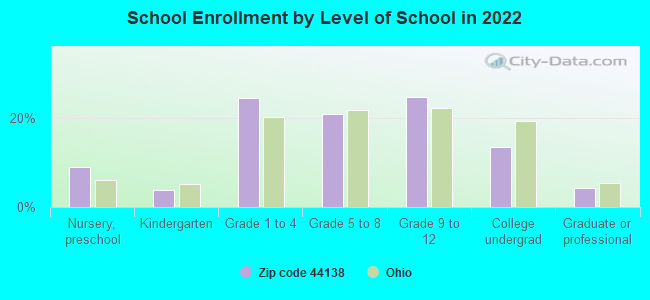
Private vs. public school enrollment:
Students in private schools in grades 1 to 8 (elementary and middle school): 199
Here:
7.0%
Ohio:
16.0%
Students in private schools in grades 9 to 12 (high school): 136
Here:
8.7%
Ohio:
13.1%
Students in private undergraduate colleges: 233
Here:
27.3%
Ohio:
22.3%
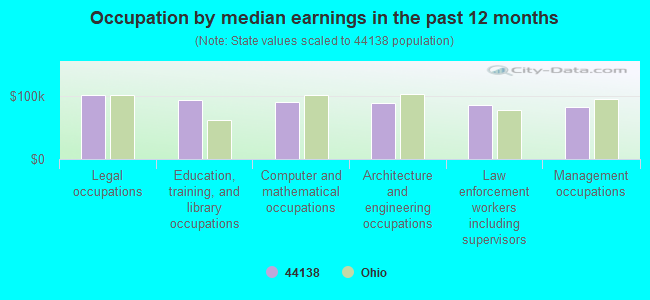
Occupation by median earnings in the past 12 months ($)
102,785Legal occupations
93,788Education, training, and library occupations
90,298Computer and mathematical occupations
89,815Architecture and engineering occupations
85,562Law enforcement workers including supervisors
82,673Management occupations
Top industries in this zip code by the number of employees in 2005:
Health Care and Social Assistance: Continuing Care Retirement Communities (250-499 employees: 1 establishment)
Accommodation and Food Services: Limited-Service Restaurants (10-19: 4, 5-9: 2)
Educational Services: Elementary and Secondary Schools (50-99: 1)
Administrative and Support and Waste Management and Remediation Services: Landscaping Services (20-49: 1, 1-4: 15)
Other Services (except Public Administration): Religious Organizations (10-19: 3, 1-4: 7)
People in group quarters in 2010:
186 people in nursing facilities/skilled-nursing facilities
8 people in group homes for juveniles (non-correctional)
8 people in group homes intended for adults
3 people in workers' group living quarters and job corps centers
People in group quarters in 2000:
104 people in nursing homes
21 people in other group homes
4 people in other noninstitutional group quarters
Fatal accident statistics in 2013:
Fatal accident count: 1
Vehicles involved in fatal accidents: 2
Fatal accidents caused by drunken drivers: 0
Fatalities: 1
Persons involved in fatal accidents: 3
Pedestrians involved in fatal accidents: 0
Fatal accident statistics in 2012:
Fatal accident count: 1
Vehicles involved in fatal accidents: 1
Fatal accidents caused by drunken drivers: 0
Fatalities: 1
Persons involved in fatal accidents: 2
Pedestrians involved in fatal accidents: 1
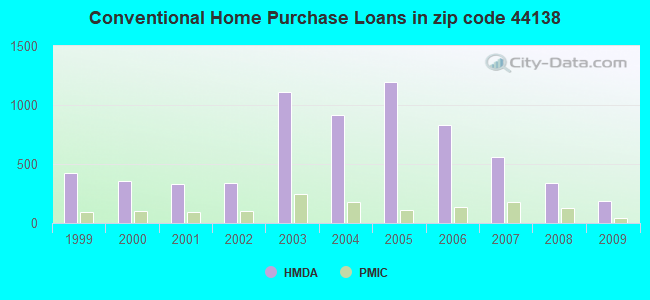
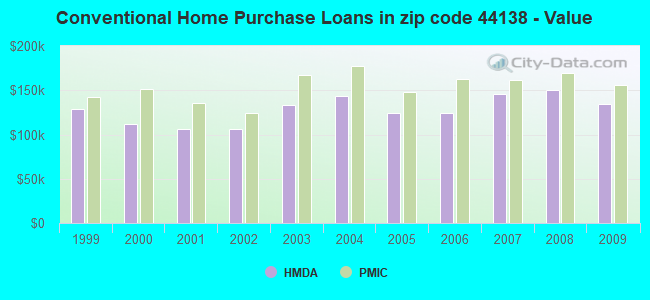
Home Mortgage Disclosure Act Aggregated Statistics For Year 2009 (Based on 3 full and 6 partial tracts)
A) FHA, FSA/RHS & VA Home Purchase Loans
B) Conventional Home Purchase Loans
C) Refinancings
D) Home Improvement Loans
F) Non-occupant Loans on < 5 Family Dwellings (A B C & D)
G) Loans On Manufactured Home Dwelling (A B C & D)
Number
Average Value
Number
Average Value
Number
Average Value
Number
Average Value
Number
Average Value
Number
Average Value
LOANS ORIGINATED
198
$158,466
183
$134,804
760
$155,107
23
$34,280
19
$94,365
7
$27,190
APPLICATIONS APPROVED, NOT ACCEPTED
4
$135,082
10
$169,711
68
$167,580
10
$17,665
1
$86,000
5
$42,814
APPLICATIONS DENIED
25
$157,885
32
$135,240
303
$157,370
55
$19,770
13
$109,464
2
$15,490
APPLICATIONS WITHDRAWN
16
$149,756
21
$127,913
136
$168,667
6
$71,590
0
$0
0
$0
FILES CLOSED FOR INCOMPLETENESS
5
$136,550
4
$224,328
60
$168,958
0
$0
2
$116,300
0
$0
Aggregated Statistics For Year 2008 (Based on 3 full and 6 partial tracts)
A) FHA, FSA/RHS & VA Home Purchase Loans
B) Conventional Home Purchase Loans
C) Refinancings
D) Home Improvement Loans
F) Non-occupant Loans on < 5 Family Dwellings (A B C & D)
G) Loans On Manufactured Home Dwelling (A B C & D)
Number
Average Value
Number
Average Value
Number
Average Value
Number
Average Value
Number
Average Value
Number
Average Value
LOANS ORIGINATED
222
$160,571
337
$150,149
366
$164,387
62
$29,438
27
$119,835
6
$21,947
APPLICATIONS APPROVED, NOT ACCEPTED
10
$163,097
24
$129,373
59
$137,125
26
$44,647
2
$58,095
3
$36,147
APPLICATIONS DENIED
27
$175,579
47
$125,874
347
$164,898
73
$41,125
17
$160,171
23
$33,033
APPLICATIONS WITHDRAWN
24
$141,808
31
$165,873
102
$169,111
10
$98,257
5
$112,818
0
$0
FILES CLOSED FOR INCOMPLETENESS
3
$146,357
7
$237,167
29
$177,933
3
$83,680
0
$0
0
$0
Aggregated Statistics For Year 2007 (Based on 3 full and 6 partial tracts)
A) FHA, FSA/RHS & VA Home Purchase Loans
B) Conventional Home Purchase Loans
C) Refinancings
D) Home Improvement Loans
E) Loans on Dwellings For 5+ Families
F) Non-occupant Loans on < 5 Family Dwellings (A B C & D)
G) Loans On Manufactured Home Dwelling (A B C & D)
Number
Average Value
Number
Average Value
Number
Average Value
Number
Average Value
Number
Average Value
Number
Average Value
Number
Average Value
LOANS ORIGINATED
30
$151,125
563
$145,690
415
$133,418
111
$37,598
2
$1,711,640
37
$114,375
8
$35,438
APPLICATIONS APPROVED, NOT ACCEPTED
2
$102,410
65
$140,034
137
$121,053
14
$93,663
0
$0
2
$136,735
11
$32,573
APPLICATIONS DENIED
7
$176,121
46
$110,636
420
$138,596
72
$31,119
0
$0
22
$115,666
24
$42,870
APPLICATIONS WITHDRAWN
4
$173,130
36
$134,224
119
$160,408
18
$52,735
0
$0
5
$112,834
0
$0
FILES CLOSED FOR INCOMPLETENESS
0
$0
13
$156,523
55
$164,076
4
$162,310
0
$0
4
$177,558
0
$0
Aggregated Statistics For Year 2006 (Based on 3 full and 6 partial tracts)
A) FHA, FSA/RHS & VA Home Purchase Loans
B) Conventional Home Purchase Loans
C) Refinancings
D) Home Improvement Loans
F) Non-occupant Loans on < 5 Family Dwellings (A B C & D)
G) Loans On Manufactured Home Dwelling (A B C & D)
Number
Average Value
Number
Average Value
Number
Average Value
Number
Average Value
Number
Average Value
Number
Average Value
LOANS ORIGINATED
39
$162,056
829
$124,744
644
$123,464
135
$40,039
41
$91,279
16
$35,312
APPLICATIONS APPROVED, NOT ACCEPTED
2
$176,185
90
$112,323
104
$116,181
29
$50,563
5
$132,616
8
$47,011
APPLICATIONS DENIED
3
$146,963
126
$90,738
398
$131,864
91
$35,275
12
$111,724
30
$34,998
APPLICATIONS WITHDRAWN
7
$176,583
50
$120,294
244
$143,083
23
$38,637
3
$123,820
6
$38,213
FILES CLOSED FOR INCOMPLETENESS
0
$0
22
$129,297
80
$163,422
0
$0
0
$0
0
$0
Aggregated Statistics For Year 2005 (Based on 3 full and 6 partial tracts)
A) FHA, FSA/RHS & VA Home Purchase Loans
B) Conventional Home Purchase Loans
C) Refinancings
D) Home Improvement Loans
F) Non-occupant Loans on < 5 Family Dwellings (A B C & D)
G) Loans On Manufactured Home Dwelling (A B C & D)
Number
Average Value
Number
Average Value
Number
Average Value
Number
Average Value
Number
Average Value
Number
Average Value
LOANS ORIGINATED
40
$162,396
1,197
$124,500
823
$141,183
96
$48,825
89
$100,196
16
$35,171
APPLICATIONS APPROVED, NOT ACCEPTED
3
$131,280
98
$107,393
144
$131,097
8
$40,894
12
$39,487
12
$33,495
APPLICATIONS DENIED
4
$148,538
146
$100,218
542
$149,045
60
$33,017
22
$103,252
26
$53,779
APPLICATIONS WITHDRAWN
4
$184,442
67
$102,518
311
$153,573
33
$196,087
32
$99,355
3
$54,223
FILES CLOSED FOR INCOMPLETENESS
0
$0
35
$104,809
58
$137,453
9
$53,842
2
$33,850
3
$28,403
Aggregated Statistics For Year 2004 (Based on 3 full and 6 partial tracts)
A) FHA, FSA/RHS & VA Home Purchase Loans
B) Conventional Home Purchase Loans
C) Refinancings
D) Home Improvement Loans
E) Loans on Dwellings For 5+ Families
F) Non-occupant Loans on < 5 Family Dwellings (A B C & D)
G) Loans On Manufactured Home Dwelling (A B C & D)
Number
Average Value
Number
Average Value
Number
Average Value
Number
Average Value
Number
Average Value
Number
Average Value
Number
Average Value
LOANS ORIGINATED
67
$150,635
917
$143,464
834
$140,089
63
$44,379
1
$4,446,000
65
$114,157
29
$28,793
APPLICATIONS APPROVED, NOT ACCEPTED
4
$153,770
58
$139,727
160
$148,217
2
$255,760
0
$0
4
$152,472
3
$61,967
APPLICATIONS DENIED
13
$163,512
124
$115,367
496
$135,743
70
$43,263
0
$0
30
$116,272
48
$54,838
APPLICATIONS WITHDRAWN
10
$149,107
133
$145,483
282
$150,230
22
$41,519
0
$0
11
$68,405
0
$0
FILES CLOSED FOR INCOMPLETENESS
0
$0
23
$174,975
79
$153,276
13
$76,959
0
$0
6
$122,362
2
$8,855
Aggregated Statistics For Year 2003 (Based on 3 full and 6 partial tracts)
A) FHA, FSA/RHS & VA Home Purchase Loans
B) Conventional Home Purchase Loans
C) Refinancings
D) Home Improvement Loans
F) Non-occupant Loans on < 5 Family Dwellings (A B C & D)
Number
Average Value
Number
Average Value
Number
Average Value
Number
Average Value
Number
Average Value
LOANS ORIGINATED
79
$160,521
1,113
$133,483
1,954
$130,538
51
$21,088
63
$92,159
APPLICATIONS APPROVED, NOT ACCEPTED
0
$0
83
$141,525
337
$127,121
22
$30,172
7
$110,460
APPLICATIONS DENIED
8
$189,270
109
$106,386
550
$122,885
65
$27,665
16
$59,828
APPLICATIONS WITHDRAWN
18
$172,277
102
$161,083
214
$142,891
9
$30,719
5
$70,590
FILES CLOSED FOR INCOMPLETENESS
4
$134,275
21
$154,917
94
$142,214
9
$27,442
4
$111,998
Aggregated Statistics For Year 2002 (Based on 1 full and 4 partial tracts)
A) FHA, FSA/RHS & VA Home Purchase Loans
B) Conventional Home Purchase Loans
C) Refinancings
D) Home Improvement Loans
F) Non-occupant Loans on < 5 Family Dwellings (A B C & D)
Number
Average Value
Number
Average Value
Number
Average Value
Number
Average Value
Number
Average Value
LOANS ORIGINATED
32
$125,868
343
$106,220
565
$117,168
17
$11,552
24
$85,897
APPLICATIONS APPROVED, NOT ACCEPTED
2
$59,885
23
$95,085
92
$111,095
17
$13,362
2
$78,110
APPLICATIONS DENIED
7
$142,246
57
$100,519
165
$120,215
17
$12,991
11
$66,087
APPLICATIONS WITHDRAWN
2
$145,805
28
$112,923
113
$123,095
2
$81,500
3
$67,813
FILES CLOSED FOR INCOMPLETENESS
0
$0
3
$96,047
44
$121,921
0
$0
3
$88,230
Aggregated Statistics For Year 2001 (Based on 1 full and 4 partial tracts)
A) FHA, FSA/RHS & VA Home Purchase Loans
B) Conventional Home Purchase Loans
C) Refinancings
D) Home Improvement Loans
F) Non-occupant Loans on < 5 Family Dwellings (A B C & D)
Number
Average Value
Number
Average Value
Number
Average Value
Number
Average Value
Number
Average Value
LOANS ORIGINATED
50
$129,381
331
$106,744
550
$111,167
34
$23,663
17
$80,226
APPLICATIONS APPROVED, NOT ACCEPTED
2
$72,035
27
$83,738
74
$107,394
9
$16,527
0
$0
APPLICATIONS DENIED
0
$0
47
$93,319
192
$107,127
18
$15,366
5
$82,240
APPLICATIONS WITHDRAWN
2
$202,170
20
$161,049
95
$137,753
8
$34,768
0
$0
FILES CLOSED FOR INCOMPLETENESS
2
$95,470
0
$0
11
$109,767
0
$0
0
$0
Aggregated Statistics For Year 2000 (Based on 1 full and 4 partial tracts)
A) FHA, FSA/RHS & VA Home Purchase Loans
B) Conventional Home Purchase Loans
C) Refinancings
D) Home Improvement Loans
F) Non-occupant Loans on < 5 Family Dwellings (A B C & D)
Number
Average Value
Number
Average Value
Number
Average Value
Number
Average Value
Number
Average Value
LOANS ORIGINATED
44
$116,831
354
$111,841
156
$96,582
50
$17,833
4
$76,252
APPLICATIONS APPROVED, NOT ACCEPTED
5
$98,594
28
$70,405
35
$113,008
15
$22,711
0
$0
APPLICATIONS DENIED
3
$91,957
50
$92,219
97
$105,761
37
$16,025
4
$24,485
APPLICATIONS WITHDRAWN
3
$112,250
14
$124,308
50
$104,243
8
$17,018
2
$134,525
FILES CLOSED FOR INCOMPLETENESS
3
$156,800
4
$94,038
9
$90,071
0
$0
0
$0
Aggregated Statistics For Year 1999 (Based on 2 full and 2 partial tracts)
A) FHA, FSA/RHS & VA Home Purchase Loans
B) Conventional Home Purchase Loans
C) Refinancings
D) Home Improvement Loans
F) Non-occupant Loans on < 5 Family Dwellings (A B C & D)
2002 - 2018 National Fire Incident Reporting System (NFIRS) incidents
Based on the data from the years 2002 - 2018 the average number of fires per year is 81. The highest number of fire incidents - 123 took place in 2017, and the least - 50 in 2005. The data has a rising trend.
When looking into fire subcategories, the most reports belonged to: Structure Fires (51.1%), and Outside Fires (39.5%).
Fire incident types reported to NFIRS in Zip Code 44138

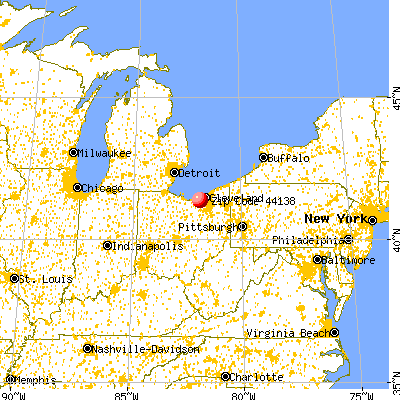


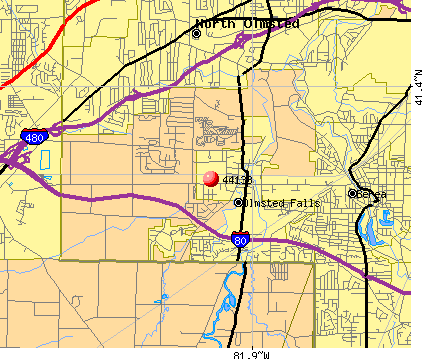 Nearest zip codes: 44070, 44017, 44028, 44145, 44149, 44142.


 Based on the data from the years 2002 - 2018 the average number of fires per year is 81. The highest number of fire incidents - 123 took place in 2017, and the least - 50 in 2005. The data has a rising trend.
 When looking into fire subcategories, the most reports belonged to: Structure Fires (51.1%), and Outside Fires (39.5%).