Estimated zip code population in 2022: 32,192 Zip code population in 2010: 32,902 Zip code population in 2000: 34,081
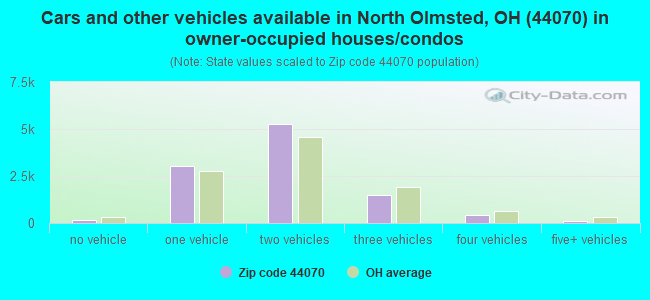
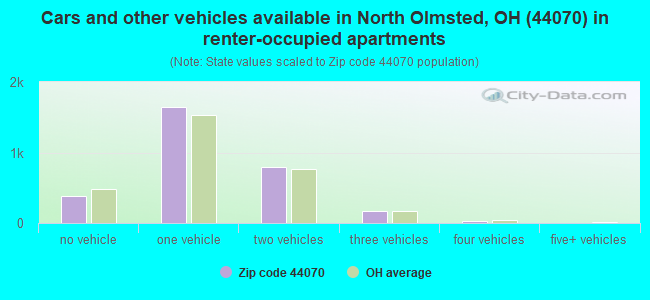
Houses and condos: 13,677 Renter-occupied apartments: 3,001
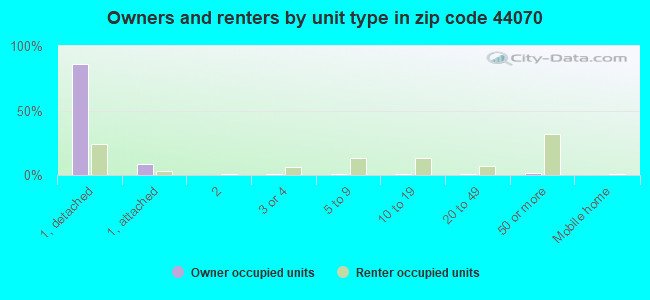
% of renters here:
22%
State:
33%
March 2022 cost of living index in zip code 44070: 95.1 (less than average, U.S. average is 100)
Land area: 11.7 sq. mi. Water area: 0.0 sq. mi.
Population density: 2,759 people per square mile
(average).
OSM Map
General Map
Google Map
MSN Map
OSM Map
General Map
Google Map
MSN Map
OSM Map
General Map
Google Map
MSN Map
OSM Map
General Map
Google Map
MSN Map
Please wait while loading the map...
Real estate property taxes paid for housing units in 2022:
This zip code:
2.2% ($4,598)
Ohio:
1.3% ($2,639)
Median real estate property taxes paid for housing units with mortgages in 2022: $4,750 (2.1%) Median real estate property taxes paid for housing units with no mortgage in 2022: $4,348 (2.2%)
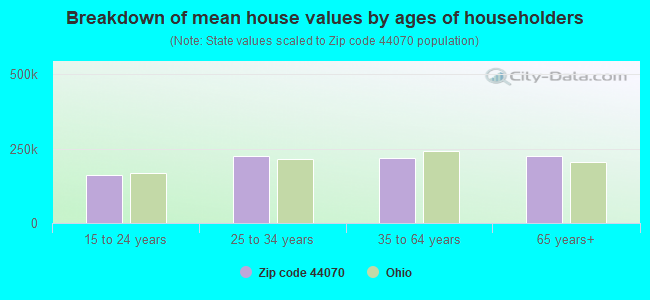
Estimated median house/condo value in 2022: $213,119
44070:
$213,119
Ohio:
$204,100
According to our research of Ohio and other state lists, there were 15 registered sex offenders living in 44070 zip code as of April 27, 2024. The ratio of all residents to sex offenders in zip code 44070 is 2,177 to 1. The ratio of registered sex offenders to all residents in this zip code is much lower than the state average.
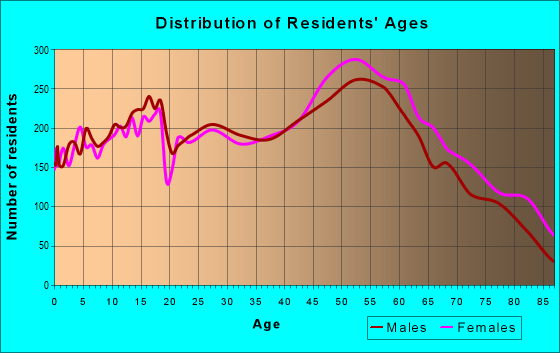
Median resident age:
This zip code:
44.3 years
Ohio median age:
39.9 years
Average household size:
This zip code:
2.4 people
Ohio:
2.4 people
Averages for the 2020 tax year for zip code 44070, filed in 2021:
Average Adjusted Gross Income (AGI) in 2020: $59,834 (Individual Income Tax Returns)
Here:
$59,834
State:
$67,288
Salary/wage: $52,243 (reported on 79.1% of returns)
Here:
$52,243
State:
$55,628
(% of AGI for various income ranges: 1140.6% for AGIs below $25k, 3518.3% for AGIs $25k-50k, 6385.1% for AGIs $50k-75k, 9292.9% for AGIs $75k-100k, 16955.1% for AGIs $100k-200k, 69875.6% for AGIs over 200k)
Taxable interest for individuals: $1,237 (reported on 31.8% of returns)
This zip code:
$1,237
Ohio:
$1,518
(% of AGI for various income ranges: 23.8% for AGIs below $25k, 31.0% for AGIs $25k-50k, 46.7% for AGIs $50k-75k, 85.5% for AGIs $75k-100k, 124.0% for AGIs $100k-200k, 1232.2% for AGIs over 200k)
Ordinary dividends: $3,931 (reported on 22.1% of returns)
Here:
$3,931
State:
$7,167
(% of AGI for various income ranges: 33.2% for AGIs below $25k, 44.8% for AGIs $25k-50k, 91.7% for AGIs $50k-75k, 163.1% for AGIs $75k-100k, 337.3% for AGIs $100k-200k, 3976.7% for AGIs over 200k)
Net capital gain/loss in AGI: +$8,252 (reported on 18.7% of returns)
Here:
+$8,252
State:
+$18,919
(% of AGI for various income ranges: 14.2% for AGIs below $25k, 36.3% for AGIs $25k-50k, 113.3% for AGIs $50k-75k, 166.3% for AGIs $75k-100k, 551.3% for AGIs $100k-200k, 14000.0% for AGIs over 200k)
Profit/loss from business: +$10,111 (reported on 13.4% of returns)
Here:
+$10,111
State:
+$13,744
(% of AGI for various income ranges: 101.9% for AGIs below $25k, 152.0% for AGIs $25k-50k, 143.4% for AGIs $50k-75k, 219.2% for AGIs $75k-100k, 404.4% for AGIs $100k-200k, 3637.8% for AGIs over 200k)
Taxable individual retirement arrangement distribution: $15,870 (reported on 12.6% of returns)
44070:
$15,870
Ohio:
$18,876
(% of AGI for various income ranges: 101.6% for AGIs below $25k, 153.1% for AGIs $25k-50k, 296.5% for AGIs $50k-75k, 457.7% for AGIs $75k-100k, 695.4% for AGIs $100k-200k, 4414.4% for AGIs over 200k)
Self-employed (Keogh) retirement plans: $17,300 (reported on 0.3% of returns)
44070:
$17,300
Ohio:
$24,898
(% of AGI for various income ranges: 60.9% for AGIs $100k-200k)
Total itemized deductions: $26,386 (reported on 5.4% of returns)
Here:
$26,386
State:
$33,869
(% of AGI for various income ranges: 42.5% for AGIs below $25k, 81.2% for AGIs $25k-50k, 231.5% for AGIs $50k-75k, 342.0% for AGIs $75k-100k, 491.3% for AGIs $100k-200k, 4687.8% for AGIs over 200k)
Charity contributions: $5,837 (reported on 3.9% of returns)
Here:
$5,837
State:
$14,577
(% of AGI for various income ranges: 2.2% for AGIs below $25k, 5.6% for AGIs $25k-50k, 20.9% for AGIs $50k-75k, 58.5% for AGIs $75k-100k, 96.8% for AGIs $100k-200k, 1177.8% for AGIs over 200k)
Taxes paid: $7,402 (reported on 5.4% of returns)
44070:
$7,402
State:
$7,681
(% of AGI for various income ranges: 5.7% for AGIs below $25k, 15.2% for AGIs $25k-50k, 69.2% for AGIs $50k-75k, 130.6% for AGIs $75k-100k, 163.6% for AGIs $100k-200k, 737.8% for AGIs over 200k)
Earned income credit: $2,143 (reported on 10.9% of returns)
Here:
$2,143
State:
$2,304
(% of AGI for various income ranges: 67.1% for AGIs below $25k, 52.9% for AGIs $25k-50k, 0.8% for AGIs $50k-75k)
Percentage of individuals using paid preparers for their 2020 taxes: 92.3%
Here:
92%
State:
94%
(% for various income ranges: 91.2% for AGIs below $25k, 93.4% for AGIs $25k-50k, 93.1% for AGIs $50k-75k, 91.8% for AGIs $75k-100k, 91.9% for AGIs $100k-200k, 91.7% for AGIs over 200k)
Averages for the 2012 tax year for zip code 44070, filed in 2013:
Average Adjusted Gross Income (AGI) in 2012: $50,332 (Individual Income Tax Returns)
Here:
$50,332
State:
$54,926
Salary/wage: $45,095 (reported on 82.3% of returns)
Here:
$45,095
State:
$45,869
(% of AGI for various income ranges: 70.5% for AGIs below $25k, 74.7% for AGIs $25k-50k, 74.6% for AGIs $50k-75k, 74.9% for AGIs $75k-100k, 76.3% for AGIs $100k-200k, 62.5% for AGIs over 200k)
Taxable interest for individuals: $1,000 (reported on 39.2% of returns)
This zip code:
$1,000
Ohio:
$1,297
(% of AGI for various income ranges: 1.4% for AGIs below $25k, 0.8% for AGIs $25k-50k, 0.7% for AGIs $50k-75k, 0.7% for AGIs $75k-100k, 0.6% for AGIs $100k-200k, 1.2% for AGIs over 200k)
Ordinary dividends: $3,274 (reported on 23.3% of returns)
Here:
$3,274
State:
$5,821
(% of AGI for various income ranges: 1.9% for AGIs below $25k, 1.0% for AGIs $25k-50k, 1.2% for AGIs $50k-75k, 1.1% for AGIs $75k-100k, 1.4% for AGIs $100k-200k, 3.9% for AGIs over 200k)
Net capital gain/loss in AGI: +$3,620 (reported on 16.3% of returns)
Here:
+$3,620
State:
+$11,232
(% of AGI for various income ranges: 0.1% for AGIs $25k-50k, 0.3% for AGIs $50k-75k, 0.5% for AGIs $75k-100k, 0.9% for AGIs $100k-200k, 9.6% for AGIs over 200k)
Profit/loss from business: +$11,515 (reported on 11.6% of returns)
Here:
+$11,515
State:
+$12,773
(% of AGI for various income ranges: 7.2% for AGIs below $25k, 2.5% for AGIs $25k-50k, 1.7% for AGIs $50k-75k, 1.5% for AGIs $75k-100k, 2.1% for AGIs $100k-200k, 4.5% for AGIs over 200k)
Taxable individual retirement arrangement distribution: $12,857 (reported on 13.8% of returns)
44070:
$12,857
Ohio:
$14,511
(% of AGI for various income ranges: 5.3% for AGIs below $25k, 3.6% for AGIs $25k-50k, 3.1% for AGIs $50k-75k, 3.2% for AGIs $75k-100k, 3.6% for AGIs $100k-200k, 3.2% for AGIs over 200k)
Self-employment retirement plans: $14,883 (reported on 0.3% of returns)
44070:
$14,883
Ohio:
$20,257
(% of AGI for various income ranges: 0.1% for AGIs $50k-75k, 0.3% for AGIs $100k-200k)
Total itemized deductions: $17,253 (21% of AGI, reported on 37.2% of returns)
Here:
$17,253
State:
$21,278
Here:
20.7% of AGI
State:
18.8% of AGI
(% of AGI for various income ranges: 9.9% for AGIs below $25k, 11.1% for AGIs $25k-50k, 12.9% for AGIs $50k-75k, 13.5% for AGIs $75k-100k, 14.2% for AGIs $100k-200k, 12.4% for AGIs over 200k)
Charity contributions: $2,457 (reported on 30.3% of returns)
Here:
$2,457
State:
$3,943
(% of AGI for various income ranges: 0.8% for AGIs below $25k, 1.0% for AGIs $25k-50k, 1.3% for AGIs $50k-75k, 1.6% for AGIs $75k-100k, 1.9% for AGIs $100k-200k, 2.4% for AGIs over 200k)
Taxes paid: $8,077 (reported on 37.0% of returns)
44070:
$8,077
State:
$9,568
(% of AGI for various income ranges: 2.8% for AGIs below $25k, 4.1% for AGIs $25k-50k, 5.5% for AGIs $50k-75k, 6.5% for AGIs $75k-100k, 7.6% for AGIs $100k-200k, 7.8% for AGIs over 200k)
Earned income credit: $2,186 (reported on 11.5% of returns)
Here:
$2,186
State:
$2,285
(% of AGI for various income ranges: 4.5% for AGIs below $25k, 0.7% for AGIs $25k-50k)
Percentage of individuals using paid preparers for their 2012 taxes: 50.2%
Here:
50%
State:
51%
(% for various income ranges: 45.8% for AGIs below $25k, 51.1% for AGIs $25k-50k, 54.2% for AGIs $50k-75k, 53.0% for AGIs $75k-100k, 52.0% for AGIs $100k-200k, 65.0% for AGIs over 200k)
Averages for the 2004 tax year for zip code 44070, filed in 2005:
Average Adjusted Gross Income (AGI) in 2004: $43,678 (Individual Income Tax Returns)
Here:
$43,678
State:
$44,480
Salary/wage: $40,456 (reported on 84.0% of returns)
Here:
$40,456
State:
$39,198
(% of AGI for various income ranges: 83.1% for AGIs below $10k, 67.9% for AGIs $10k-25k, 77.8% for AGIs $25k-50k, 79.4% for AGIs $50k-75k, 82.3% for AGIs $75k-100k, 75.3% for AGIs over 100k)
Taxable interest for individuals: $1,400 (reported on 55.7% of returns)
This zip code:
$1,400
Ohio:
$1,532
(% of AGI for various income ranges: 5.0% for AGIs below $10k, 3.7% for AGIs $10k-25k, 1.9% for AGIs $25k-50k, 1.4% for AGIs $50k-75k, 1.0% for AGIs $75k-100k, 1.9% for AGIs over 100k)
Taxable dividends: $2,122 (reported on 30.6% of returns)
Here:
$2,122
State:
$3,496
(% of AGI for various income ranges: 2.9% for AGIs below $10k, 2.0% for AGIs $10k-25k, 1.2% for AGIs $25k-50k, 1.1% for AGIs $50k-75k, 1.2% for AGIs $75k-100k, 2.1% for AGIs over 100k)
Net capital gain/loss: +$2,639 (reported on 21.7% of returns)
Here:
+$2,639
State:
+$8,582
(% of AGI for various income ranges: -2.0% for AGIs below $10k, -0.1% for AGIs $10k-25k, 0.2% for AGIs $25k-50k, 0.6% for AGIs $50k-75k, 0.8% for AGIs $75k-100k, 4.3% for AGIs over 100k)
Profit/loss from business: +$9,188 (reported on 11.3% of returns)
Here:
+$9,188
State:
+$10,813
(% of AGI for various income ranges: 4.5% for AGIs below $10k, 4.8% for AGIs $10k-25k, 2.3% for AGIs $25k-50k, 1.9% for AGIs $50k-75k, 1.8% for AGIs $75k-100k, 2.4% for AGIs over 100k)
IRA payment deduction: $2,864 (reported on 3.0% of returns)
44070:
$2,864
Ohio:
$2,794
(% of AGI for various income ranges: 0.2% for AGIs below $10k, 0.3% for AGIs $10k-25k, 0.3% for AGIs $25k-50k, 0.2% for AGIs $50k-75k, 0.2% for AGIs $75k-100k, 0.1% for AGIs over 100k)
Self-employed pension: $7,970 (reported on 0.6% of returns)
Here:
$7,970
Ohio:
$13,981
(% of AGI for various income ranges: 0.0% for AGIs $25k-50k, 0.1% for AGIs $50k-75k, 0.1% for AGIs $75k-100k, 0.3% for AGIs over 100k)
Total itemized deductions: $15,253 (22% of AGI, reported on 44.7% of returns)
Here:
$15,253
State:
$17,503
Here:
22.3% of AGI
State:
20.8% of AGI
(% of AGI for various income ranges: 10.7% for AGIs below $10k, 12.3% for AGIs $10k-25k, 14.4% for AGIs $25k-50k, 16.7% for AGIs $50k-75k, 17.6% for AGIs $75k-100k, 15.5% for AGIs over 100k)
Charity contributions deductions: $1,978 (3% of AGI, reported on 39.0% of returns)
Here:
$1,978
State:
$3,087
Here:
2.8% of AGI
State:
3.4% of AGI
(% of AGI for various income ranges: 0.5% for AGIs below $10k, 1.1% for AGIs $10k-25k, 1.3% for AGIs $25k-50k, 1.8% for AGIs $50k-75k, 2.0% for AGIs $75k-100k, 2.2% for AGIs over 100k)
Total tax: $5,583 (reported on 79.8% of returns)
44070:
$5,583
State:
$6,781
(% of AGI for various income ranges: 2.1% for AGIs below $10k, 4.5% for AGIs $10k-25k, 7.8% for AGIs $25k-50k, 9.3% for AGIs $50k-75k, 10.2% for AGIs $75k-100k, 16.0% for AGIs over 100k)
Earned income credit: $1,539 (reported on 7.5% of returns)
Here:
$1,539
State:
$1,696
Percentage of individuals using paid preparers for their 2004 taxes: 51.7%
Here:
52%
State:
55%
(% for various income ranges: 42.1% for AGIs below $10k, 53.6% for AGIs $10k-25k, 55.2% for AGIs $25k-50k, 54.7% for AGIs $50k-75k, 50.9% for AGIs $75k-100k, 52.4% for AGIs over 100k)
Likely homosexual households (counted as self-reported same-sex unmarried-partner households)
Lesbian couples: 0.4% of all households
Gay men: 0.2% of all households
Household received Food Stamps/SNAP in the past 12 months: 808 Household did not receive Food Stamps/SNAP in the past 12 months: 12,547
Women who had a birth in the past 12 months: 372 (330 now married, 47 unmarried) Women who did not have a birth in the past 12 months: 6,062 (2,755 now married, 3,306 unmarried)
Housing units in zip code 44070 with a mortgage: 6,352 (855 second mortgage, 14 home equity loan, 724 both second mortgage and home equity loan) Houses without a mortgage: 421
Median monthly owner costs for units with a mortgage: $1,517 Median monthly owner costs for units without a mortgage: $671
Residents with income below the poverty level in 2022:
This zip code:
11.0%
Whole state:
13.4%
Residents with income below 50% of the poverty level in 2022:
This zip code:
6.4%
Whole state:
7.0%
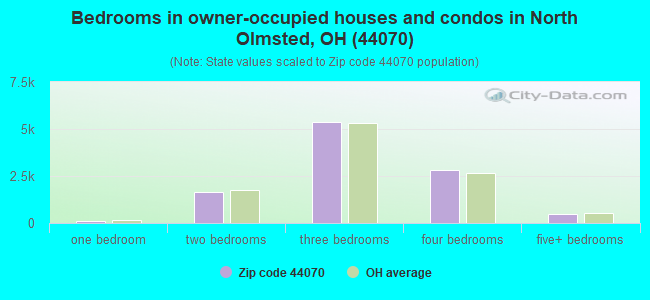
Median number of rooms in houses and condos:
Here:
6.8
State:
6.7
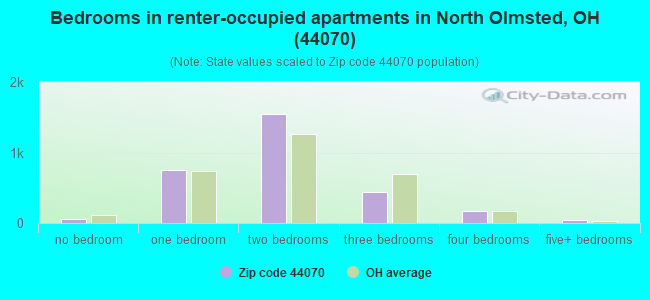
Median number of rooms in apartments:
Here:
4.2
State:
4.4
Notable locations in this zip code not listed on our city pages
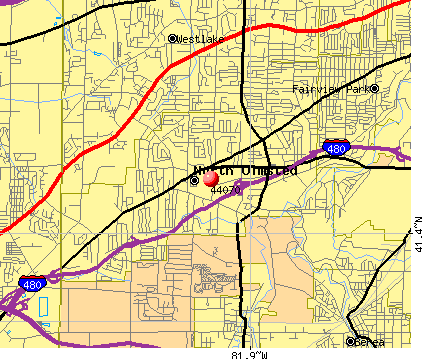
Notable locations in zip code 44070: Cedar Point Picnic Area (A), Rocky River Nature Center (B), Great Northern Corporate Center (C), Great Northern Technical Center (D), North Olmsted Golf Club (E), Spring Vale Country Club (F), Medical Transportation Associates Limited Liability Company (G), North Olmsted Branch Cuyahoga County Public Library (H), North Olmsted Fire Department Station 2 (I), North Olmsted Fire Department Station 1 (J), Frostville Museum (K), North Olmsted City Hall (L). Display/hide their locations on the map
Shopping Centers: Victory Plaza Shopping Center (1), Great Northern Mall Shopping Center (2), Great Northern Plaza Shopping Center (3), Northgate Shopping Center (4), Olmsted Plaza Shopping Center (5), Brooklor Shopping Center (6). Display/hide their locations on the map
Churches in zip code 44070 include: First Universalist Church of Olmsted (A), Christ the King Church (B), Saint Brendans Church (C), Saint Richards Church (D). Display/hide their locations on the map
Parks in zip code 44070 include: Barton-Bradley Recreation Field (1), North Olmsted Recreation Center (2), North Olmsted Park (3). Display/hide their locations on the map
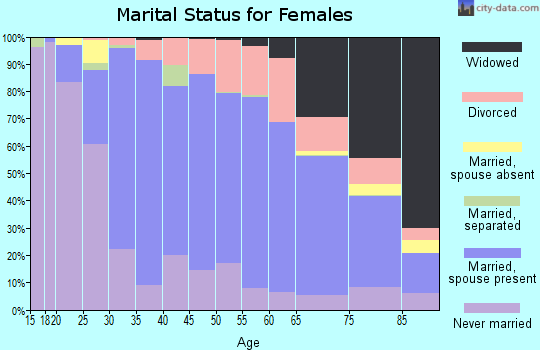
5,046 married couples with children.
1,626 single-parent households (359 men, 1,267 women).
86.2% of residents of 44070 zip code speak English at home.
3.0% of residents speak Spanish at home (61% very well, 12% well, 18% not well, 9% not at all).
4.6% of residents speak other Indo-European language at home (65% very well, 32% well, 3% not well, 1% not at all).
1.4% of residents speak Asian or Pacific Island language at home (53% very well, 17% well, 29% not well, 1% not at all).
5.0% of residents speak other language at home (63% very well, 16% well, 21% not well).
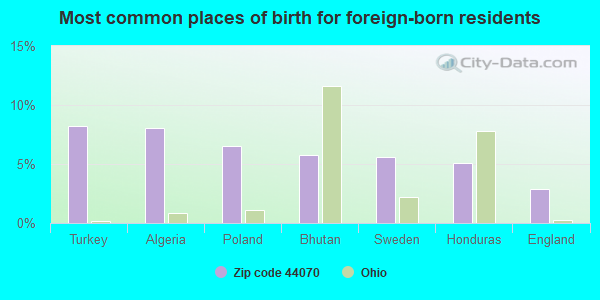
Foreign born population: 3,273 (10.2%) (67.9% of them are naturalized citizens)
This zip code:
10.2%
Whole state:
5.0%
8%Turkey
8%Algeria
7%Poland
6%Bhutan
6%Sweden
5%Honduras
3%England
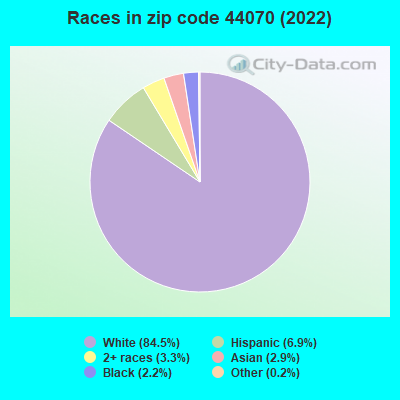
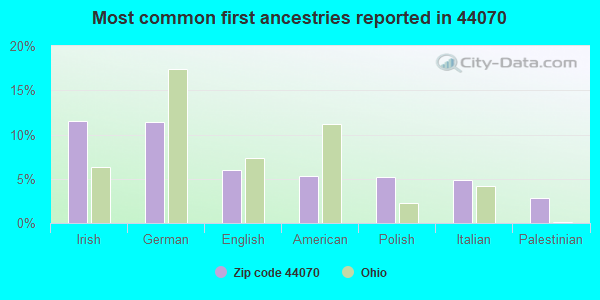
11%Irish
11%German
6%English
5%American
5%Polish
5%Italian
3%Palestinian
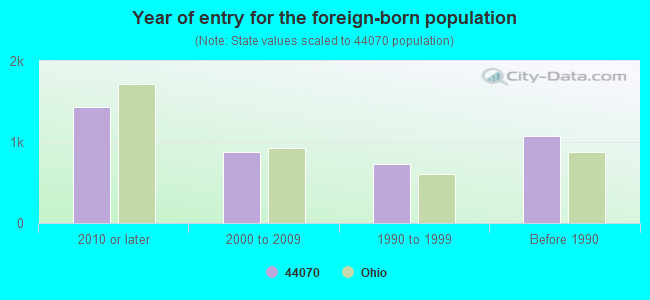
Year of entry for the foreign-born population
1,4362010 or later
8772000 to 2009
7261990 to 1999
1,080Before 1990
Facilities with environmental interests located in this zip code:
BP AMOCO CO 22402 (23425 LORAIN RD in NORTH OLMSTED, OH)
AIR MINOR (AIRS/AFS) ENFORCEMENT/COMPLIANCE ACTIVITY (Integrated Compliance Information System) STATE MASTER (Ohio general info) - RCRA-OHD987025822, HAZARDOUS WASTE PROGRAM, AIR MAJOR, -18-5541-168-21, EPCRA Conditionally Exempt Small Quantity Generators, less than 100 kg/month of hazardous waste (Resource Conservation and Recovery Act (tracking hazardous waste)) - notification Business SIC classification: GASOLINE SERVICE STATIONS Organizations: BP OIL CO (CONTACT/OWNER)
, BP OIL COMPANY (CONTACT/OWNER)
Alternative names: BP OIL CO SITE 04836
BP OIL NO 04868 (25410 LORAIN RD in NORTH OLMSTED, OH)
STATE MASTER (Ohio general info) - AIR MAJOR (Resource Conservation and Recovery Act (tracking hazardous waste)) Organizations: BP OIL COMPANY (CONTACT/OWNER)
Alternative names: BP OIL CO SITE 04868
BERT AUTO BODY (24265 LORAIN RD in NORTH OLMSTED, OH)
STATE MASTER (Ohio general info) - RCRA-OHD093925733, HAZARDOUS WASTE PROGRAM Conditionally Exempt Small Quantity Generators, less than 100 kg/month of hazardous waste (Resource Conservation and Recovery Act (tracking hazardous waste)) - notification Organizations: BERT CLARENCE A (CONTACT/OWNER)
BP OIL CO SITE 04840 (29131 LORAIN RD in NORTH OLMSTED, OH)
STATE MASTER (Ohio general info) - RCRA-OHD987025814, HAZARDOUS WASTE PROGRAM, AIR MAJOR, -18-5541-168-11, EPCRA Conditionally Exempt Small Quantity Generators, less than 100 kg/month of hazardous waste (Resource Conservation and Recovery Act (tracking hazardous waste)) - notification Organizations: BP OIL COMPANY (CONTACT/OWNER)
ALL PRO AUTO BODY AND FRAME INC (27932 LORAIN RD in NORTH OLMSTED, OH)
(Resource Conservation and Recovery Act (tracking hazardous waste)) Organizations: PAVLOVICH DANNY (CONTACT/OWNER)
ABUNDANT LIVING CHRISTIAN ACAD (3874 COLUMBIA RD in NORTH OLMSTED, OH)
COMPLIANCE ACTIVITY (Tracking inspections of insecticide, fungicide, and rodenticide, and toxic substances)
Housing units lacking complete plumbing facilities: 0.3% Housing units lacking complete kitchen facilities: 1.0%
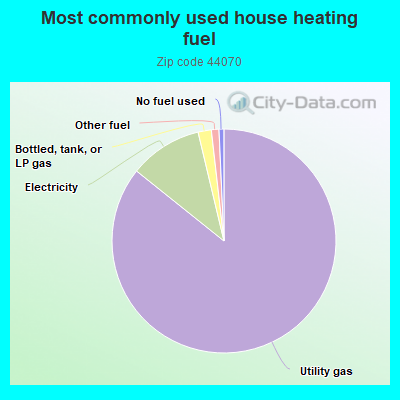
85.5%Utility gas
10.5%Electricity
1.9%Bottled, tank, or LP gas
1.1%Other fuel
0.7%No fuel used
Population in 1990: 34,123.
Place of birth for U.S.-born residents:
This state: 23,725
Northeast: 1,765
Midwest: 930
South: 970
West: 729
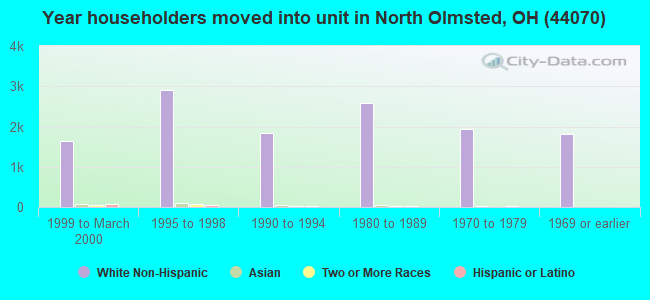
66% of the 44070 zip code residents lived in the same house 5 years ago. Out of people who lived in different houses, 71% lived in this county. Out of people who lived in different counties, 50% lived in Ohio.
92% of the 44070 zip code residents lived in the same house 1 year ago. Out of people who lived in different houses, 58% moved from this county. Out of people who lived in different houses, 15% moved from different county within same state. Out of people who lived in different houses, 14% moved from different state. Out of people who lived in different houses, 17% moved from abroad.
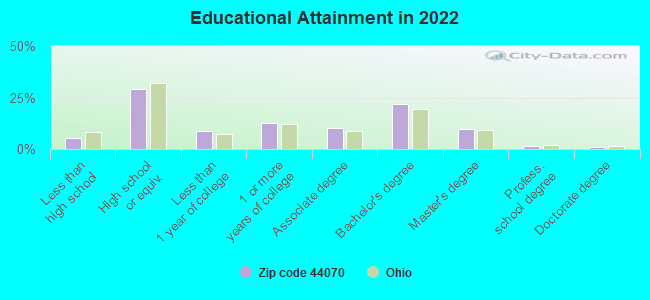
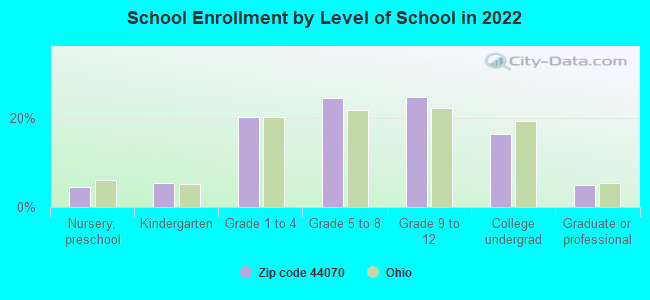
Private vs. public school enrollment:
Students in private schools in grades 1 to 8 (elementary and middle school): 730
Here:
21.7%
Ohio:
16.0%
Students in private schools in grades 9 to 12 (high school): 352
Here:
18.9%
Ohio:
13.1%
Students in private undergraduate colleges: 237
Here:
19.2%
Ohio:
22.3%
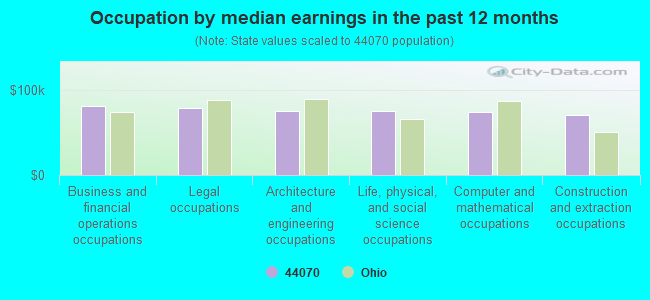
Occupation by median earnings in the past 12 months ($)
80,950Business and financial operations occupations
78,894Legal occupations
76,049Architecture and engineering occupations
75,705Life, physical, and social science occupations
74,049Computer and mathematical occupations
70,656Construction and extraction occupations
Companies with federal contracts located in this zip code:
GRAS NA INC (23621 LORAIN RD in NORTH OLMSTED, OH; small business) : $135,587 in 15 contractsfrom 2002 to 2006
Contracts for Physical Properties Testing and Inspection, Headsets, Handsets, Microphones and Speakers, , Electrical and Electronic Properties Measuring and Testing Instruments, and moreby Army, NASA, Centers for Disease Control and Prevention, Air Force, and others Signed by year:2000: $0; 2001: $0; 2002: $39,045; 2003: $13,868; 2004: $30,753; 2005: $28,685; 2006: $23,236.
Biggest contracts:
$39,045 with Army for Physical Properties Testing and Inspection. Signed on 2002-12-12. Completion date: 2003-01-13.
$17,518 with Army for Headsets, Handsets, Microphones and Speakers. Signed on 2004-05-27. Completion date: 2004-05-17.
$15,410 with NASA for . Signed on 2005-09-13. Completion date: 2005-10-14.
$9,260 with NASA for Electrical and Electronic Properties Measuring and Testing Instruments. Signed on 2005-09-29. Completion date: 2005-11-29.
Top industries in this zip code by the number of employees in 2005:
2002 - 2018 National Fire Incident Reporting System (NFIRS) incidents
According to the data from the years 2002 - 2018 the average number of fires per year is 135. The highest number of reported fire incidents - 163 took place in 2008, and the least - 99 in 2014. The data has a dropping trend.
When looking into fire subcategories, the most reports belonged to: Structure Fires (58.2%), and Outside Fires (28.8%).
Fire incident types reported to NFIRS in Zip Code 44070
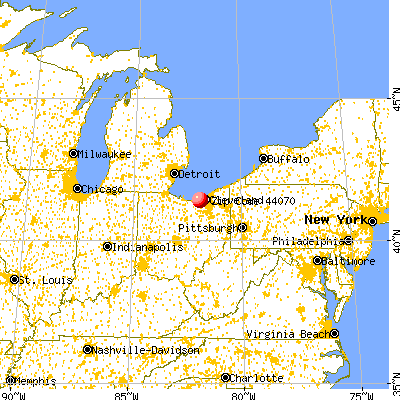


 Nearest zip codes: 44145, 44138, 44126, 44017, 44140, 44142.
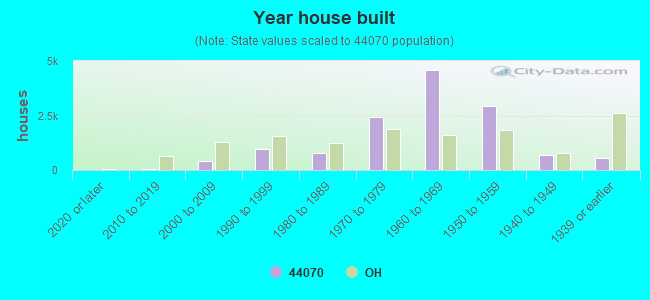


 According to the data from the years 2002 - 2018 the average number of fires per year is 135. The highest number of reported fire incidents - 163 took place in 2008, and the least - 99 in 2014. The data has a dropping trend.
 When looking into fire subcategories, the most reports belonged to: Structure Fires (58.2%), and Outside Fires (28.8%).