Races in Parker, Colorado (CO) Detailed Stats
Data:
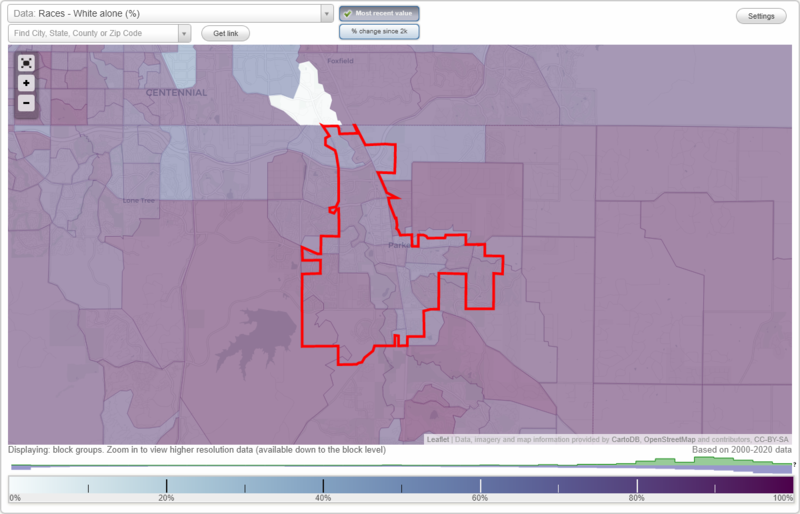
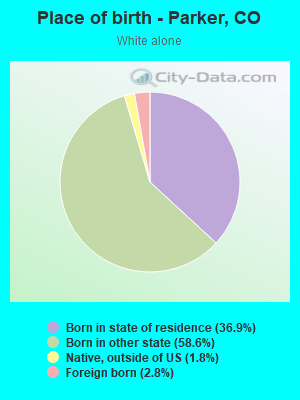
Races - White alone (%)
Races - White alone (% change since 2000)
Races - Black alone (%)
Races - Black alone (% change since 2000)
Races - American Indian alone (%)
Races - American Indian alone (% change since 2000)
Races - Asian alone (%)
Races - Asian alone (% change since 2000)
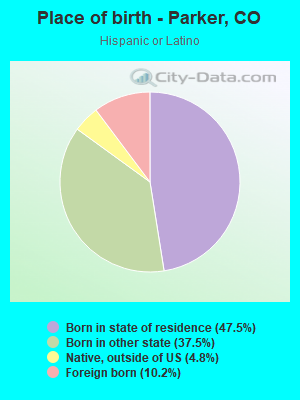
Races - Hispanic (%)
Races - Hispanic (% change since 2000)
Races - Native Hawaiian and Other Pacific Islander alone (%)
Races - Native Hawaiian and Other Pacific Islander alone (% change since 2000)
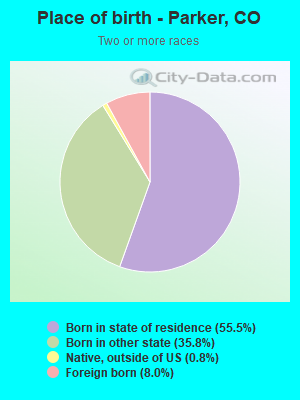
Races - Two or more races(%)
Races - Two or more races(% change since 2000)
Races - Other race alone (%)
Races - Other race alone (% change since 2000)
Racial diversity
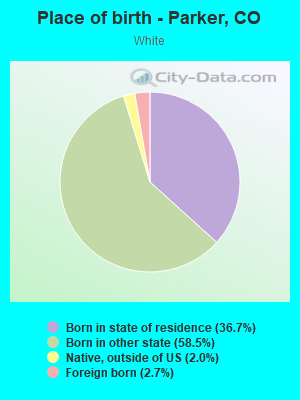
Place of birth - Born in state of residence (%)
Place of birth - Born in state of residence (%) - White
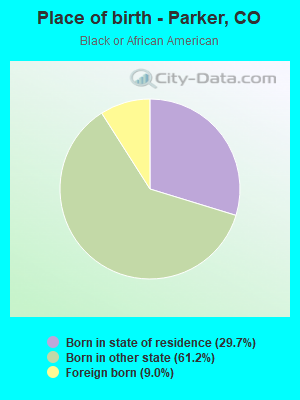
Place of birth - Born in state of residence (%) - Black or African American
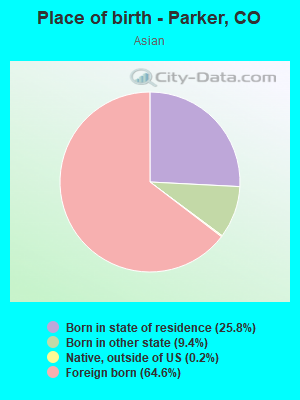
Place of birth - Born in state of residence (%) - Asian
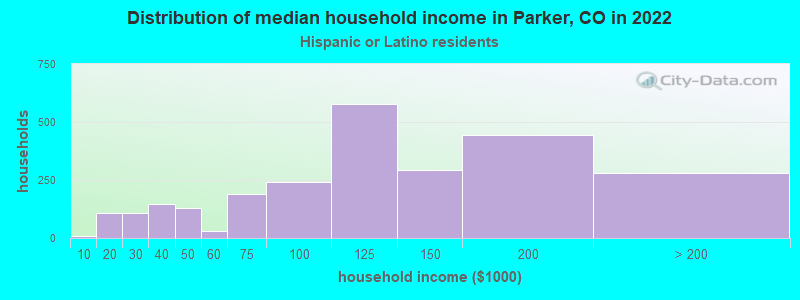
Place of birth - Born in state of residence (%) - Hispanic or Latino
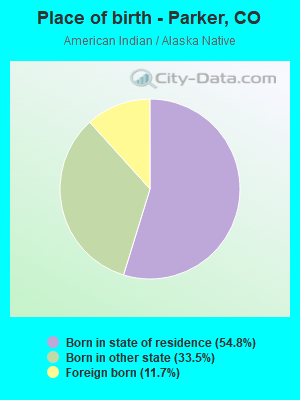
Place of birth - Born in state of residence (%) - American Indian and Alaska Native
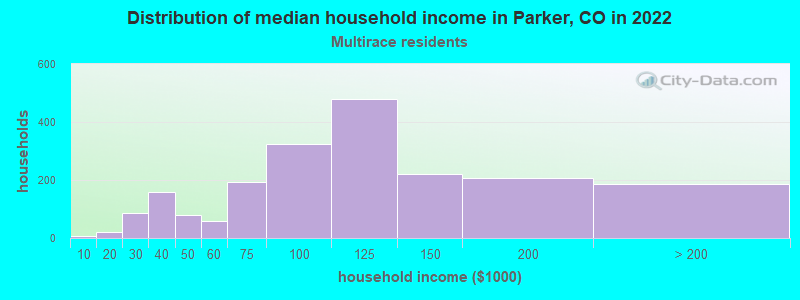
Place of birth - Born in state of residence (%) - Multirace
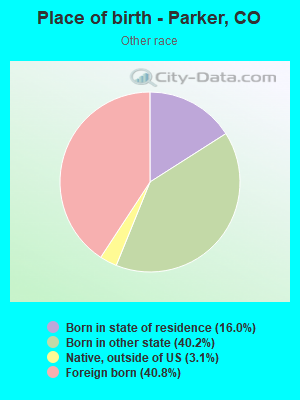
Place of birth - Born in state of residence (%) - Other Race
Place of birth - Born in other state (%)
Place of birth - Born in other state (%) - White
Place of birth - Born in other state (%) - Black or African American
Place of birth - Born in other state (%) - Asian
Place of birth - Born in other state (%) - Hispanic or Latino
Place of birth - Born in other state (%) - American Indian and Alaska Native
Place of birth - Born in other state (%) - Multirace
Place of birth - Born in other state (%) - Other Race
Place of birth - Native, outside of US (%)
Place of birth - Native, outside of US (%) - White
Place of birth - Native, outside of US (%) - Black or African American
Place of birth - Native, outside of US (%) - Asian
Place of birth - Native, outside of US (%) - Hispanic or Latino
Place of birth - Native, outside of US (%) - American Indian and Alaska Native
Place of birth - Native, outside of US (%) - Multirace
Place of birth - Native, outside of US (%) - Other Race
Place of birth - Foreign born (%)
Place of birth - Foreign born (%) - White
Place of birth - Foreign born (%) - Black or African American
Place of birth - Foreign born (%) - Asian
Place of birth - Foreign born (%) - Hispanic or Latino
Place of birth - Foreign born (%) - American Indian and Alaska Native
Place of birth - Foreign born (%) - Multirace
Place of birth - Foreign born (%) - Other Race
Residents speaking English at home (%)
Residents speaking English at home - Born in the United States (%)
Residents speaking English at home - Native, born elsewhere (%)
Residents speaking English at home - Foreign born (%)
Residents speaking Spanish at home (%)
Residents speaking Spanish at home - Born in the United States (%)
Residents speaking Spanish at home - Native, born elsewhere (%)
Residents speaking Spanish at home - Foreign born (%)
Residents speaking other language at home (%)
Residents speaking other language at home - Born in the United States (%)
Residents speaking other language at home - Native, born elsewhere (%)
Residents speaking other language at home - Foreign born (%)
Marital status - Never married (%)
Marital status - Now married (%)
Marital status - Separated (%)
Marital status - Widowed (%)
Marital status - Divorced (%)
Ancestries Reported - Arab (%)
Ancestries Reported - Czech (%)
Ancestries Reported - Danish (%)
Ancestries Reported - Dutch (%)
Ancestries Reported - English (%)
Ancestries Reported - French (%)
Ancestries Reported - French Canadian (%)
Ancestries Reported - German (%)
Ancestries Reported - Greek (%)
Ancestries Reported - Hungarian (%)
Ancestries Reported - Irish (%)
Ancestries Reported - Italian (%)
Ancestries Reported - Lithuanian (%)
Ancestries Reported - Norwegian (%)
Ancestries Reported - Polish (%)
Ancestries Reported - Portuguese (%)
Ancestries Reported - Russian (%)
Ancestries Reported - Scotch-Irish (%)
Ancestries Reported - Scottish (%)
Ancestries Reported - Slovak (%)
Ancestries Reported - Subsaharan African (%)
Ancestries Reported - Swedish (%)
Ancestries Reported - Swiss (%)
Ancestries Reported - Ukrainian (%)
Ancestries Reported - United States (%)
Ancestries Reported - Welsh (%)
Ancestries Reported - West Indian (%)
Ancestries Reported - Other (%)
Geographical mobility - Same house 1 year ago (%)
Geographical mobility - Same house 1 year ago (%) - White
Geographical mobility - Same house 1 year ago (%) - Black or African American
Geographical mobility - Same house 1 year ago (%) - Asian
Geographical mobility - Same house 1 year ago (%) - Hispanic or Latino
Geographical mobility - Same house 1 year ago (%) - American Indian and Alaska Native
Geographical mobility - Same house 1 year ago (%) - Multirace
Geographical mobility - Same house 1 year ago (%) - Other Race
Geographical mobility - Moved within same county (%)
Geographical mobility - Moved within same county (%) - White
Geographical mobility - Moved within same county (%) - Black or African American
Geographical mobility - Moved within same county (%) - Asian
Geographical mobility - Moved within same county (%) - Hispanic or Latino
Geographical mobility - Moved within same county (%) - American Indian and Alaska Native
Geographical mobility - Moved within same county (%) - Multirace
Geographical mobility - Moved within same county (%) - Other Race
Geographical mobility - Moved from different county within same state (%)
Geographical mobility - Moved from different county within same state (%) - White
Geographical mobility - Moved from different county within same state (%) - Black or African American
Geographical mobility - Moved from different county within same state (%) - Asian
Geographical mobility - Moved from different county within same state (%) - Hispanic or Latino
Geographical mobility - Moved from different county within same state (%) - American Indian and Alaska Native
Geographical mobility - Moved from different county within same state (%) - Multirace
Geographical mobility - Moved from different county within same state (%) - Other Race
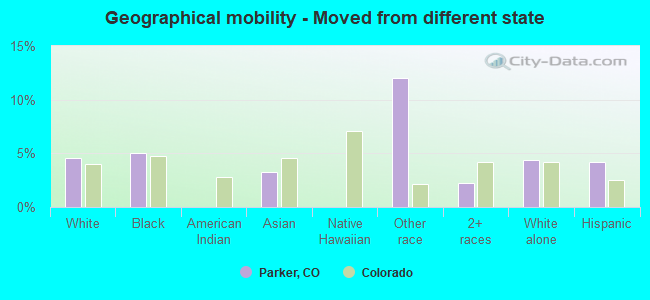
Geographical mobility - Moved from different state (%)
Geographical mobility - Moved from different state (%) - White
Geographical mobility - Moved from different state (%) - Black or African American
Geographical mobility - Moved from different state (%) - Asian
Geographical mobility - Moved from different state (%) - Hispanic or Latino
Geographical mobility - Moved from different state (%) - American Indian and Alaska Native
Geographical mobility - Moved from different state (%) - Multirace
Geographical mobility - Moved from different state (%) - Other Race
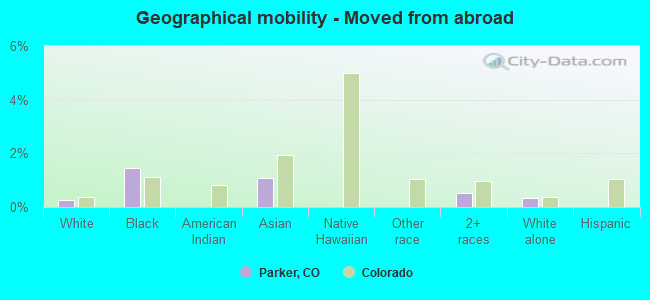
Geographical mobility - Moved from abroad (%)
Geographical mobility - Moved from abroad (%) - White
Geographical mobility - Moved from abroad (%) - Black or African American
Geographical mobility - Moved from abroad (%) - Asian
Geographical mobility - Moved from abroad (%) - Hispanic or Latino
Geographical mobility - Moved from abroad (%) - American Indian and Alaska Native
Geographical mobility - Moved from abroad (%) - Multirace
Geographical mobility - Moved from abroad (%) - Other Race
Place of birth for the foreign-born population - Ireland (%)
Place of birth for the foreign-born population - Denmark (%)
Place of birth for the foreign-born population - Norway (%)
Place of birth for the foreign-born population - Sweden (%)
Place of birth for the foreign-born population - United Kingdom (%)
Place of birth for the foreign-born population - England (%)
Place of birth for the foreign-born population - Scotland (%)
Place of birth for the foreign-born population - Other Northern Europe (%)
Place of birth for the foreign-born population - Austria (%)
Place of birth for the foreign-born population - Belgium (%)
Place of birth for the foreign-born population - France (%)
Place of birth for the foreign-born population - Germany (%)
Place of birth for the foreign-born population - Netherlands (%)
Place of birth for the foreign-born population - Switzerland (%)
Place of birth for the foreign-born population - Other Western Europe (%)
Place of birth for the foreign-born population - Greece (%)
Place of birth for the foreign-born population - Italy (%)
Place of birth for the foreign-born population - Portugal (%)
Place of birth for the foreign-born population - Spain (%)
Place of birth for the foreign-born population - Other Southern Europe (%)
Place of birth for the foreign-born population - Albania (%)
Place of birth for the foreign-born population - Belarus (%)
Place of birth for the foreign-born population - Bosnia and Herzegovina (%)
Place of birth for the foreign-born population - Bulgaria (%)
Place of birth for the foreign-born population - Croatia (%)
Place of birth for the foreign-born population - Czechoslovakia (%)
Place of birth for the foreign-born population - Hungary (%)
Place of birth for the foreign-born population - Latvia (%)
Place of birth for the foreign-born population - Lithuania (%)
Place of birth for the foreign-born population - North Macedonia (Macedonia) (%)
Place of birth for the foreign-born population - Moldova (%)
Place of birth for the foreign-born population - Poland (%)
Place of birth for the foreign-born population - Romania (%)
Place of birth for the foreign-born population - Russia (%)
Place of birth for the foreign-born population - Serbia (%)
Place of birth for the foreign-born population - Ukraine (%)
Place of birth for the foreign-born population - Other Eastern Europe (%)
Place of birth for the foreign-born population - China (%)
Place of birth for the foreign-born population - Hong Kong (%)
Place of birth for the foreign-born population - Taiwan (%)
Place of birth for the foreign-born population - Japan (%)
Place of birth for the foreign-born population - Korea (%)
Place of birth for the foreign-born population - Other Eastern Asia (%)
Place of birth for the foreign-born population - Afghanistan (%)
Place of birth for the foreign-born population - Bangladesh (%)
Place of birth for the foreign-born population - India (%)
Place of birth for the foreign-born population - Iran (%)
Place of birth for the foreign-born population - Kazakhstan (%)
Place of birth for the foreign-born population - Nepal (%)
Place of birth for the foreign-born population - Pakistan (%)
Place of birth for the foreign-born population - Sri Lanka (%)
Place of birth for the foreign-born population - Uzbekistan (%)
Place of birth for the foreign-born population - Other South Central Asia (%)
Place of birth for the foreign-born population - Burma (%)
Place of birth for the foreign-born population - Cambodia (%)
Place of birth for the foreign-born population - Indonesia (%)
Place of birth for the foreign-born population - Laos (%)
Place of birth for the foreign-born population - Malaysia (%)
Place of birth for the foreign-born population - Philippines (%)
Place of birth for the foreign-born population - Singapore (%)
Place of birth for the foreign-born population - Thailand (%)
Place of birth for the foreign-born population - Vietnam (%)
Place of birth for the foreign-born population - Other South Eastern Asia (%)
Place of birth for the foreign-born population - Armenia (%)
Place of birth for the foreign-born population - Iraq (%)
Place of birth for the foreign-born population - Israel (%)
Place of birth for the foreign-born population - Jordan (%)
Place of birth for the foreign-born population - Kuwait (%)
Place of birth for the foreign-born population - Lebanon (%)
Place of birth for the foreign-born population - Saudi Arabia (%)
Place of birth for the foreign-born population - Syria (%)
Place of birth for the foreign-born population - Turkey (%)
Place of birth for the foreign-born population - Yemen (%)
Place of birth for the foreign-born population - Other Western Asia (%)
Place of birth for the foreign-born population - Eritrea (%)
Place of birth for the foreign-born population - Ethiopia (%)
Place of birth for the foreign-born population - Kenya (%)
Place of birth for the foreign-born population - Somalia (%)
Place of birth for the foreign-born population - Uganda (%)
Place of birth for the foreign-born population - Zimbabwe (%)
Place of birth for the foreign-born population - Other Eastern Africa (%)
Place of birth for the foreign-born population - Cameroon (%)
Place of birth for the foreign-born population - Congo (%)
Place of birth for the foreign-born population - Democratic Republic of Congo (Zaire) (%)
Place of birth for the foreign-born population - Other Middle Africa (%)
Place of birth for the foreign-born population - Egypt (%)
Place of birth for the foreign-born population - Morocco (%)
Place of birth for the foreign-born population - Sudan (%)
Place of birth for the foreign-born population - Other Northern Africa (%)
Place of birth for the foreign-born population - South Africa (%)
Place of birth for the foreign-born population - Other Southern Africa (%)
Place of birth for the foreign-born population - Cabo Verde (%)
Place of birth for the foreign-born population - Ghana (%)
Place of birth for the foreign-born population - Liberia (%)
Place of birth for the foreign-born population - Nigeria (%)
Place of birth for the foreign-born population - Senegal (%)
Place of birth for the foreign-born population - Sierra Leone (%)
Place of birth for the foreign-born population - Other Western Africa (%)
Place of birth for the foreign-born population - Australia (%)
Place of birth for the foreign-born population - New Zealand (%)
Place of birth for the foreign-born population - Fiji (%)
Place of birth for the foreign-born population - Micronesia (%)
Place of birth for the foreign-born population - Bahamas (%)
Place of birth for the foreign-born population - Barbados (%)
Place of birth for the foreign-born population - Cuba (%)
Place of birth for the foreign-born population - Dominica (%)
Place of birth for the foreign-born population - Dominican Republic (%)
Place of birth for the foreign-born population - Grenada (%)
Place of birth for the foreign-born population - Haiti (%)
Place of birth for the foreign-born population - Jamaica (%)
Place of birth for the foreign-born population - St. Vincent and the Grenadines (%)
Place of birth for the foreign-born population - Trinidad and Tobago (%)
Place of birth for the foreign-born population - West Indies (%)
Place of birth for the foreign-born population - Other Caribbean (%)
Place of birth for the foreign-born population - Belize (%)
Place of birth for the foreign-born population - Costa Rica (%)
Place of birth for the foreign-born population - El Salvador (%)
Place of birth for the foreign-born population - Guatemala (%)
Place of birth for the foreign-born population - Honduras (%)
Place of birth for the foreign-born population - Mexico (%)
Place of birth for the foreign-born population - Nicaragua (%)
Place of birth for the foreign-born population - Panama (%)
Place of birth for the foreign-born population - Other Central America (%)
Place of birth for the foreign-born population - Argentina (%)
Place of birth for the foreign-born population - Bolivia (%)
Place of birth for the foreign-born population - Brazil (%)
Place of birth for the foreign-born population - Chile (%)
Place of birth for the foreign-born population - Colombia (%)
Place of birth for the foreign-born population - Ecuador (%)
Place of birth for the foreign-born population - Guyana (%)
Place of birth for the foreign-born population - Peru (%)
Place of birth for the foreign-born population - Uruguay (%)
Place of birth for the foreign-born population - Venezuela (%)
Place of birth for the foreign-born population - Other South America (%)
Place of birth for the foreign-born population - Canada (%)
Place of birth for the foreign-born population - Other Northern America (%)
Place of birth for the foreign-born population - Other (%)
Latest news about races in Parker, CO collected exclusively by city-data.com from local newspapers, TV, and radio stations
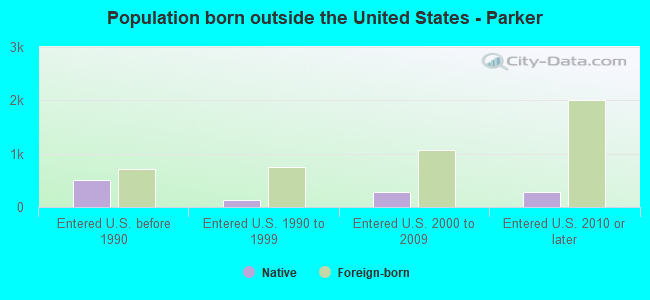
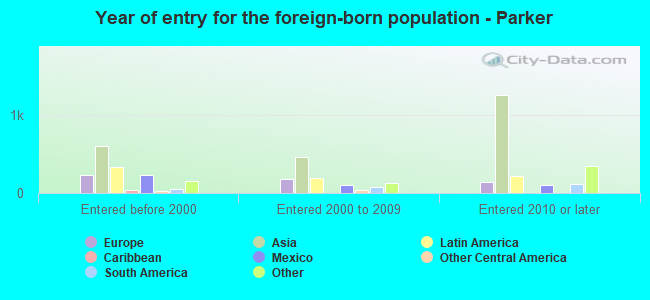
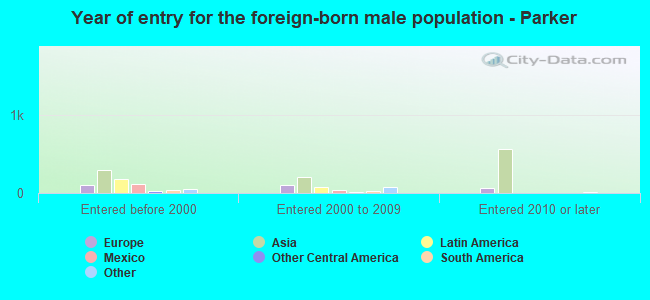
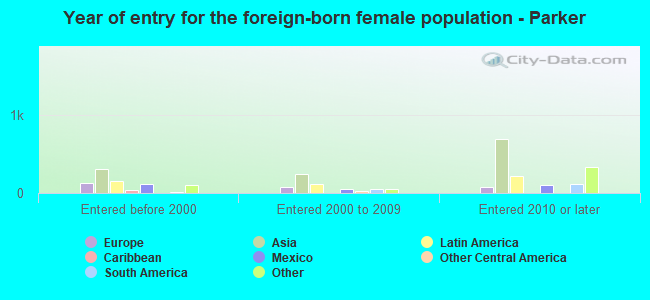
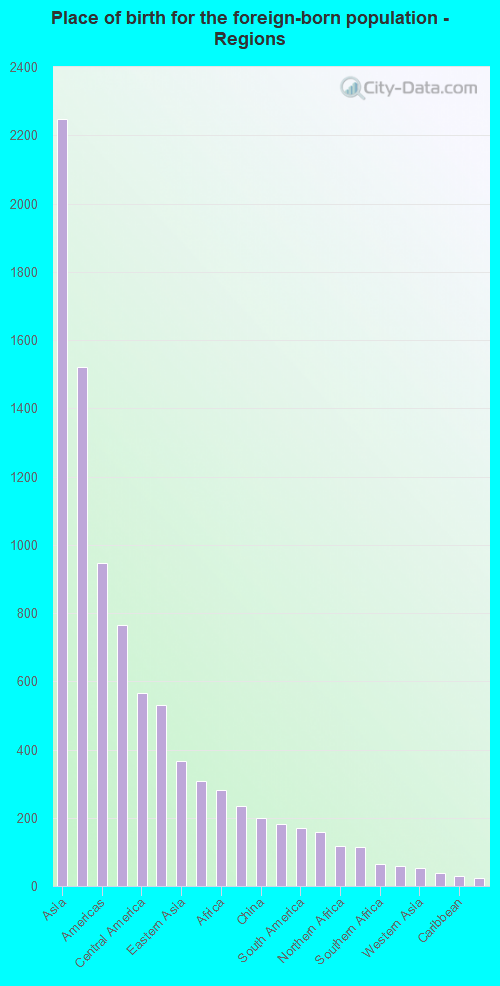
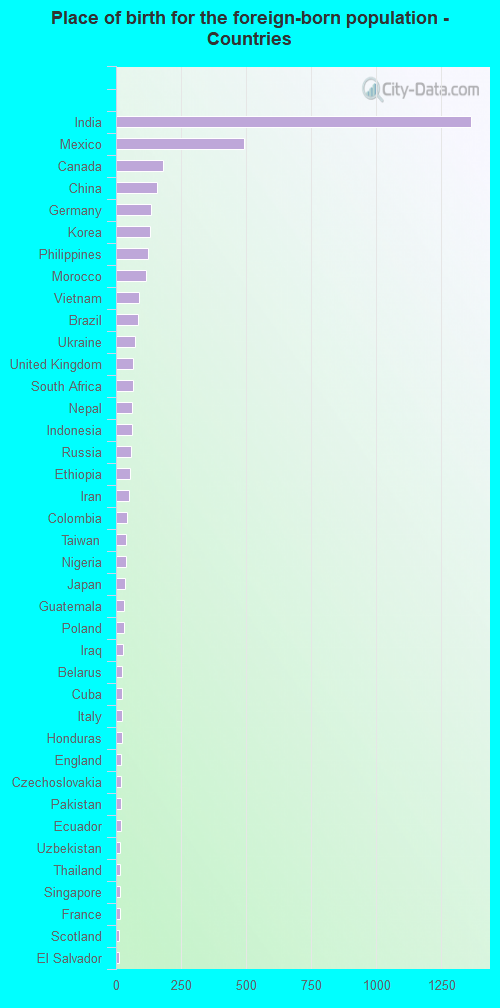
According to 2022 data, the most numerous races in Parker, CO are White alone (44,698 residents), Hispanic (6,428 residents), and Two or more races (2,268 residents). 90.7% of Parker residents speak English at home. 6.9% of Parker, CO residents are foreign-born (4.0% born in Asia, 1.4% born in Latin America, 1.0% born in Europe), which is 30.6% less than the foreign-born rate of 9.0% across the entire state of Colorado.
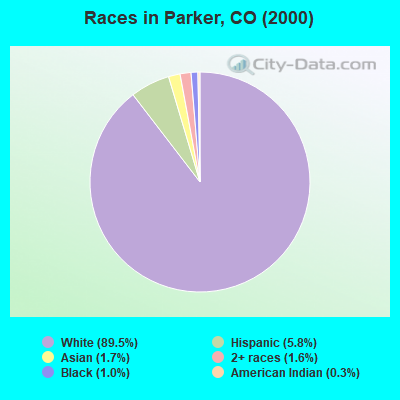
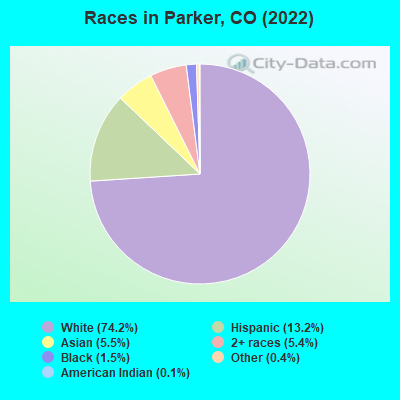
Race distribution in Parker
2000 2022
3,202,880 74.5% White alone 735,601 17.1% Hispanic 158,443 3.7% Black alone 93,277 2.2% Asian alone 72,721 1.7% Two or more races 28,982 0.7% American Indian alone 5,512 0.1% Other race alone 3,845 0.09% Native Hawaiian and Other
3,793,270 65.0% White alone 1,314,962 22.5% Hispanic 268,754 4.6% Two or more races 220,756 3.8% Black alone 182,658 3.1% Asian alone 29,798 0.5% Other race alone 23,389 0.4% American Indian alone 6,339 0.1% Native Hawaiian and Other
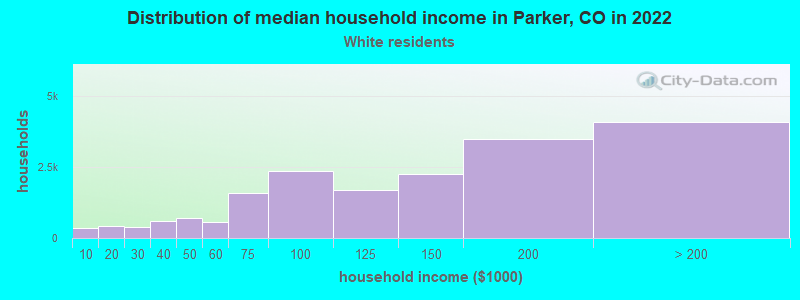
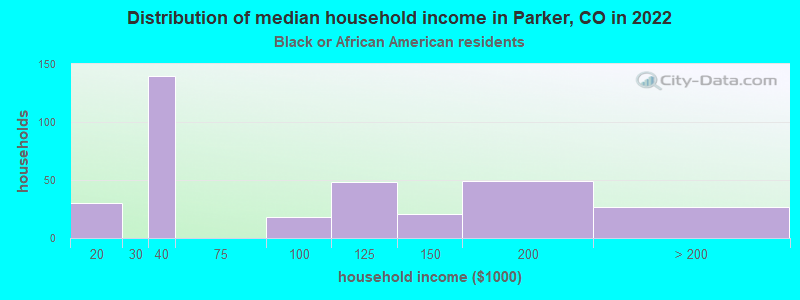
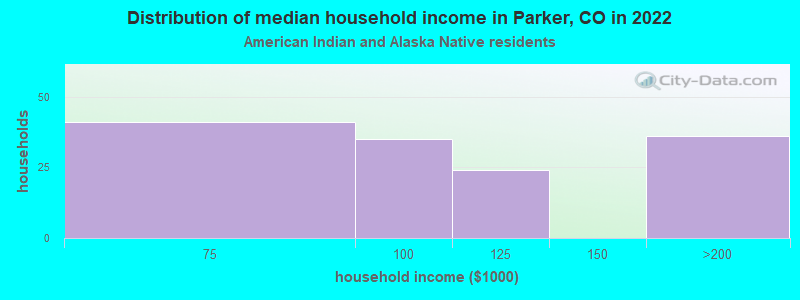
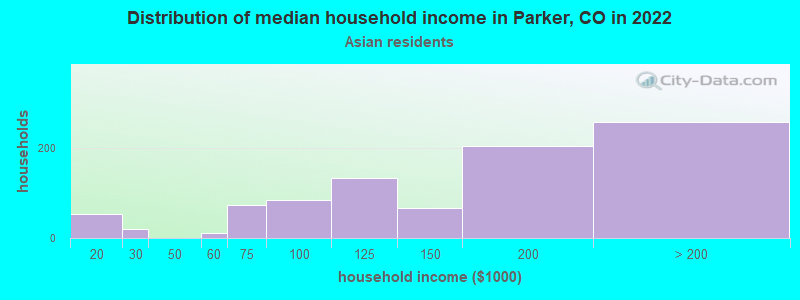
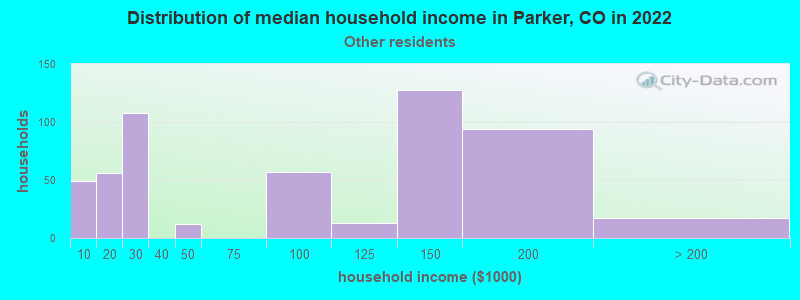
Income and house value in Parker Median household income in 2022 $141,369 White non-Hispanic householders$122,129 Black householders$107,839 American Indian and Alaska Native householders$167,809 Asian householders$77,425 Native Hawaiian and other Pacific Islander householders$98,847 Some other race householders$124,658 Two or more races householders$116,158 Hispanic or Latino race householdersMedian 2022 house value $644,219 White Non-Hispanic householders$762,979 Black or African American householders$754,022 American Indian or Alaska Native householders $724,166 Asian householders$587,494 Some other race householders$678,056 Two or more races householders$637,585 Hispanic or Latino householders
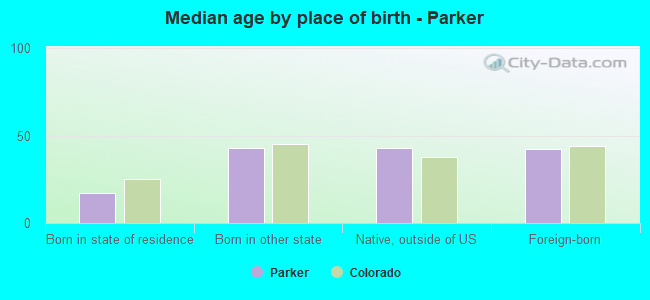
Median age by race in Parker
37.3 Median age for White residents36.3 37.8 45.3 Median age for Black or African American residents42.8 46.0 25.1 Median age for American Indian / Alaska Native residents12.8 29.3 36.7 Median age for Asian residents35.6 37.1 83.3 Median age for Native Hawaiian / Pacific Islander residents32.7 Median age for Other race residents29.9 35.7 23.6 Median age for Two or more races residents26.4 20.4 37.0 Median age for White alone residents36.5 37.6 29.7 Median age for Hispanic or Latino residents31.3 30.2
Owner/renter occupied households by race in Parker
House owners and renters - White residents 14,061 79.9% Owner occupied3,536 20.1% Renter occupiedHouse owners and renters - Black or African American residents 262 61.1% Owner occupied166 38.9% Renter occupiedHouse owners and renters - American Indian / Alaska Native residents 43 73.8% Owner occupied15 26.2% Renter occupiedHouse owners and renters - Asian residents 861 85.4% Owner occupied147 14.6% Renter occupiedHouse owners and renters - Native Hawaiian / Pacific Islander residents 41 100.0% Renter occupiedHouse owners and renters - Other race residents 67 17.3% Owner occupied318 82.7% Renter occupiedHouse owners and renters - Two or more races residents 922 70.4% Owner occupied387 29.6% Renter occupiedHouse owners and renters - White alone residents 13,563 80.2% Owner occupied3,353 19.8% Renter occupiedHouse owners and renters - Hispanic or Latino residents 1,278 61.4% Owner occupied802 38.6% Renter occupied
Language usage in Parker
English speakers - Total 90.7% of residents of Parker speak English at home.
3.7% of residents speak Spanish at home 1,499 78.6% Speak English very well409 21.4% Speak English less than very well6.1% of residents speak other language at home 2,146 67.0% Speak English very well1,056 33.0% Speak English less than very well
English speakers - Born in the United States 96.2% of residents of Parker speak English at home.
1.9% of residents speak Spanish at home 497 90.5% Speak English very well52 9.5% Speak English less than very well1.9% of residents speak other language at home 495 91.5% Speak English very well46 8.5% Speak English less than very well
English speakers - Native, born elsewhere 68.8% of residents of Parker speak English at home.
23.0% of residents speak Spanish at home 222 90.2% Speak English very well24 9.8% Speak English less than very well8.4% of residents speak other language at home 90 100.0% Speak English very well
English speakers - Foreign-born 32.2% of residents of Parker speak English at home.
12.5% of residents speak Spanish at home 296 60.9% Speak English very well190 39.1% Speak English less than very well58.4% of residents speak other language at home 1,283 56.6% Speak English very well985 43.4% Speak English less than very well
White (Caucasian) - Speak only English Native:
97.1% (41,229)Foreign-born:
53.9% (668)
White (Caucasian) - Speak another language Native:
3.8% (1,632)Foreign-born:
55.4% (686)
Black or African American - Speak only English Native:
90.6% (766)Foreign-born:
57.7% (44)
Black or African American - Speak another language Native:
9.7% (82)Foreign-born:
37.6% (28)
American Indian / Alaska Native - Speak only English Native:
88.2% (209)Foreign-born:
63.2% (24)
Asian - Speak only English Native:
93.0% (968)Foreign-born:
29.4% (586)
Asian - Speak another language Native:
15.8% (165)Foreign-born:
71.2% (1,419)
Other race - Speak only English Native:
75.8% (424)Foreign-born:
20.2% (59)
Other race - Speak another language Native:
22.9% (128)Foreign-born:
85.2% (247)
Two or more races - Speak only English Native:
82.6% (4,262)Foreign-born:
50.7% (230)
Two or more races - Speak another language Native:
10.0% (515)Foreign-born:
14.8% (67)
White alone - Speak only English Native:
97.1% (39,602)Foreign-born:
53.6% (648)
White alone - Speak another language Native:
2.9% (1,180)Foreign-born:
45.9% (555)
Hispanic or Latino - Speak only English Native:
81.4% (4,294)Foreign-born:
33.2% (198)
Hispanic or Latino - Speak another language Native:
20.2% (1,067)Foreign-born:
77.7% (464)
Foreign-born residents in Parker 4,025 residents are foreign born (4.0% Asia , 1.4% Latin America , 1.0% Europe ).
This city:
6.9%Colorado:
100.0%
Marital status for residents in Parker Marital status - White (Caucasian) population 15 years and over
Males 27.3% Never married63.3% Now married0.9% Separated0.7% Widowed7.8% DivorcedFemales 22.8% Never married61.1% Now married0.4% Separated4.0% Widowed11.7% DivorcedWomen who gave birth in the past 12 months Now married:
87.7% (558)Unmarried:
12.3% (78)
Women who did not give birth in the past 12 months Now married:
57.3% (6,315)Unmarried:
42.7% (4,697)
Marital status - Black or African American population 15 years and over
Males 44.7% Never married46.1% Now married0.0% Separated3.9% Widowed5.3% DivorcedFemales 48.1% Never married33.2% Now married0.0% Separated4.5% Widowed14.2% DivorcedWomen who did not give birth in the past 12 months Now married:
24.2% (59)Unmarried:
75.8% (185)
Marital status - American Indian / Alaska Native population 15 years and over
Males 47.3% Never married10.8% Now married0.0% Separated0.0% Widowed41.9% DivorcedFemales 28.7% Never married43.8% Now married0.0% Separated0.0% Widowed27.5% DivorcedWomen who did not give birth in the past 12 months Now married:
34.8% (22)Unmarried:
65.2% (42)
Marital status - Asian population 15 years and over
Males 14.2% Never married79.3% Now married0.0% Separated0.0% Widowed6.5% DivorcedFemales 7.3% Never married91.3% Now married0.0% Separated0.6% Widowed0.8% DivorcedWomen who gave birth in the past 12 months Now married:
100.0% (25)Unmarried:
0.0% (0)
Women who did not give birth in the past 12 months Now married:
90.9% (903)Unmarried:
9.1% (91)
Marital status - Other race population 15 years and over
Males 37.7% Never married44.7% Now married3.2% Separated0.0% Widowed14.4% DivorcedFemales 15.7% Never married84.3% Now married0.0% Separated0.0% Widowed0.0% DivorcedWomen who did not give birth in the past 12 months Now married:
83.4% (296)Unmarried:
16.6% (59)
Marital status - Two or more races population 15 years and over
Males 49.7% Never married38.3% Now married5.0% Separated0.0% Widowed7.0% DivorcedFemales 45.6% Never married42.4% Now married2.6% Separated0.0% Widowed9.4% DivorcedWomen who did not give birth in the past 12 months Now married:
42.0% (746)Unmarried:
58.0% (1,032)
Marital status - White alone, not Hispanic / Latino population 15 years and over
Males 26.3% Never married64.3% Now married0.7% Separated0.8% Widowed7.9% DivorcedFemales 21.3% Never married62.3% Now married0.4% Separated4.2% Widowed11.8% DivorcedWomen who gave birth in the past 12 months Now married:
91.0% (558)Unmarried:
9.0% (55)
Women who did not give birth in the past 12 months Now married:
59.2% (6,370)Unmarried:
40.8% (4,391)
Marital status - Hispanic or Latino population 15 years and over
Males 39.3% Never married50.9% Now married2.6% Separated1.0% Widowed6.3% DivorcedFemales 40.2% Never married48.7% Now married0.0% Separated1.4% Widowed9.7% DivorcedWomen who gave birth in the past 12 months Now married:
60.6% (50)Unmarried:
39.4% (32)
Women who did not give birth in the past 12 months Now married:
42.5% (740)Unmarried:
57.5% (1,001)
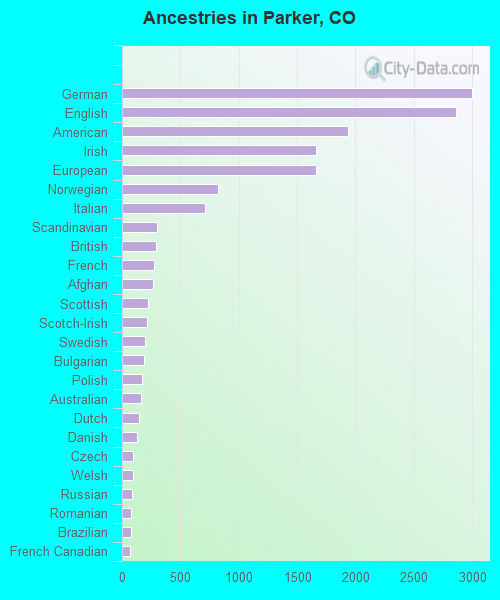
Ancestries in Parker
2,930 13.0% German2,334 10.4% European1,919 8.5% English1,503 6.7% American1,303 5.8% Irish742 3.3% Italian636 2.8% Norwegian531 2.4% British380 1.7% Polish338 1.5% Scandinavian309 1.4% Swedish304 1.4% Danish294 1.3% Scotch-Irish243 1.1% Scottish227 1.0% Dutch186 0.8% Eastern European174 0.8% Moroccan152 0.7% French111 0.5% Russian101 0.4% Czech99 0.4% African79 0.4% Northern European77 0.3% Czechoslovakian76 0.3% French Canadian64 0.3% Ethiopian51 0.2% Ukrainian51 0.2% Welsh49 0.2% Slavic46 0.2% Lithuanian40 0.2% Finnish37 0.2% Greek31 0.1% Canadian23 0.1% South African19 0.08% Lebanese18 0.08% Bulgarian18 0.08% Portuguese18 0.08% Kenyan14 0.06% Yugoslavian13 0.06% Austrian12 0.05% Australian10 0.04% Luxembourger9 0.04% Slovene9 0.04% Romanian9 0.04% Hungarian6 0.03% Swiss5 0.02% Croatian
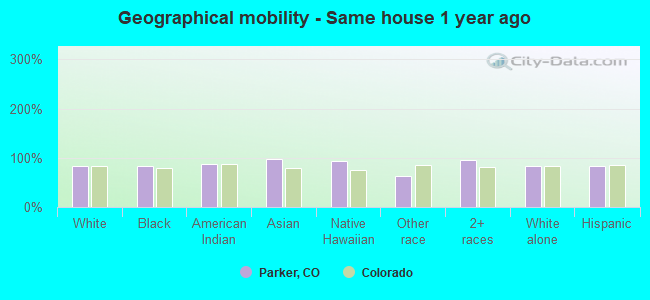
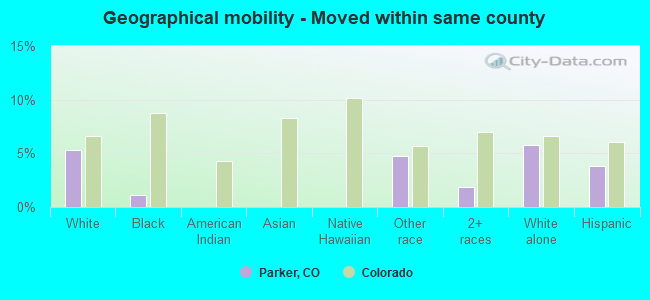
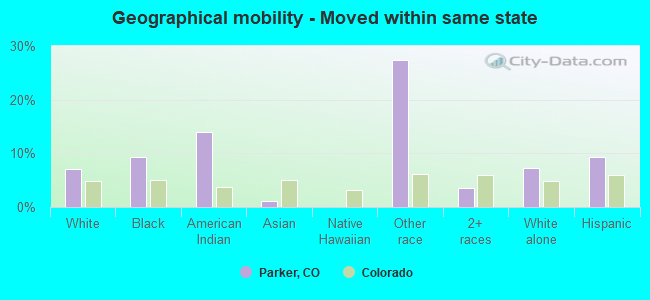
Geographical mobility in Parker Same house 1 year ago 37,381 83.0% White (Caucasian)839 83.6% Black or African American283 87.1% American Indian / Alaska Native2,885 97.7% Asian54 94.1% Native Hawaiian / Pacific Islander587 62.4% Other race5,309 95.3% Two or more races35,338 82.4% White alone, not Hispanic / Latino4,822 83.4% Hispanic or LatinoMoved within same county 2,403 5.3% White / Caucasian11 1.1% Black or African American44 4.7% Other race104 1.9% Two or more races2,480 5.8% White alone, not Hispanic / Latino222 3.8% Hispanic or LatinoMoved within same state 3,211 7.1% White / Caucasian94 9.4% Black or African American45 13.9% American Indian / Alaska Native36 1.2% Asian258 27.4% Other race195 3.5% Two or more races3,081 7.2% White alone, not Hispanic / Latino535 9.3% Hispanic or LatinoMoved from different state 2,068 4.6% White / Caucasian51 5.1% Black or African American95 3.2% Asian113 12.0% Other race123 2.2% Two or more races1,879 4.4% White alone, not Hispanic / Latino242 4.2% Hispanic or LatinoMoved from abroad 112 0.2% White15 1.5% Black or African American32 1.1% Asian28 0.5% Two or more races144 0.3% White alone, not Hispanic / Latino
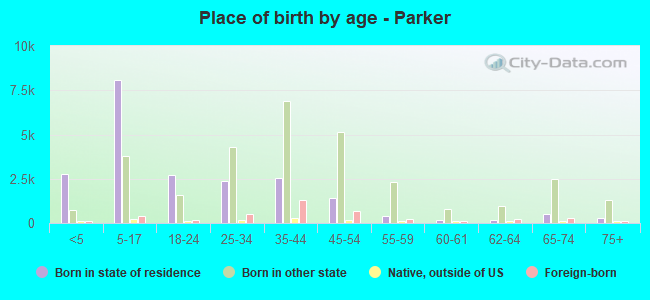
Children Nativity (place of birth) in Parker
Children under 6 years - Living with two parents Both parents native 3,518 100.0% NativeBoth parents foreign-born 150 61.0% Native96 39.0% Foreign-bornOne native, one foreign-born parent 330 100.0% NativeChildren under 6 years - Living with one parent Native parent 542 95.5% Native26 4.5% Foreign-bornChildren 6 to 17 years - Living with two parents Both parents native 7,620 99.8% Native14 0.2% Foreign-bornBoth parents foreign-born 323 61.8% Native199 38.2% Foreign-bornOne native, one foreign-born parent 876 98.9% Native10 1.1% Foreign-bornChildren 6 to 17 years - Living with one parent Native parent 1,958 100.0% NativeForeign-born parent 112 50.5% Native109 49.5% Foreign-born
Grandparents responsible for own grandchildren in Parker
Grandparents (30 to 59 years) White / Caucasian 47 21.7% Responsible for grandchildren171 78.3% Not responsible for grandchildrenWhite alone, not Hispanic / Latino 44 24.7% Responsible for grandchildren134 75.3% Not responsible for grandchildrenHispanic or Latino 78 100.0% Not responsible for grandchildrenGrandparents (60 years and over) White / Caucasian 135 25.3% Responsible for grandchildren398 74.7% Not responsible for grandchildrenWhite alone, not Hispanic / Latino 69 13.5% Responsible for grandchildren443 86.5% Not responsible for grandchildrenHispanic or Latino 84 72.2% Responsible for grandchildren32 27.8% Not responsible for grandchildren