Races in Parkville, Missouri (MO) Detailed Stats
Ancestries, Foreign-born residents, place of birth
Settings
X


Recent posts about races in Parkville, Missouri on our local forum with over 2,400,000 registered users:
 | Parkville house to flip? (1 reply) |
| It's between KC and Cincinnati. Convince me! (87 replies) |
| The Kansas City Star apologizes to Black KC for just about its entire history (19 replies) |
| Parkville Area (5 replies) |
| Moving to KC in the summer - need some advice. (3 replies) |
| Interesting Missouri facts. (1186 replies) |
Latest news about races in Parkville, MO collected exclusively by city-data.com from local newspapers, TV, and radio stations
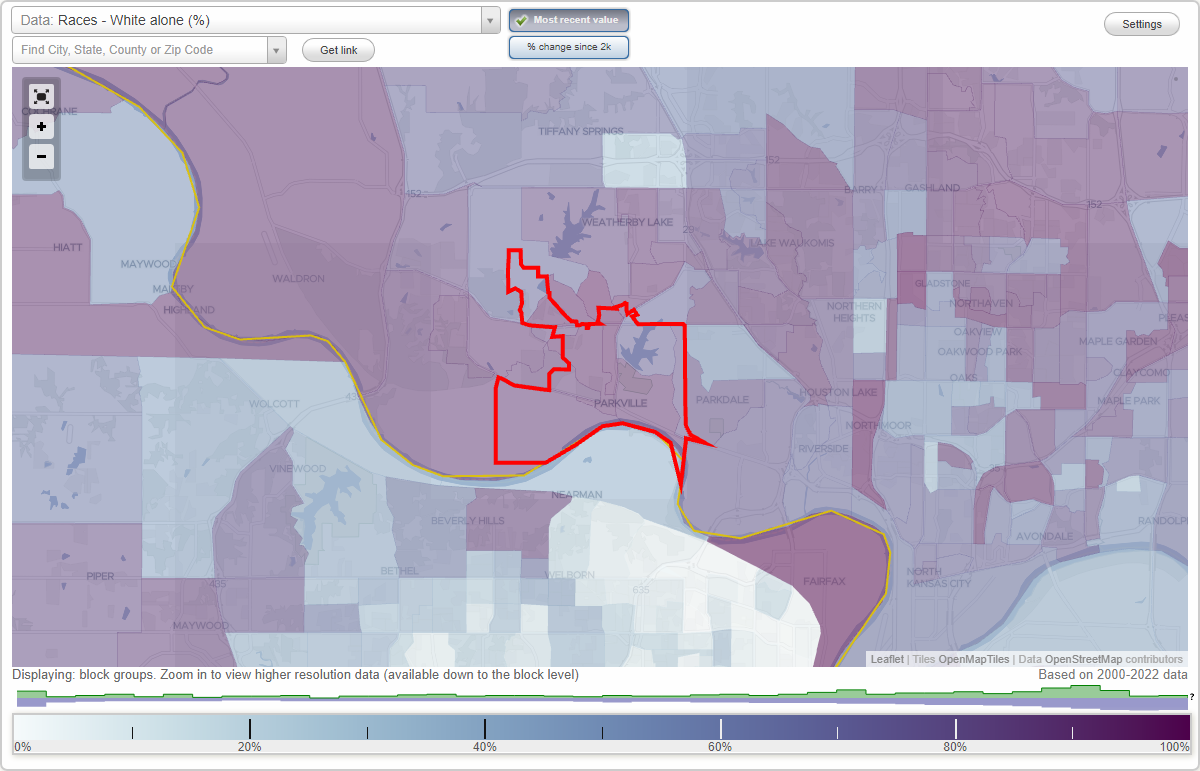
According to 2022 data, the most numerous races in Parkville, MO are White alone (6,314 residents), Black alone (262 residents), and Two or more races (305 residents). 93.0% of Parkville residents speak English at home. 2.2% of Parkville, MO residents are foreign-born (1.0% born in Asia, 0.6% born in Latin America, 0.3% born in North America), which is 80.0% less than the foreign-born rate of 4.0% across the entire state of Missouri.
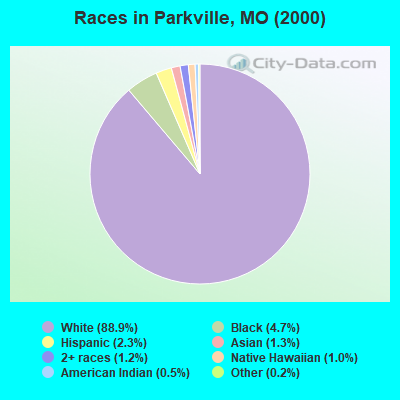
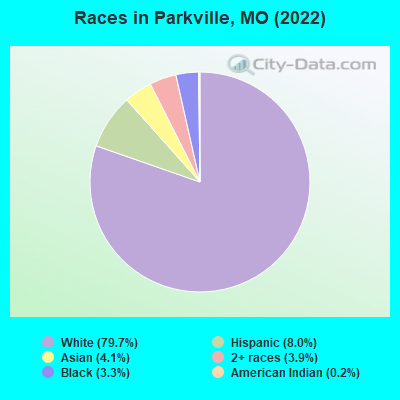
Race distribution in Parkville
2000
2022

- 3,61088.9%White alone
- 1914.7%Black alone
- 922.3%Hispanic
- 521.3%Asian alone
- 481.2%Two or more races
- 391.0%Native Hawaiian and Other
Pacific Islander alone - 200.5%American Indian alone
- 70.2%Other race alone
-
- 6,31479.7%White alone
- 6368.0%Hispanic
- 3274.1%Asian alone
- 3053.9%Two or more races
- 2623.3%Black alone
- 150.2%American Indian alone
- 60.08%Other race alone
2000
2022
-
- 4,686,47483.8%White alone
- 625,66711.2%Black alone
- 118,5922.1%Hispanic
- 71,9051.3%Two or more races
- 61,0411.1%Asian alone
- 23,3020.4%American Indian alone
- 5,2910.09%Other race alone
- 2,9390.05%Native Hawaiian and Other
Pacific Islander alone

-
- 4,733,41176.6%White alone
- 656,73910.6%Black alone
- 316,3005.1%Two or more races
- 291,7634.7%Hispanic
- 132,4362.1%Asian alone
- 27,4670.4%Other race alone
- 12,3130.2%American Indian alone
- 7,5280.1%Native Hawaiian and Other
Pacific Islander alone

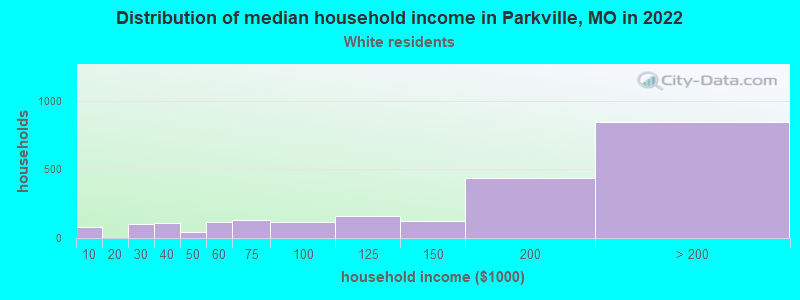
Income and house value in Parkville
- Median household income in 2022
- $163,395White non-Hispanic householders
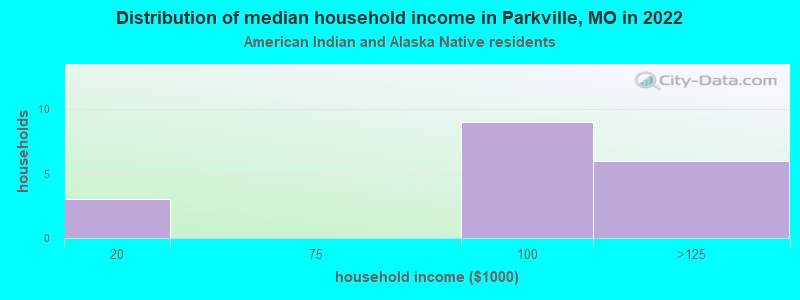
- $123,898American Indian and Alaska Native householders
- over $200,000Some other race householders
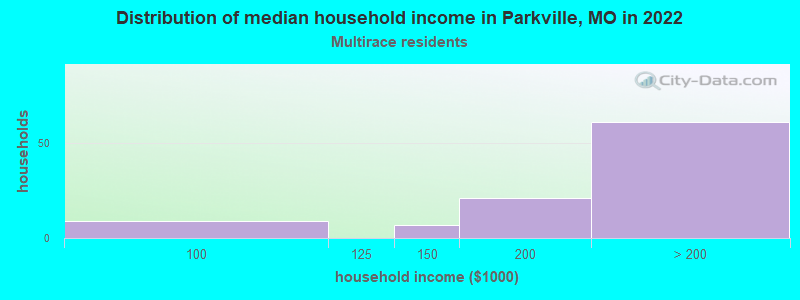
- over $200,000Two or more races householders
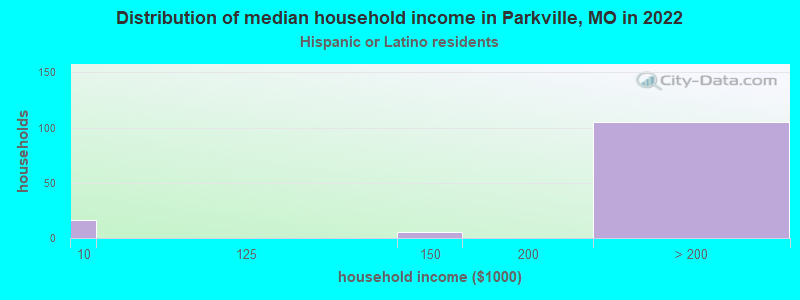
- $153,084Hispanic or Latino race householders
- Median 2022 house value
- $671,187White Non-Hispanic householders
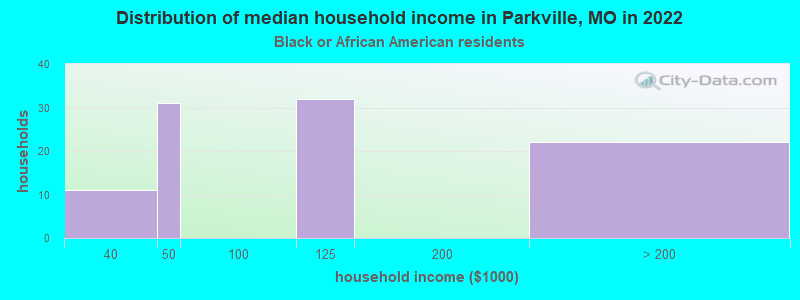
- $248,587Black or African American householders
- $582,627American Indian or Alaska Native householders
- $295,198Two or more races householders
Household income for White non-Hispanic householders
Household income for Black householders
Household income for American Indian and Alaska Native householders
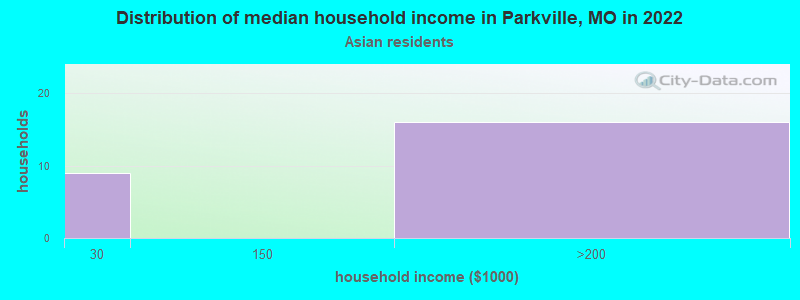
Household income for Asian householders
Household income for Two or more races householders
Household income for Hispanic or Latino race householders
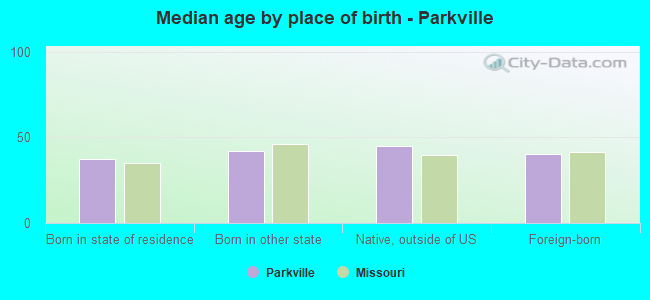
Median age by race in Parkville
- 41.8Median age for White residents
- 39.6Males
- 45.0Females
- 36.8Median age for Black or African American residents
- 21.9Males
- 42.7Females
- 45.9Median age for American Indian / Alaska Native residents
- 49.4Males
- -576,856,648.8Females
- 20.6Median age for Asian residents
- 24.3Males
- 19.1Females
- -693,430,656.2Median age for Native Hawaiian / Pacific Islander residents
- -683,513,838.1Males
- -752,136,751.4Females
- 9.5Median age for Other race residents
- 10.1Males
- 9.5Females
- 14.6Median age for Two or more races residents
- 14.5Males
- 31.9Females
- 41.9Median age for White alone residents
- 39.4Males
- 45.1Females
- 11.7Median age for Hispanic or Latino residents
- 18.4Males
- 8.0Females
Owner/renter occupied households by race in Parkville
- House owners and renters - White residents
- 1,80278.3%Owner occupied
- 50121.7%Renter occupied
- House owners and renters - Black or African American residents
- 112100.0%Owner occupied
- House owners and renters - American Indian / Alaska Native residents
- 1383.3%Owner occupied
- 316.7%Renter occupied
- House owners and renters - Asian residents
- 15100.0%Owner occupied
- House owners and renters - Other race residents
- 117100.0%Owner occupied
- House owners and renters - Two or more races residents
- 106100.0%Owner occupied
- House owners and renters - White alone residents
- 1,79477.4%Owner occupied
- 52522.6%Renter occupied
- House owners and renters - Hispanic or Latino residents
- 129100.0%Owner occupied
Language usage in Parkville
- English speakers - Total
- 93.0% of residents of Parkville speak English at home.
- 5.2% of residents speak Spanish at home
- 37497.1%Speak English very well
- 112.9%Speak English less than very well
- 2.8% of residents speak other language at home
- 210100.0%Speak English very well
- English speakers - Born in the United States
- 93.7% of residents of Parkville speak English at home.
- 7.0% of residents speak Spanish at home
- 276100.0%Speak English very well
- English speakers - Native, born elsewhere
- 74.7% of residents of Parkville speak English at home.
- 20.7% of residents speak Spanish at home
- 18100.0%Speak English very well
- English speakers - Foreign-born
- 34.4% of residents of Parkville speak English at home.
- 9.4% of residents speak Spanish at home
- 17100.0%Speak English very well
- 77.8% of residents speak other language at home
- 140100.0%Speak English very well
White (Caucasian) - Speak only English
| Native: | 96.4% (5,831) |
| Foreign-born: | 100.0% (30) |
White (Caucasian) - Speak another language
| Native: | 4.5% (270) |
| Foreign-born: | 7.8% (2) |
American Indian / Alaska Native - Speak only English
| Native: | 91.2% (11) |
| Foreign-born: | 100.0% (2) |
Asian - Speak another language
| Native: | 26.4% (39) |
| Foreign-born: | 100.0% (75) |
Other race - Speak another language
| Native: | 61.2% (203) |
| Foreign-born: | 100.0% (15) |
Two or more races - Speak only English
| Native: | 96.7% (499) |
| Foreign-born: | 63.4% (4) |
White alone - Speak only English
| Native: | 96.3% (5,824) |
| Foreign-born: | 100.0% (46) |
Hispanic or Latino - Speak only English
| Native: | 71.2% (356) |
| Foreign-born: | 31.8% (4) |
Hispanic or Latino - Speak another language
| Native: | 29.9% (149) |
| Foreign-born: | 84.9% (11) |
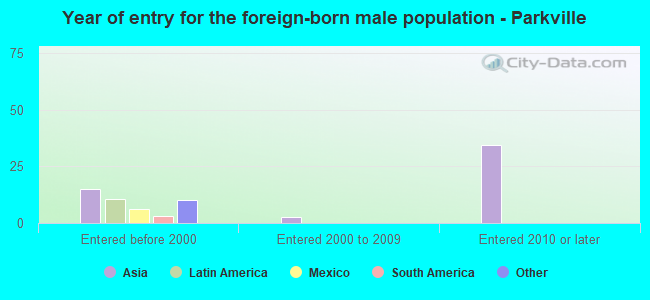
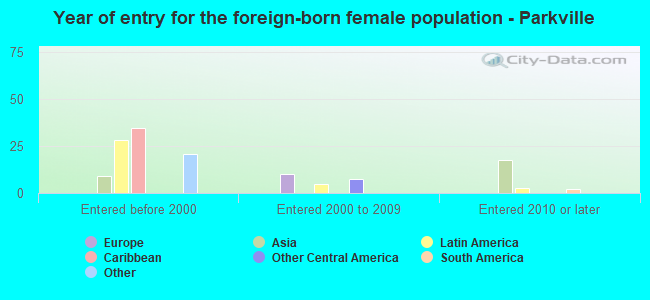
Foreign-born residents in Parkville
176 residents are foreign born (1.0% Asia, 0.6% Latin America, 0.3% North America).
| This city: | 2.2% |
| Missouri: | 4.2% |
Marital status for residents in Parkville
Marital status - White (Caucasian) population 15 years and over
- Males
- 32.1%Never married
- 59.1%Now married
- 1.8%Separated
- 1.2%Widowed
- 5.7%Divorced
- Females
- 15.7%Never married
- 75.8%Now married
- 0.0%Separated
- 3.0%Widowed
- 5.5%Divorced
Women who gave birth in the past 12 months
| Now married: | 100.0% (67) |
| Unmarried: | 0.0% (0) |
Women who did not give birth in the past 12 months
| Now married: | 70.7% (802) |
| Unmarried: | 29.3% (333) |
Marital status - Black or African American population 15 years and over
- Males
- 80.0%Never married
- 0.0%Now married
- 0.0%Separated
- 0.0%Widowed
- 20.0%Divorced
- Females
- 31.2%Never married
- 15.3%Now married
- 0.0%Separated
- 0.0%Widowed
- 53.5%Divorced
Women who did not give birth in the past 12 months
| Now married: | 13.7% (15) |
| Unmarried: | 86.3% (95) |
Marital status - Asian population 15 years and over
- Males
- 68.9%Never married
- 31.1%Now married
- 0.0%Separated
- 0.0%Widowed
- 0.0%Divorced
- Females
- 54.1%Never married
- 36.3%Now married
- 0.0%Separated
- 9.6%Widowed
- 0.0%Divorced
Women who did not give birth in the past 12 months
| Now married: | 0.0% (0) |
| Unmarried: | 100.0% (79) |
Marital status - Other race population 15 years and over
- Males
- 0.0%Never married
- 100.0%Now married
- 0.0%Separated
- 0.0%Widowed
- 0.0%Divorced
- Females
- 20.7%Never married
- 79.3%Now married
- 0.0%Separated
- 0.0%Widowed
- 0.0%Divorced
Women who gave birth in the past 12 months
| Now married: | 100.0% (28) |
| Unmarried: | 0.0% (0) |
Women who did not give birth in the past 12 months
| Now married: | 0.0% (0) |
| Unmarried: | 100.0% (7) |
Marital status - Two or more races population 15 years and over
- Males
- 6.6%Never married
- 93.4%Now married
- 0.0%Separated
- 0.0%Widowed
- 0.0%Divorced
- Females
- 15.3%Never married
- 84.7%Now married
- 0.0%Separated
- 0.0%Widowed
- 0.0%Divorced
Women who did not give birth in the past 12 months
| Now married: | 73.8% (66) |
| Unmarried: | 26.2% (23) |
Marital status - White alone, not Hispanic / Latino population 15 years and over
- Males
- 31.7%Never married
- 59.9%Now married
- 1.4%Separated
- 1.3%Widowed
- 5.8%Divorced
- Females
- 15.4%Never married
- 76.1%Now married
- 0.0%Separated
- 3.0%Widowed
- 5.5%Divorced
Women who gave birth in the past 12 months
| Now married: | 100.0% (69) |
| Unmarried: | 0.0% (0) |
Women who did not give birth in the past 12 months
| Now married: | 71.2% (825) |
| Unmarried: | 28.8% (334) |
Marital status - Hispanic or Latino population 15 years and over
- Males
- 15.7%Never married
- 77.6%Now married
- 6.7%Separated
- 0.0%Widowed
- 0.0%Divorced
- Females
- 16.2%Never married
- 83.8%Now married
- 0.0%Separated
- 0.0%Widowed
- 0.0%Divorced
Women who gave birth in the past 12 months
| Now married: | 100.0% (25) |
| Unmarried: | 0.0% (0) |
Women who did not give birth in the past 12 months
| Now married: | 75.6% (37) |
| Unmarried: | 24.4% (12) |
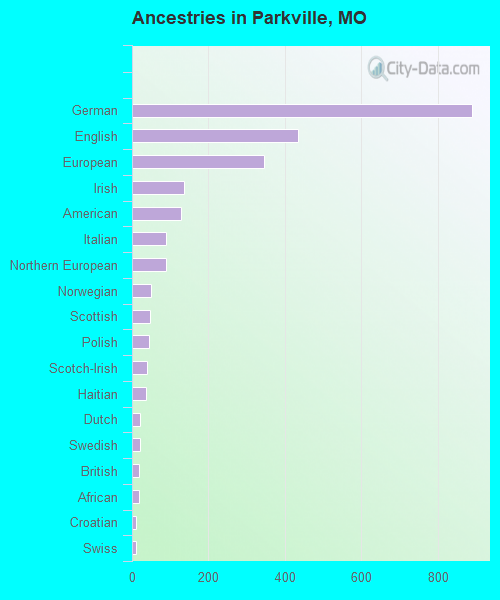
Ancestries in Parkville

- 89026.0%German
- 43512.7%English
- 34610.1%European
- 1353.9%Irish
- 1283.7%American
- 902.6%Italian
- 882.6%Northern European
- 501.5%Norwegian
- 461.3%Scottish
- 451.3%Polish
- 381.1%Scotch-Irish
- 361.1%Haitian
- 200.6%Dutch
- 200.6%Swedish
- 180.5%British
- 180.5%African
- 110.3%Croatian
- 110.3%Swiss
- 60.2%Russian
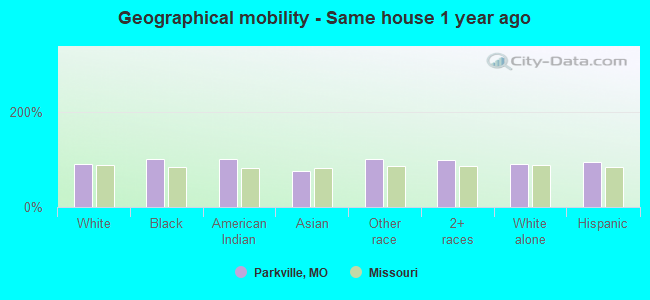
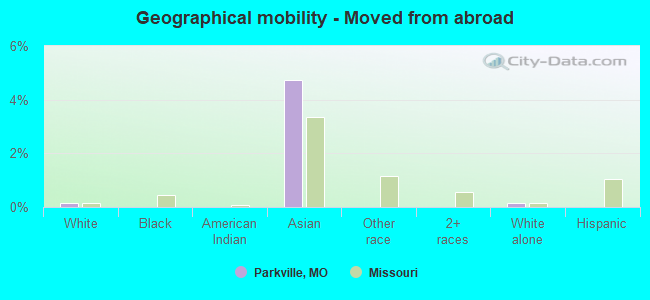
Geographical mobility in Parkville

- Same house 1 year ago
- 5,60389.9%White (Caucasian)
- 267100.0%Black or African American
- 15100.0%American Indian / Alaska Native
- 23776.1%Asian
- 365100.0%Other race
- 59697.9%Two or more races
- 5,65090.0%White alone, not Hispanic / Latino
- 52394.0%Hispanic or Latino
-
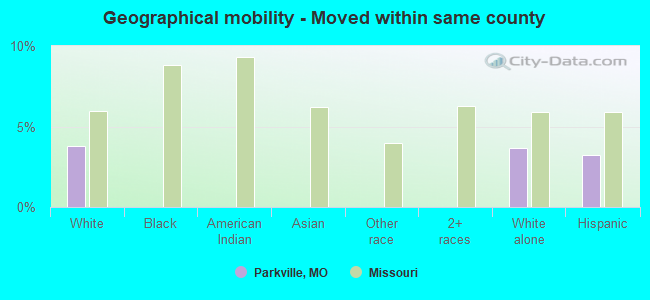
- Moved within same county
- 2373.8%White / Caucasian
- 2303.7%White alone, not Hispanic / Latino
- 183.2%Hispanic or Latino
-
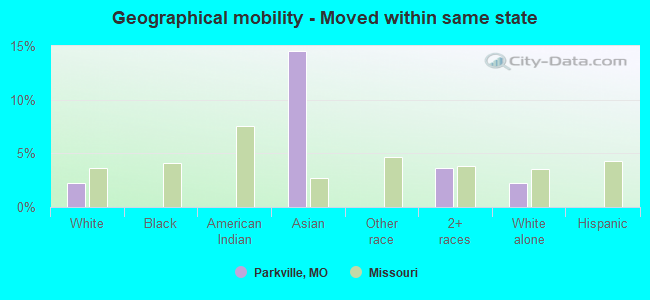
- Moved within same state
- 1402.2%White / Caucasian
- 4514.6%Asian
- 223.7%Two or more races
- 1412.2%White alone, not Hispanic / Latino
-
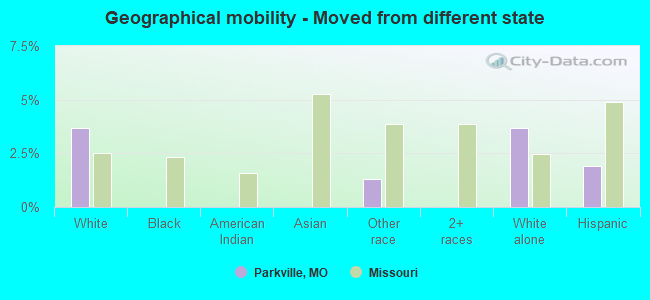
- Moved from different state
- 2293.7%White / Caucasian
- 51.3%Other race
- 2313.7%White alone, not Hispanic / Latino
- 111.9%Hispanic or Latino
-
- Moved from abroad
- 100.2%White
- 154.7%Asian
- 110.2%White alone, not Hispanic / Latino
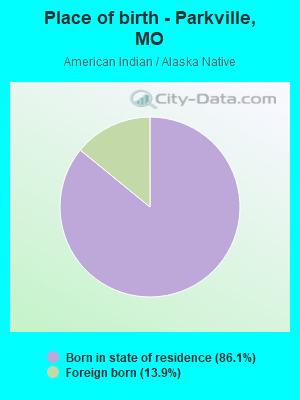
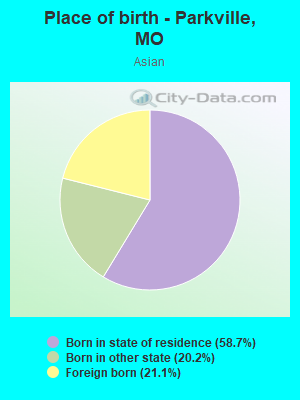
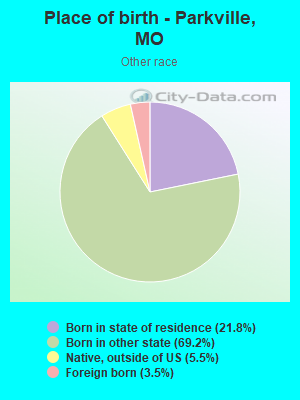
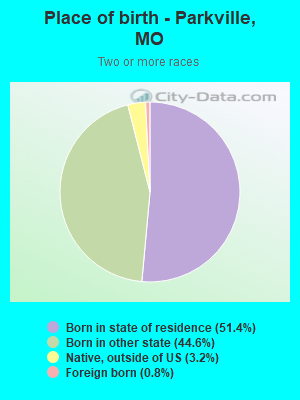
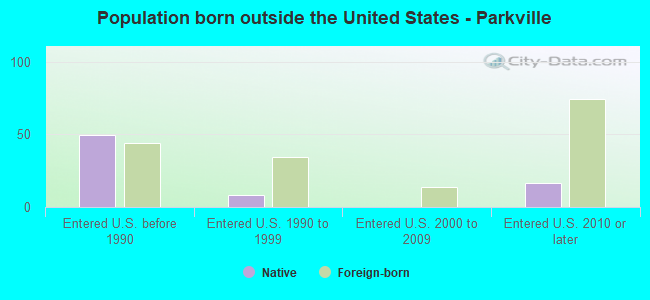
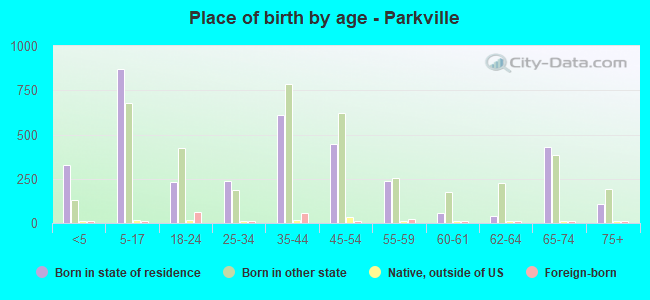
Children Nativity (place of birth) in Parkville
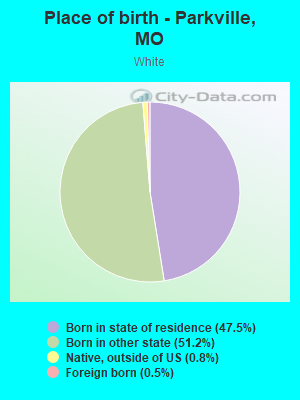
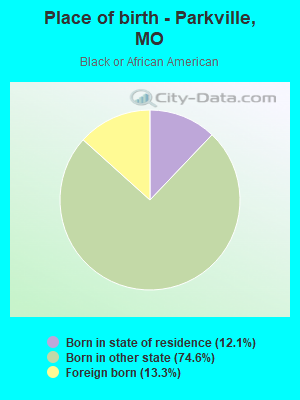
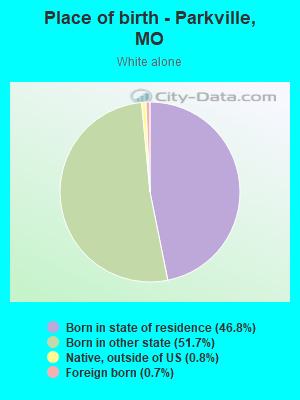
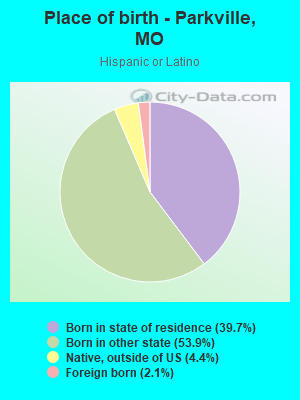
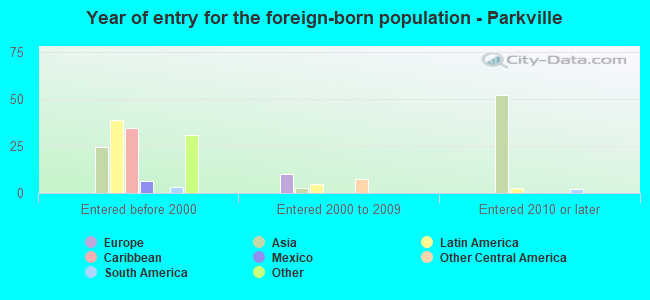
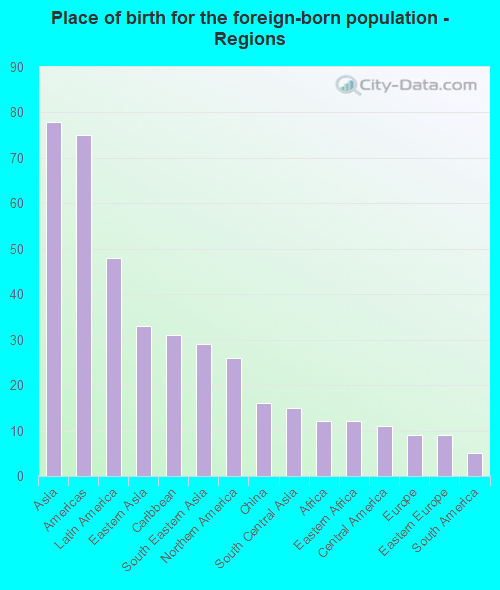
Place of birth for residents in Parkville
![Place of birth for the foreign-born population - Regions]()
- 78Asia
- 75Americas
- 48Latin America
- 33Eastern Asia
- 31Caribbean
- 29South Eastern Asia
- 26Northern America
- 16China
- 15South Central Asia
- 12Africa
- 12Eastern Africa
- 11Central America
- 9Europe
- 9Eastern Europe
- 5South America
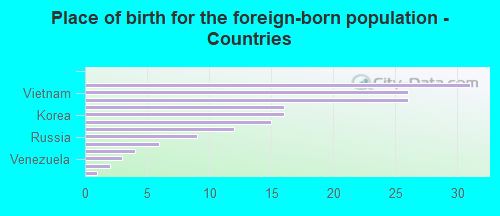
![Place of birth for the foreign-born population - Countries]()
- 31Haiti
- 26Vietnam
- 26Canada
- 16China
- 16Korea
- 15India
- 12Zimbabwe
- 9Russia
- 6Mexico
- 4El Salvador
- 3Venezuela
- 2Thailand
- 1Ecuador
Grandparents responsible for own grandchildren in Parkville
Zip codes: 64092.