Parkville, Missouri
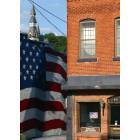
Parkville: United States Flag Mural, Downtown Parkville, MO
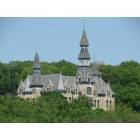
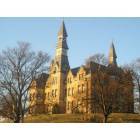
Parkville: College

Parkville: Park College, Parkville, MO
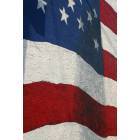
Parkville: United States Flag Mural, Downtown Parkville, MO
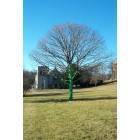
Parkville: Painted Tree Park University Parkville MO
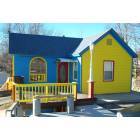
Parkville: Colorfull House Parkville MO
Parkville: Park University
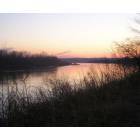
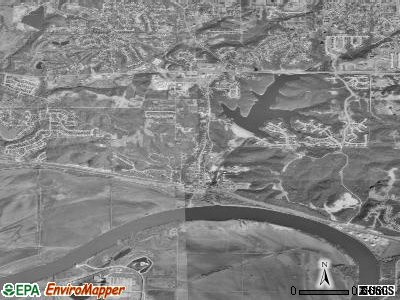
Parkville: Missouri River Bend next to Downtown
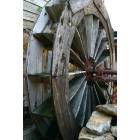
Parkville: Historic Water Wheel, Parkville, MO
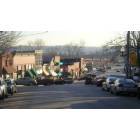
Parkville: View heading South into Downtown
- add
your
Submit your own pictures of this city and show them to the world
- OSM Map
- General Map
- Google Map
- MSN Map
Population change since 2000: +110.4%
| Males: 4,693 | |
| Females: 3,848 |
| Median resident age: | 40.7 years |
| Missouri median age: | 39.1 years |
Zip codes: 64092.
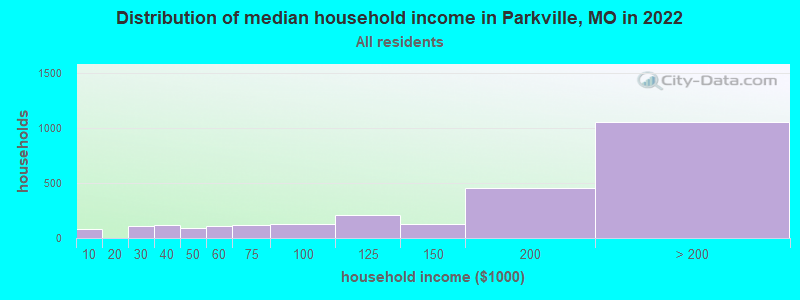
| Parkville: | $166,280 |
| MO: | $64,811 |
Estimated per capita income in 2022: $73,067 (it was $33,119 in 2000)
Parkville city income, earnings, and wages data
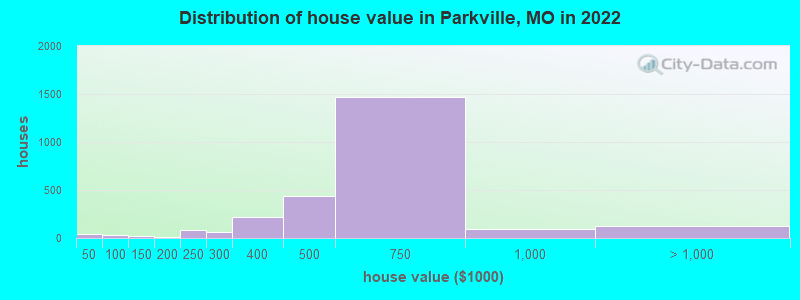
Estimated median house or condo value in 2022: $630,481 (it was $202,900 in 2000)
| Parkville: | $630,481 |
| MO: | $221,200 |
Mean prices in 2022: all housing units: $590,174; detached houses: $581,849
Median gross rent in 2022: $876.
(1.6% for White Non-Hispanic residents, 0.5% for Black residents, 2.4% for Hispanic or Latino residents)
Detailed information about poverty and poor residents in Parkville, MO


Compare current foreclosures near Parkville, MO:
| Photo | Address | Area | Beds / Baths | Price | Details |
|---|---|---|---|---|---|

|
#1
Admiral Blvd Apt 1006
Kansas City, MO 64106
|
752 sq. feet
|
1 baths 1 beds |
$187,000
|
show details |

|
#2
Rockhill Rd
Kansas City, MO 64110
|
1,752 sq. feet
|
2 baths 4 beds |
$334,900
|
show details |

|
#3
Indiana Ave
Kansas City, MO 64130
|
916 sq. feet
|
1 baths 2 beds |
$125,000
|
show details |

|
#4
Wabash Ave
Kansas City, MO 64130
|
836 sq. feet
|
1 baths 2 beds |
$52,000
|
show details |

|
#5
E 68th Ter
Kansas City, MO 64132
|
720 sq. feet
|
1 baths 2 beds |
$64,050
|
show details |

|
#6
N 46th St
Kansas City, KS 66102
|
980 sq. feet
|
1 baths 2 beds |
$78,500
|
show details |

|
#7
E 41st St
Kansas City, MO 64111
|
801 sq. feet
|
1 baths 1 beds |
$135,000
|
show details |

|
#8
Walker Ave
Kansas City, KS 66104
|
1,540 sq. feet
|
2 baths 3 beds |
$116,900
|
show details |

|
#9
Lyons Ave
Kansas City, KS 66101
|
586 sq. feet
|
1 baths 2 beds |
$15,900
|
show details |

|
#10
E 40th St
Kansas City, MO 64130
|
- sq. feet
|
1 baths 3 beds |
$19,900
|
show details |
| Photo | Address | Area | Beds / Baths | Price | Details |
|---|---|---|---|---|---|

|
#11
Bur Oak Dr
Liberty, MO 64068
|
3,780 sq. feet
|
3 baths 6 beds |
show details | |

|
#12
S 23rd St
Kansas City, KS 66102
|
1,494 sq. feet
|
2 baths 3 beds |
show details | |

|
#13
N 45th St
Kansas City, KS 66104
|
1,120 sq. feet
|
1 baths 3 beds |
show details | |

|
#14
El Monte St
Mission, KS 66205
|
976 sq. feet
|
1 baths 2 beds |
show details | |

|
#15
N Lydia Ave
Kansas City, MO 64155
|
1,598 sq. feet
|
2 baths 3 beds |
show details | |

|
#16
E 58th Ter
Kansas City, MO 64129
|
1,224 sq. feet
|
2 baths 3 beds |
show details | |

|
#17
E 31st St S
Independence, MO 64052
|
740 sq. feet
|
1 baths 2 beds |
show details | |

|
#18
Sortor Dr
Kansas City, KS 66104
|
1,768 sq. feet
|
1 baths 3 beds |
show details | |

|
#19
Hardy Ave
Kansas City, MO 64133
|
- sq. feet
|
2 baths 3 beds |
show details | |

|
#20
Georgia Ave
Kansas City, KS 66104
|
- sq. feet
|
1 baths 2 beds |
show details |
| Photo | Address | Area | Beds / Baths | Price | Details |
|---|---|---|---|---|---|

|
#21
Metcalf Ct # 41
Mission, KS 66202
|
1,260 sq. feet
|
2 baths 2 beds |
show details | |

|
#22
Blue Ridge Blvd
Independence, MO 64052
|
1,693 sq. feet
|
3 baths 3 beds |
show details | |

|
#23
NW Valley Ln
Riverside, MO 64150
|
1,541 sq. feet
|
1 baths 2 beds |
show details | |

|
#24
Haskell Ave
Kansas City, KS 66109
|
1,230 sq. feet
|
1 baths 2 beds |
show details | |

|
#25
N 10th St
Kansas City, KS 66104
|
2,102 sq. feet
|
3 baths 5 beds |
show details | |

|
#26
NE 114th St
Kansas City, MO 64155
|
1,214 sq. feet
|
2 baths 3 beds |
show details | |

|
#27
Hemlock St
Overland Park, KS 66204
|
1,816 sq. feet
|
2 baths 3 beds |
show details | |

|
#28
W 40th St
Kansas City, MO 64111
|
2,110 sq. feet
|
1 baths 4 beds |
show details | |

|
#29
Central St
Kansas City, MO 64114
|
1,200 sq. feet
|
1 baths 2 beds |
show details | |

|
#30
S Benton Ave
Kansas City, MO 64130
|
1,804 sq. feet
|
2 baths 3 beds |
show details |
| Photo | Address | Area | Beds / Baths | Price | Details |
|---|---|---|---|---|---|

|
#31
N 73rd St
Kansas City, KS 66109
|
1,314 sq. feet
|
1 baths 3 beds |
show details | |

|
#32
Haskell Ave
Kansas City, KS 66109
|
1,386 sq. feet
|
2 baths 3 beds |
show details | |

|
#33
Flora Ave
Kansas City, MO 64131
|
1,255 sq. feet
|
1 baths 3 beds |
show details | |

|
#34
Farley Ave
Kansas City, MO 64133
|
1,323 sq. feet
|
1 baths 3 beds |
show details | |

|
#35
Pottawatomie St
Leavenworth, KS 66048
|
2,651 sq. feet
|
2 baths 5 beds |
show details | |

|
#36
Quincy Ave
Kansas City, MO 64130
|
802 sq. feet
|
1 baths 1 beds |
show details | |

|
#37
S Leonard St
Liberty, MO 64068
|
1,267 sq. feet
|
2 baths 3 beds |
show details | |

|
#38
N Drury Ave
Kansas City, MO 64117
|
928 sq. feet
|
1 baths 3 beds |
show details | |

|
#39
NE 60th St
Kansas City, MO 64119
|
1,040 sq. feet
|
1 baths 3 beds |
show details | |

|
#40
NE Barnes Ave
Kansas City, MO 64119
|
976 sq. feet
|
2 baths 3 beds |
show details |
| Photo | Address | Area | Beds / Baths | Price | Details |
|---|---|---|---|---|---|

|
#41
N Campbell St
Kansas City, MO 64155
|
1,120 sq. feet
|
2 baths 3 beds |
show details | |

|
#42
Berry Rd
Kansas City, KS 66106
|
1,090 sq. feet
|
1 baths 2 beds |
show details | |

|
#43
N Mccoy St
Independence, MO 64050
|
1,059 sq. feet
|
1 baths 3 beds |
show details | |

|
#44
Monrovia St
Shawnee, KS 66216
|
1,802 sq. feet
|
2 baths 3 beds |
show details | |

|
#45
W 84th St
Overland Park, KS 66212
|
1,368 sq. feet
|
2 baths 3 beds |
show details | |

|
#46
N Lawn Ave
Kansas City, MO 64119
|
630 sq. feet
|
2 baths 2 beds |
show details | |

|
#47
N Chippewa Dr
Kansas City, MO 64116
|
912 sq. feet
|
2 baths 4 beds |
show details | |

|
#48
NE 95th Ter
Kansas City, MO 64156
|
1,250 sq. feet
|
3 baths 4 beds |
show details | |

|
#49
Rosewood Dr
Prairie Village, KS 66208
|
1,414 sq. feet
|
1 baths 3 beds |
show details | |

|
Check over 1 million property listings on Foreclosure.com!
|
browse all offers | |||


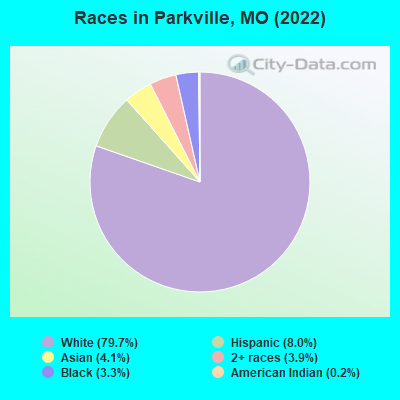
- 6,31479.7%White alone
- 6368.0%Hispanic
- 3274.1%Asian alone
- 3053.9%Two or more races
- 2623.3%Black alone
- 150.2%American Indian alone
- 60.08%Other race alone
Races in Parkville detailed stats: ancestries, foreign born residents, place of birth
According to our research of Missouri and other state lists, there were 7 registered sex offenders living in Parkville, Missouri as of May 08, 2024.
The ratio of all residents to sex offenders in Parkville is 880 to 1.
The ratio of registered sex offenders to all residents in this city is much lower than the state average.
Type |
2009 |
2010 |
2011 |
2012 |
2013 |
2014 |
2015 |
2016 |
2017 |
2018 |
2019 |
2020 |
2021 |
2022 |
|---|---|---|---|---|---|---|---|---|---|---|---|---|---|---|
| Murders (per 100,000) | 0 (0.0) | 1 (18.0) | 0 (0.0) | 0 (0.0) | 0 (0.0) | 0 (0.0) | 0 (0.0) | 0 (0.0) | 0 (0.0) | 0 (0.0) | 1 (14.0) | 0 (0.0) | 2 (23.0) | 0 (0.0) |
| Rapes (per 100,000) | 0 (0.0) | 0 (0.0) | 0 (0.0) | 0 (0.0) | 4 (68.5) | 2 (33.2) | 1 (16.0) | 1 (15.5) | 1 (15.0) | 4 (57.4) | 0 (0.0) | 1 (13.6) | 2 (23.0) | 1 (11.9) |
| Robberies (per 100,000) | 0 (0.0) | 5 (90.0) | 0 (0.0) | 2 (35.3) | 1 (17.1) | 0 (0.0) | 2 (32.1) | 0 (0.0) | 0 (0.0) | 2 (28.7) | 1 (14.0) | 1 (13.6) | 2 (23.0) | 3 (35.7) |
| Assaults (per 100,000) | 5 (92.3) | 4 (72.0) | 7 (125.6) | 3 (53.0) | 6 (102.7) | 1 (16.6) | 2 (32.1) | 1 (15.5) | 11 (164.5) | 7 (100.5) | 4 (56.0) | 11 (149.3) | 4 (46.1) | 4 (47.6) |
| Burglaries (per 100,000) | 13 (240.0) | 18 (324.1) | 18 (322.9) | 17 (300.5) | 9 (154.0) | 8 (132.9) | 10 (160.4) | 16 (248.1) | 12 (179.5) | 21 (301.6) | 12 (168.0) | 13 (176.4) | 18 (207.4) | 9 (107.0) |
| Thefts (per 100,000) | 164 (3,028) | 137 (2,467) | 106 (1,902) | 104 (1,838) | 86 (1,472) | 104 (1,728) | 90 (1,444) | 75 (1,163) | 96 (1,436) | 94 (1,350) | 110 (1,540) | 116 (1,574) | 59 (679.7) | 93 (1,106) |
| Auto thefts (per 100,000) | 5 (92.3) | 4 (72.0) | 6 (107.6) | 1 (17.7) | 6 (102.7) | 0 (0.0) | 5 (80.2) | 6 (93.0) | 8 (119.7) | 9 (129.3) | 11 (154.0) | 14 (190.0) | 15 (172.8) | 21 (249.6) |
| Arson (per 100,000) | 0 (0.0) | 0 (0.0) | 0 (0.0) | 0 (0.0) | 1 (17.1) | 0 (0.0) | 0 (0.0) | 0 (0.0) | 0 (0.0) | 0 (0.0) | 0 (0.0) | 0 (0.0) | 0 (0.0) | 1 (11.9) |
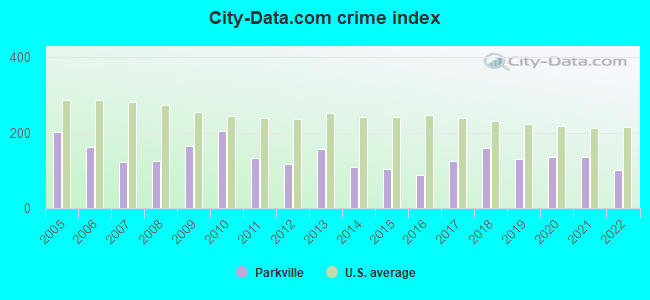
| City-Data.com crime index | 163.7 | 204.5 | 132.4 | 117.2 | 158.3 | 108.3 | 104.3 | 86.8 | 124.5 | 160.1 | 129.1 | 135.3 | 136.2 | 101.4 |
The City-Data.com crime index weighs serious crimes and violent crimes more heavily. Higher means more crime, U.S. average is 246.1. It adjusts for the number of visitors and daily workers commuting into cities.
Crime rate in Parkville detailed stats: murders, rapes, robberies, assaults, burglaries, thefts, arson
Full-time law enforcement employees in 2021, including police officers: 16 (15 officers - 14 male; 1 female).
| Officers per 1,000 residents here: | 1.73 |
| Missouri average: | 2.54 |
 Recent articles from our blog. Our writers, many of them Ph.D. graduates or candidates, create easy-to-read articles on a wide variety of topics.

 | Parkville- New Construction (2 replies) |
| Relocating from TX to Parkville MO - Earnings Tax or No?? (3 replies) |
| KC Metro suburb (3 replies) |
| Parkville Area (5 replies) |
| Parkville area help (4 replies) |
| Family moving to KC from CA. Lee's Summit vs Johnson County? (60 replies) |
Latest news from Parkville, MO collected exclusively by city-data.com from local newspapers, TV, and radio stations
Ancestries: German (26.0%), English (10.2%), European (8.3%), Irish (3.9%), American (3.6%), Northern European (2.9%).
Current Local Time: CST time zone
Incorporated in 1858
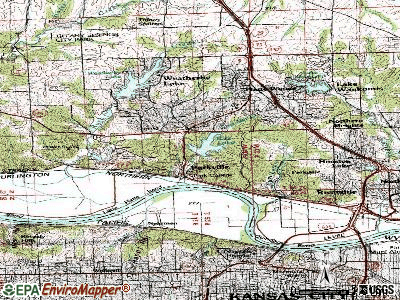
Elevation: 830 feet
Land area: 6.92 square miles.
Population density: 1,235 people per square mile (low).
176 residents are foreign born (1.0% Asia, 0.6% Latin America, 0.3% North America).
| This city: | 2.2% |
| Missouri: | 4.2% |
Median real estate property taxes paid for housing units with mortgages in 2022: $7,279 (1.1%)
Median real estate property taxes paid for housing units with no mortgage in 2022: $7,344 (1.3%)
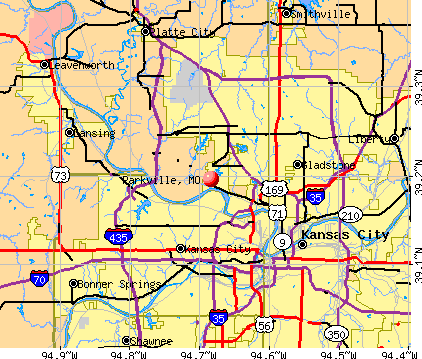
Nearest city with pop. 50,000+: Kansas City, KS  (6.2 miles , pop. 146,866).
Nearest city with pop. 200,000+: Kansas City, MO (10.7 miles , pop. 441,545).
Nearest city with pop. 1,000,000+: Chicago, IL (411.1 miles , pop. 2,896,016).
Nearest cities:
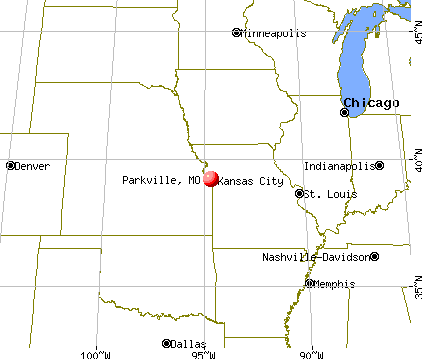
), ), ), ), ), Latitude: 39.20 N, Longitude: 94.68 W
Daytime population change due to commuting: +177 (+2.2%)
Workers who live and work in this city: 970 (24.6%)
Parkville, Missouri accommodation & food services, waste management - Economy and Business Data
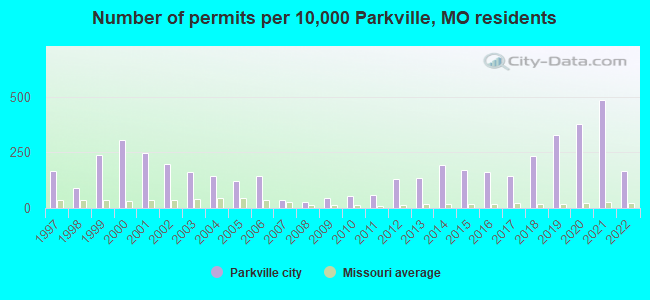
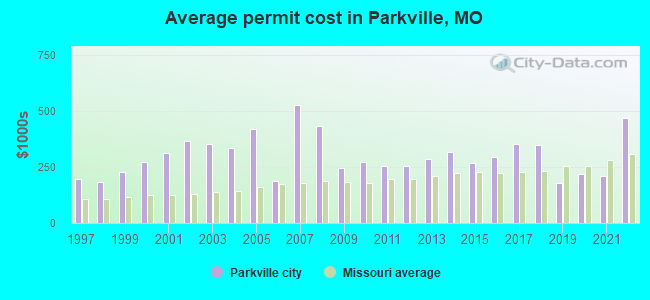
Single-family new house construction building permits:
- 2022: 67 buildings, average cost: $468,500
- 2021: 197 buildings, average cost: $210,700
- 2020: 153 buildings, average cost: $217,700
- 2019: 133 buildings, average cost: $179,900
- 2018: 94 buildings, average cost: $348,000
- 2017: 58 buildings, average cost: $353,800
- 2016: 66 buildings, average cost: $293,300
- 2015: 70 buildings, average cost: $269,400
- 2014: 78 buildings, average cost: $314,600
- 2013: 55 buildings, average cost: $285,200
- 2012: 52 buildings, average cost: $255,200
- 2011: 24 buildings, average cost: $255,100
- 2010: 21 buildings, average cost: $273,800
- 2009: 19 buildings, average cost: $244,900
- 2008: 10 buildings, average cost: $435,000
- 2007: 14 buildings, average cost: $527,100
- 2006: 59 buildings, average cost: $188,300
- 2005: 50 buildings, average cost: $418,000
- 2004: 58 buildings, average cost: $336,000
- 2003: 65 buildings, average cost: $354,300
- 2002: 80 buildings, average cost: $365,500
- 2001: 100 buildings, average cost: $313,000
- 2000: 124 buildings, average cost: $272,800
- 1999: 96 buildings, average cost: $225,900
- 1998: 37 buildings, average cost: $182,600
- 1997: 67 buildings, average cost: $197,200
| Here: | 2.4% |
| Missouri: | 2.8% |
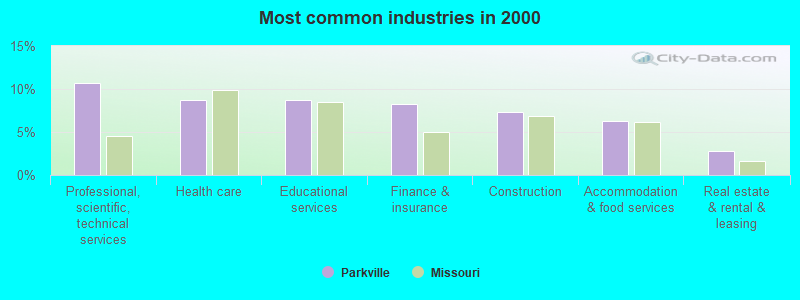
- Professional, scientific, technical services (10.7%)
- Health care (8.8%)
- Educational services (8.7%)
- Finance & insurance (8.3%)
- Construction (7.3%)
- Accommodation & food services (6.3%)
- Real estate & rental & leasing (2.8%)
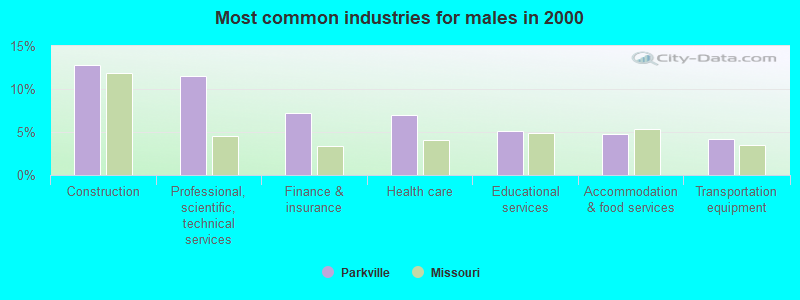
- Construction (12.8%)
- Professional, scientific, technical services (11.5%)
- Finance & insurance (7.3%)
- Health care (7.0%)
- Educational services (5.1%)
- Accommodation & food services (4.8%)
- Transportation equipment (4.2%)
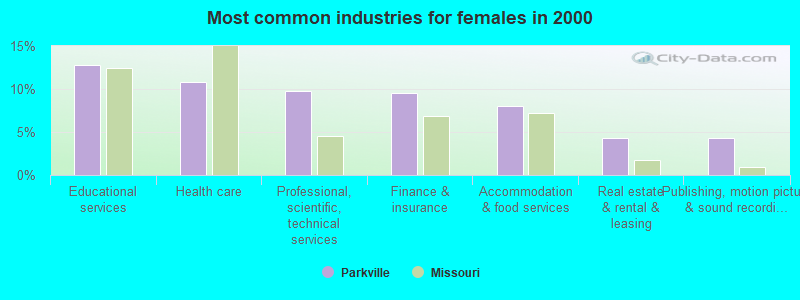
- Educational services (12.7%)
- Health care (10.8%)
- Professional, scientific, technical services (9.8%)
- Finance & insurance (9.5%)
- Accommodation & food services (8.0%)
- Real estate & rental & leasing (4.3%)
- Publishing, motion picture & sound recording industries (4.2%)
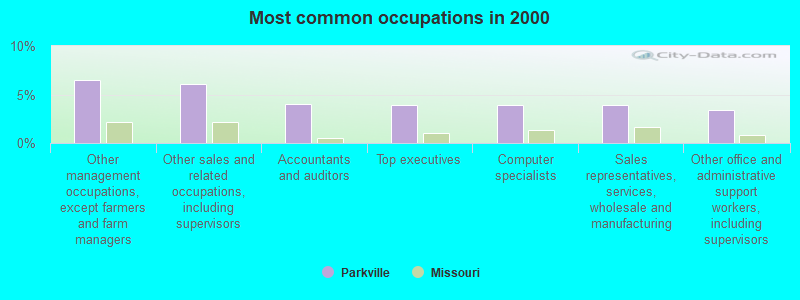
- Other management occupations, except farmers and farm managers (6.5%)
- Other sales and related occupations, including supervisors (6.1%)
- Accountants and auditors (4.1%)
- Top executives (4.0%)
- Computer specialists (3.9%)
- Sales representatives, services, wholesale and manufacturing (3.9%)
- Other office and administrative support workers, including supervisors (3.4%)
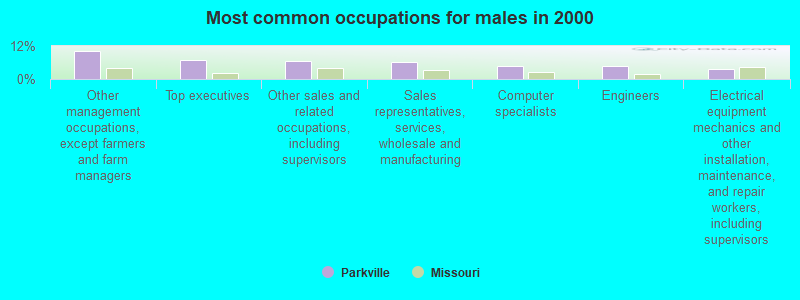
- Other management occupations, except farmers and farm managers (10.1%)
- Top executives (6.9%)
- Other sales and related occupations, including supervisors (6.5%)
- Sales representatives, services, wholesale and manufacturing (6.1%)
- Computer specialists (4.6%)
- Engineers (4.6%)
- Electrical equipment mechanics and other installation, maintenance, and repair workers, including supervisors (3.7%)
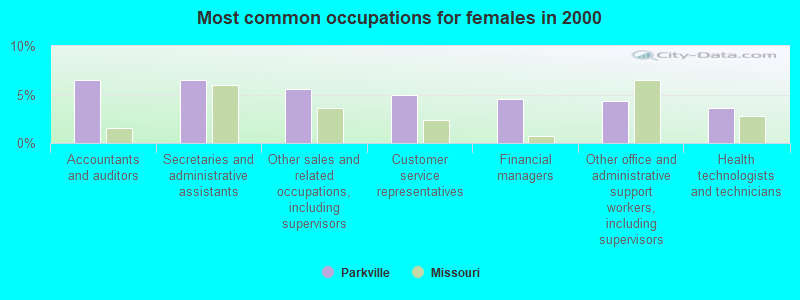
- Accountants and auditors (6.5%)
- Secretaries and administrative assistants (6.5%)
- Other sales and related occupations, including supervisors (5.5%)
- Customer service representatives (4.9%)
- Financial managers (4.5%)
- Other office and administrative support workers, including supervisors (4.3%)
- Health technologists and technicians (3.6%)
Average climate in Parkville, Missouri
Based on data reported by over 4,000 weather stations


|
|

(lower is better)
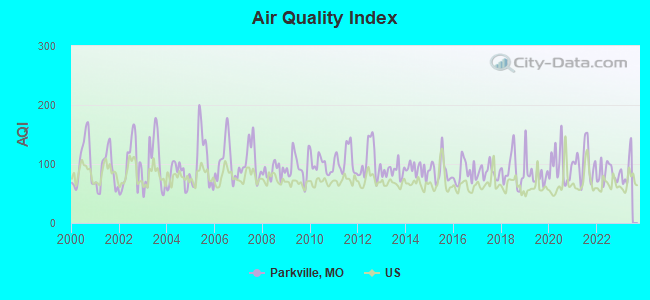
Air Quality Index (AQI) level in 2022 was 83.9. This is about average.
| City: | 83.9 |
| U.S.: | 72.6 |
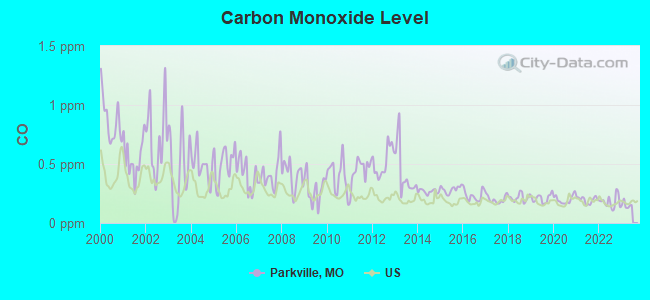
Carbon Monoxide (CO) [ppm] level in 2022 was 0.181. This is better than average. Closest monitor was 5.2 miles away from the city center.
| City: | 0.181 |
| U.S.: | 0.251 |
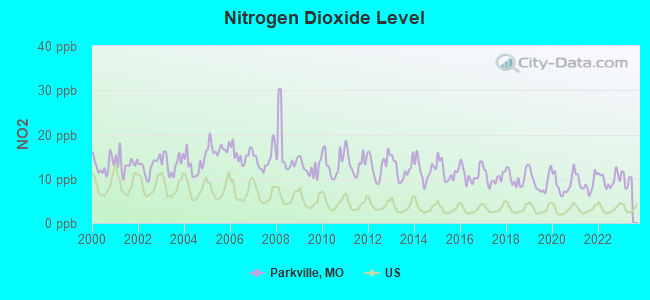
Nitrogen Dioxide (NO2) [ppb] level in 2022 was 9.80. This is significantly worse than average. Closest monitor was 4.4 miles away from the city center.
| City: | 9.80 |
| U.S.: | 5.11 |
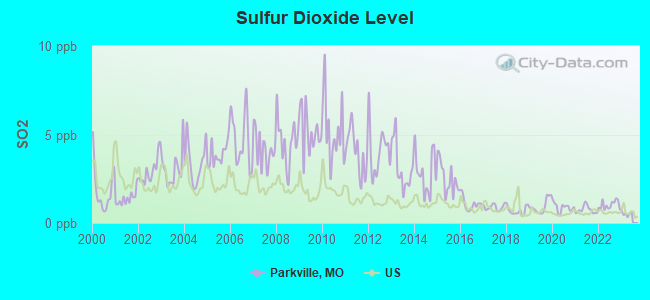
Sulfur Dioxide (SO2) [ppb] level in 2022 was 1.02. This is significantly better than average. Closest monitor was 2.1 miles away from the city center.
| City: | 1.02 |
| U.S.: | 1.51 |
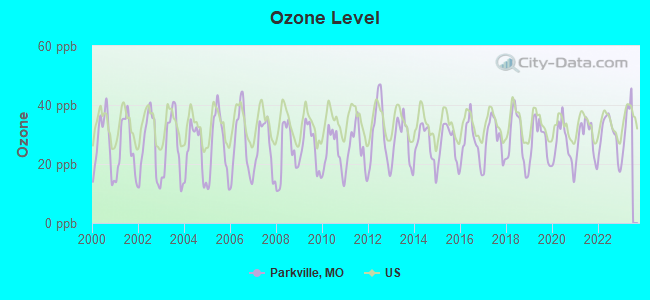
Ozone [ppb] level in 2022 was 29.8. This is about average. Closest monitor was 2.1 miles away from the city center.
| City: | 29.8 |
| U.S.: | 33.3 |
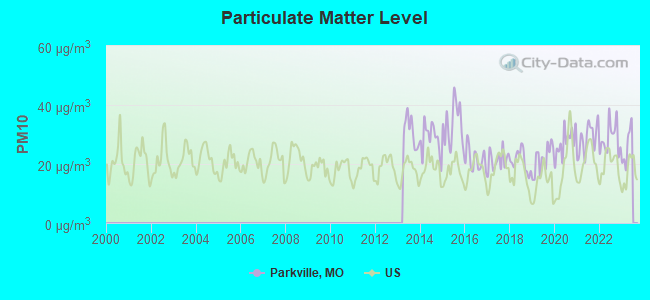
Particulate Matter (PM10) [µg/m3] level in 2022 was 28.7. This is significantly worse than average. Closest monitor was 6.0 miles away from the city center.
| City: | 28.7 |
| U.S.: | 19.2 |
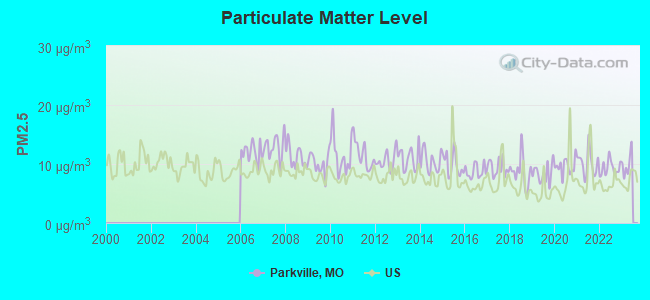
Particulate Matter (PM2.5) [µg/m3] level in 2022 was 9.31. This is about average. Closest monitor was 6.0 miles away from the city center.
| City: | 9.31 |
| U.S.: | 8.11 |
Tornado activity:
Parkville-area historical tornado activity is slightly above Missouri state average. It is 105% greater than the overall U.S. average.
On 5/20/1957, a category F5 (max. wind speeds 261-318 mph) tornado 21.3 miles away from the Parkville city center killed 44 people and injured 207 people and caused between $500,000 and $5,000,000 in damages.
On 5/22/1952, a category F4 (max. wind speeds 207-260 mph) tornado 8.9 miles away from the city center injured 3 people and caused between $50,000 and $500,000 in damages.
Earthquake activity:
Parkville-area historical earthquake activity is significantly above Missouri state average. It is 494% greater than the overall U.S. average.On 9/3/2016 at 12:02:44, a magnitude 5.8 (5.8 MW, Depth: 3.5 mi, Class: Moderate, Intensity: VI - VII) earthquake occurred 227.5 miles away from Parkville center
On 11/6/2011 at 03:53:10, a magnitude 5.7 (5.7 MW, Depth: 3.2 mi) earthquake occurred 278.0 miles away from Parkville center
On 11/12/2014 at 21:40:00, a magnitude 4.9 (4.9 MW, Depth: 2.5 mi, Class: Light, Intensity: IV - V) earthquake occurred 207.8 miles away from the city center
On 11/7/2016 at 01:44:24, a magnitude 5.0 (5.0 MW, Depth: 2.8 mi) earthquake occurred 250.2 miles away from Parkville center
On 2/13/2016 at 17:07:06, a magnitude 5.1 (5.1 MW, Depth: 5.2 mi) earthquake occurred 288.7 miles away from the city center
On 1/19/2020 at 19:08:42, a magnitude 4.5 (4.5 MW, Depth: 3.1 mi) earthquake occurred 195.3 miles away from the city center
Magnitude types: moment magnitude (MW)
Natural disasters:
The number of natural disasters in Platte County (24) is greater than the US average (15).Major Disasters (Presidential) Declared: 15
Emergencies Declared: 6
Causes of natural disasters: Floods: 16, Storms: 14, Tornadoes: 4, Winter Storms: 4, Winds: 2, Drought: 1, Hurricane: 1, Ice Storm: 1, Snowstorm: 1, Other: 1 (Note: some incidents may be assigned to more than one category).
Hospitals and medical centers near Parkville:
- HOSPICE ADVANTAGE (Hospital, about 1 miles away; KANSAS CITY, MO)
- PLATTE WOODS DIALYSIS (Dialysis Facility, about 3 miles away; KANSAS CITY, MO)
- BRYANT BUTLER KITCHEN NURSING CTR (Nursing Home, about 4 miles away; KANSAS CITY, KS)
- RIVERSIDE NURSING AND REHABILITATION CENTER, LLC (Nursing Home, about 4 miles away; RIVERSIDE, MO)
- KENDALLWOOD HOSPICE COMPANY (Hospital, about 4 miles away; RIVERSIDE, MO)
- LIFE CARE CENTER OF KANSAS CITY (Nursing Home, about 5 miles away; KANSAS CITY, KS)
- MEDICALODGES KANSAS CITY (Nursing Home, about 5 miles away; KANSAS CITY, KS)
Amtrak stations near Parkville:
- 10 miles: KANSAS CITY (2200 MAIN ST.) . Services: ticket office, fully wheelchair accessible, enclosed waiting area, public restrooms, public payphones, snack bar, free short-term parking, paid long-term parking, call for car rental service, taxi stand, public transit connection.
- 16 miles: INDEPENDENCE (600 S. GRAND AVE.) . Services: free short-term parking, call for taxi service.
College/University in Parkville:
Other colleges/universities with over 2000 students near Parkville:
- Grantham University (about 4 miles; Kansas City, MO; Full-time enrollment: 8,385)
- Kansas City Kansas Community College (about 7 miles; Kansas City, KS; FT enrollment: 4,718)
- Metropolitan Community College-Kansas City (about 11 miles; Kansas City, MO; FT enrollment: 12,834)
- University of Missouri-Kansas City (about 13 miles; Kansas City, MO; FT enrollment: 10,544)
- Rockhurst University (about 13 miles; Kansas City, MO; FT enrollment: 2,013)
- Wright Career College (about 19 miles; Overland Park, KS; FT enrollment: 3,107)
- Johnson County Community College (about 19 miles; Overland Park, KS; FT enrollment: 11,976)
Public elementary/middle school in Parkville:
- GRADEN ELEM. (Students: 451, Location: 8804 HWY 45 NW, Grades: KG-5)
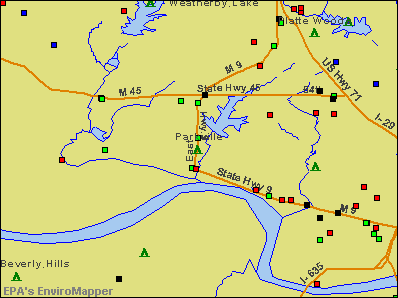
Points of interest:
Notable location: Southern Platte Fire Protection District Station 1 (A). Display/hide its location on the map
Shopping Centers: Parkville Heights Shopping Center (1), Park Plaza Shopping Center (2). Display/hide their locations on the map
Churches in Parkville include: Cornerstone Bible Church (A), Hawthorne House (B), Washington Chapel Christian Methodist Episcopal Church (C). Display/hide their locations on the map
Reservoirs: Riss Lake (A), Adkison Lake (B). Display/hide their locations on the map
Streams, rivers, and creeks: White Aloe Branch (A), Rush Creek (B). Display/hide their locations on the map
Hotels: Four Seasons Lawn & Landscape (403 East Street), KC Travel Intl (6806 Northwest Cross Road).
Birthplace of: William Alfred Quayle - Biographer, Frank Ringo - Baseball player, Tommy Hottovy - Baseball player.
Drinking water stations with addresses in Parkville and their reported violations in the past:
VICKERY RESORT CONDOMINIUMS (Population served: 80, Groundwater):Past health violations:Past monitoring violations:
- MCL, Monthly (TCR) - In AUG-2011, Contaminant: Coliform. Follow-up actions: St Public Notif requested (AUG-30-2011), St Violation/Reminder Notice (AUG-30-2011), St Public Notif received (NOV-02-2011), St Compliance achieved (JAN-22-2014)
- MCL, Monthly (TCR) - In AUG-2010, Contaminant: Coliform. Follow-up actions: St Public Notif requested (SEP-07-2010), St Violation/Reminder Notice (SEP-07-2010), St Public Notif received (OCT-21-2010), St Compliance achieved (JAN-22-2014)
- MCL, Monthly (TCR) - In OCT-2007, Contaminant: Coliform. Follow-up actions: St Public Notif requested (NOV-02-2007), St Violation/Reminder Notice (NOV-02-2007), St Compliance achieved (DEC-20-2010)
- One routine major monitoring violation
| This city: | 2.6 people |
| Missouri: | 2.5 people |
| This city: | 74.4% |
| Whole state: | 65.3% |
| This city: | 3.7% |
| Whole state: | 6.7% |
Likely homosexual households (counted as self-reported same-sex unmarried-partner households)
- Lesbian couples: 0.2% of all households
- Gay men: 0.3% of all households
People in group quarters in Parkville in 2010:
- 333 people in college/university student housing
- 54 people in emergency and transitional shelters (with sleeping facilities) for people experiencing homelessness
- 9 people in group homes intended for adults
People in group quarters in Parkville in 2000:
- 181 people in college dormitories (includes college quarters off campus)
- 28 people in other noninstitutional group quarters
- 9 people in homes for the mentally retarded
Banks with branches in Parkville (2011 data):
- Commerce Bank: Parkville Branch at 9155 Nw 45 Hwy, branch established on 2005/04/25. Info updated 2011/07/07: Bank assets: $20,493.6 mil, Deposits: $16,805.3 mil, headquarters in Kansas City, MO, positive income, 206 total offices, Holding Company: Commerce Bancshares, Inc.
- Platte Valley Bank of Missouri: Parkville Branch at 8401 Nw Highway 45, branch established on 2001/08/13. Info updated 2006/11/03: Bank assets: $356.7 mil, Deposits: $289.6 mil, headquarters in Platte City, MO, positive income, Commercial Lending Specialization, 8 total offices, Holding Company: Platte County Bancshares, Inc.
- PATRIOTS BANK: Park Bank Branch at 12 East First Street, branch established on 1911/07/11. Info updated 2011/06/13: Bank assets: $85.1 mil, Deposits: $76.5 mil, headquarters in Liberty, MO, negative income in the last year, Commercial Lending Specialization, 4 total offices, Holding Company: Liberty First Bancshares, Inc.
- BankLiberty.: Farley State Bank Branch at 6309 Nw 9 Hwy, branch established on 1907/05/09. Info updated 2011/07/21: Bank assets: $435.2 mil, Deposits: $292.0 mil, headquarters in Liberty, MO, positive income, Commercial Lending Specialization, 10 total offices
For population 15 years and over in Parkville:
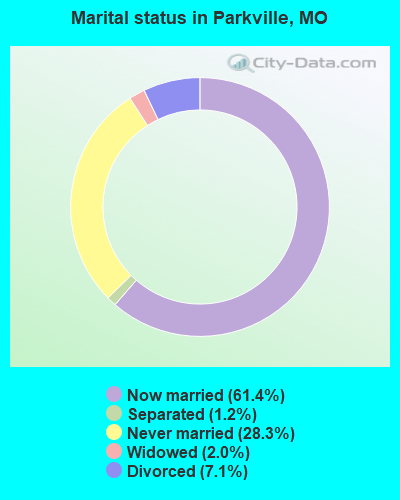
- Never married: 28.3%
- Now married: 61.4%
- Separated: 1.2%
- Widowed: 2.0%
- Divorced: 7.1%
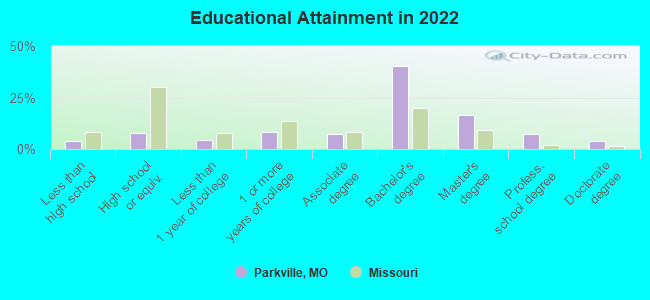
For population 25 years and over in Parkville:
- High school or higher: 96.2%
- Bachelor's degree or higher: 69.2%
- Graduate or professional degree: 27.8%
- Unemployed: 2.5%
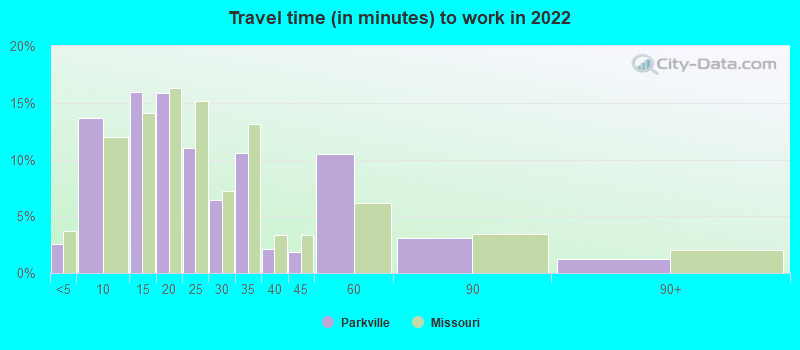
- Mean travel time to work (commute): 18.4 minutes
| Here: | 10.2 |
| Missouri average: | 11.1 |
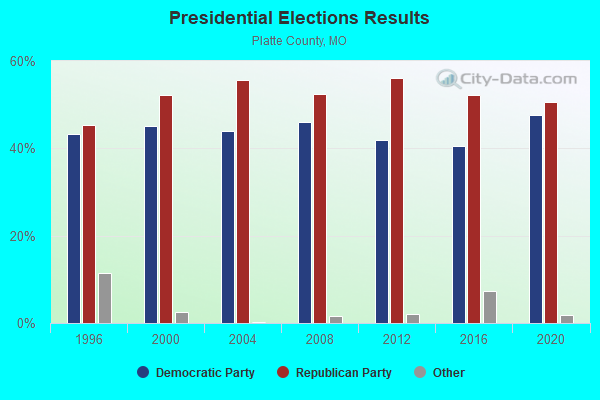
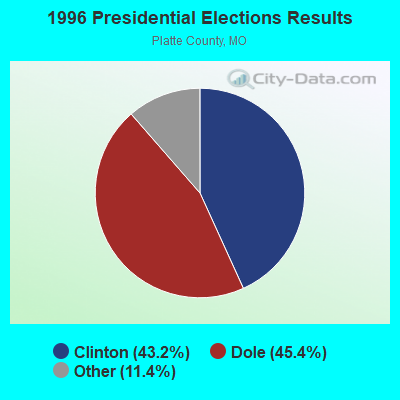
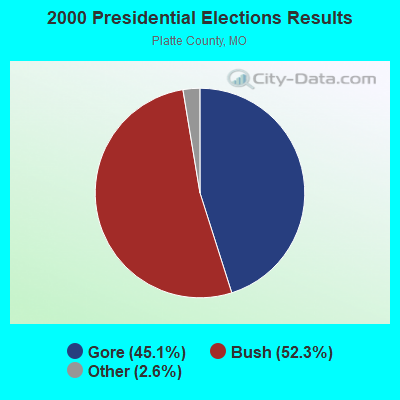
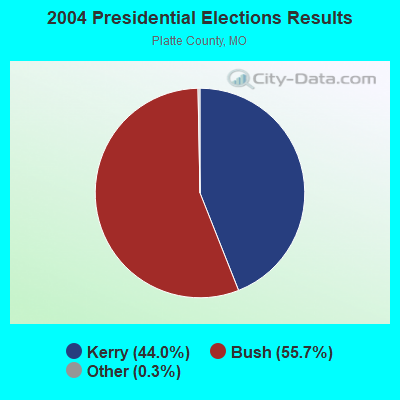
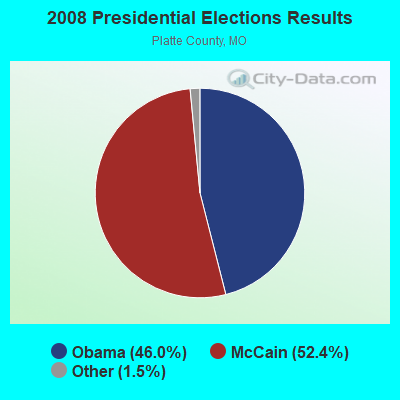
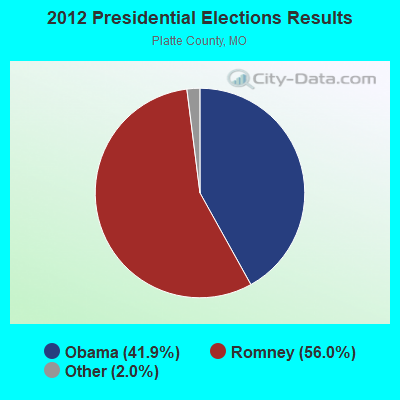
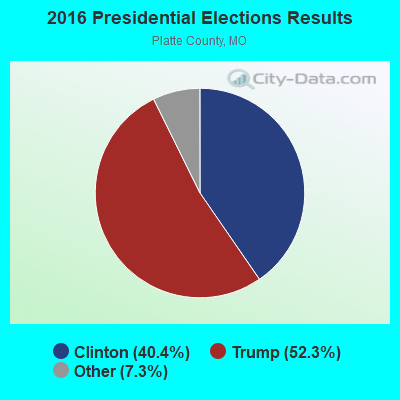
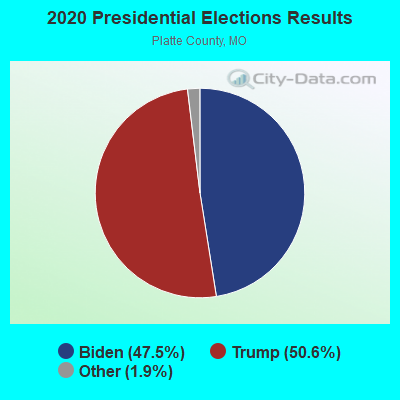
Graphs represent county-level data. Detailed 2008 Election Results
Religion statistics for Parkville, MO (based on Platte County data)
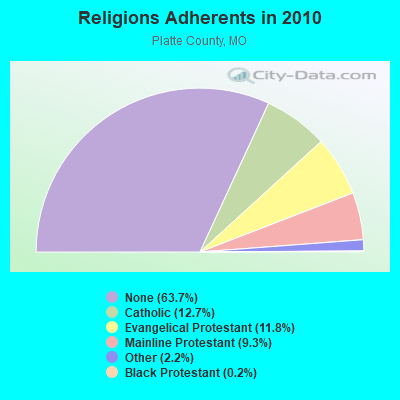
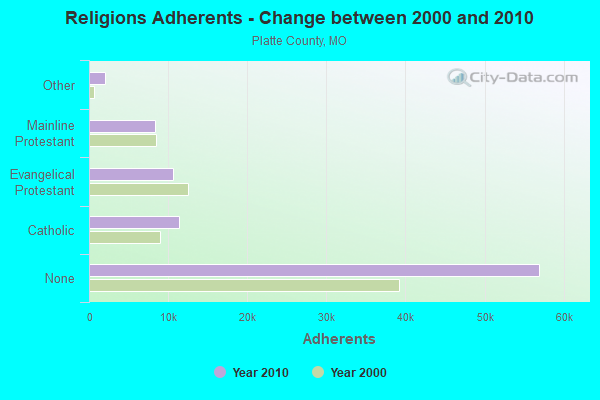
| Religion | Adherents | Congregations |
|---|---|---|
| Catholic | 11,380 | 3 |
| Evangelical Protestant | 10,560 | 41 |
| Mainline Protestant | 8,281 | 21 |
| Other | 1,974 | 9 |
| Black Protestant | 185 | 1 |
| Orthodox | - | - |
| None | 56,942 | - |
Food Environment Statistics:
| Here: | 1.53 / 10,000 pop. |
| State: | 1.88 / 10,000 pop. |
| Platte County: | 0.12 / 10,000 pop. |
| Missouri: | 0.18 / 10,000 pop. |
| Platte County: | 0.12 / 10,000 pop. |
| Missouri: | 0.60 / 10,000 pop. |
| Here: | 2.83 / 10,000 pop. |
| Missouri: | 4.34 / 10,000 pop. |
| Platte County: | 8.62 / 10,000 pop. |
| Missouri: | 7.37 / 10,000 pop. |
| Here: | 7.7% |
| State: | 8.8% |
| Platte County: | 29.0% |
| Missouri: | 29.6% |
| Platte County: | 15.6% |
| Missouri: | 13.5% |
Health and Nutrition:
| Parkville: | 61.0% |
| Missouri: | 50.9% |
| Parkville: | 66.2% |
| Missouri: | 48.6% |
| This city: | 27.1 |
| Missouri: | 28.7 |
| This city: | 17.0% |
| Missouri: | 20.6% |
| Parkville: | 6.0% |
| State: | 10.1% |
| Here: | 7.1 |
| Missouri: | 6.8 |
| Parkville: | 30.5% |
| Missouri: | 34.3% |
| This city: | 68.6% |
| Missouri: | 57.5% |
| Parkville: | 85.2% |
| Missouri: | 79.3% |
More about Health and Nutrition of Parkville, MO Residents
| Local government employment and payroll (March 2022) | |||||
| Function | Full-time employees | Monthly full-time payroll | Average yearly full-time wage | Part-time employees | Monthly part-time payroll |
|---|---|---|---|---|---|
| Police Protection - Officers | 14 | $79,994 | $68,566 | 0 | $0 |
| Streets and Highways | 5 | $22,984 | $55,162 | 0 | $0 |
| Parks and Recreation | 4 | $19,967 | $59,901 | 2 | $1,969 |
| Housing and Community Development (Local) | 4 | $20,935 | $62,805 | 1 | $2,126 |
| Financial Administration | 3 | $15,623 | $62,492 | 0 | $0 |
| Other Government Administration | 3 | $19,262 | $77,048 | 9 | $4,906 |
| Other and Unallocable | 2 | $22,363 | $134,178 | 2 | $6,126 |
| Police - Other | 1 | $4,209 | $50,508 | 0 | $0 |
| Judicial and Legal | 1 | $4,193 | $50,316 | 1 | $1,508 |
| Sewerage | 1 | $5,361 | $64,332 | 0 | $0 |
| Totals for Government | 38 | $214,892 | $67,861 | 15 | $16,633 |
Parkville government finances - Expenditure in 2021 (per resident):
- Current Operations - Police Protection: $1,277,000 ($149.51)
Regular Highways: $766,000 ($89.69)
Housing and Community Development: $292,000 ($34.19)
Central Staff Services: $242,000 ($28.33)
Parks and Recreation: $219,000 ($25.64)
Judicial and Legal Services: $145,000 ($16.98)
Financial Administration: $137,000 ($16.04)
General - Other: $108,000 ($12.64)
Sewerage: $30,000 ($3.51)
- General - Interest on Debt: $394,000 ($46.13)
Parkville government finances - Revenue in 2021 (per resident):
- Charges - Sewerage: $1,418,000 ($166.02)
- Miscellaneous - Special Assessments: $416,000 ($48.71)
Sale of Property: $399,000 ($46.72)
General Revenue - Other: $371,000 ($43.44)
Donations From Private Sources: $182,000 ($21.31)
Rents: $65,000 ($7.61)
Fines and Forfeits: $61,000 ($7.14)
Interest Earnings: $7,000 ($0.82)
Royalties: $1,000 ($0.12)
- State Intergovernmental - General Local Government Support: $375,000 ($43.91)
Other: $215,000 ($25.17)
Highways: $78,000 ($9.13)
- Tax - Property: $1,343,000 ($157.24)
General Sales and Gross Receipts: $949,000 ($111.11)
Public Utilities Sales: $793,000 ($92.85)
Occupation and Business License - Other: $561,000 ($65.68)
Alcoholic Beverage License: $15,000 ($1.76)
Parkville government finances - Debt in 2021 (per resident):
- Long Term Debt - Outstanding Unspecified Public Purpose: $19,113,000 ($2237.79)
Beginning Outstanding - Unspecified Public Purpose: $13,857,000 ($1622.41)
Issue, Unspecified Public Purpose: $6,821,000 ($798.62)
Retired Unspecified Public Purpose: $1,564,000 ($183.12)
Parkville government finances - Cash and Securities in 2021 (per resident):
- Bond Funds - Cash and Securities: $5,256,000 ($615.38)
- Other Funds - Cash and Securities: $3,332,000 ($390.12)
- Sinking Funds - Cash and Securities: $1,332,000 ($155.95)
12.47% of this county's 2021 resident taxpayers lived in other counties in 2020 ($71,417 average adjusted gross income)
| Here: | 12.47% |
| Missouri average: | 7.67% |
0.05% of residents moved from foreign countries ($363 average AGI)
Platte County: 0.05% Missouri average: 0.02%
Top counties from which taxpayers relocated into this county between 2020 and 2021:
| from Clay County, MO | |
| from Jackson County, MO | |
| from Johnson County, KS |
11.31% of this county's 2020 resident taxpayers moved to other counties in 2021 ($88,963 average adjusted gross income)
| Here: | 11.31% |
| Missouri average: | 7.51% |
0.05% of residents moved to foreign countries ($457 average AGI)
Platte County: 0.05% Missouri average: 0.01%
Top counties to which taxpayers relocated from this county between 2020 and 2021:
| to Clay County, MO | |
| to Jackson County, MO | |
| to Johnson County, KS |
| Businesses in Parkville, MO | ||||
| Name | Count | Name | Count | |
|---|---|---|---|---|
| H&R Block | 1 | U-Haul | 1 | |
| Pizza Hut | 1 | Walgreens | 1 | |
| SONIC Drive-In | 1 | YMCA | 1 | |
| Subway | 1 | |||
Strongest AM radio stations in Parkville:
- WHB (810 AM; 50 kW; KANSAS CITY, MO; Owner: UNION BROADCASTING, INC.)
- KKHK (1250 AM; 25 kW; KANSAS CITY, KS)
- KCMO (710 AM; 10 kW; KANSAS CITY, MO; Owner: SUSQUEHANNA KANSAS CITY PARTNERSHIP)
- KXTR (1660 AM; 10 kW; KANSAS CITY, KS; Owner: ENTERCOM KANSAS CITY LICENSE, LLC)
- KMBZ (980 AM; 5 kW; KANSAS CITY, MO; Owner: ENTERCOM KANSAS CITY LICENSE, LLC)
- KCCV (760 AM; daytime; 6 kW; OVERLAND PARK, KS; Owner: BOTT BROADCASTING COMPANY)
- KCSP (610 AM; 5 kW; KANSAS CITY, MO; Owner: ENTERCOM KANSAS CITY LICENSE, LLC)
- KCTE (1510 AM; daytime; 10 kW; INDEPENDENCE, MO; Owner: UNION BROADCASTING, INC.)
- KCNW (1380 AM; 2 kW; FAIRWAY, KS; Owner: KANSAS CITY RADIO, INC.)
- KPHN (1190 AM; 5 kW; KANSAS CITY, MO; Owner: ABC, INC.)
- KCKN (1340 AM; 1 kW; KANSAS CITY, KS; Owner: CARTER BROADCAST GROUP, INC.)
- KKLO (1410 AM; 5 kW; LEAVENWORTH, KS; Owner: CHARA COMMUNICATIONS, INC.)
- KCZZ (1480 AM; 1 kW; MISSION, KS; Owner: HMEB COMMUNICATIONS, L.L.C.)
Strongest FM radio stations in Parkville:
- KFKF-FM (94.1 FM; KANSAS CITY, KS; Owner: INFINITY RADIO SUBSIDIARY OPERATIONS INC.)
- KZPL (97.3 FM; LEE'S SUMMIT, MO; Owner: UNION FIRST BROADCASTING, LLC)
- KCMO-FM (94.9 FM; KANSAS CITY, MO; Owner: SUSQUEHANNA KANSAS CITY PARTNERSHIP)
- KSRC (102.1 FM; KANSAS CITY, MO; Owner: INFINITY RADIO OPERATIONS INC.)
- WDAF-FM (106.5 FM; LIBERTY, MO; Owner: ENTERCOM KANSAS CITY LICENSE, LLC)
- KUDL (98.1 FM; KANSAS CITY, KS; Owner: ENTERCOM KANSAS CITY LICENSE, LLC)
- KBEQ-FM (104.3 FM; KANSAS CITY, MO; Owner: INFINITY RADIO SUBSIDIARY OPERATIONS INC.)
- KGSP (90.3 FM; PARKVILLE, MO; Owner: BOARD OF TRUSTEES, PARK UNIVERSITY)
- KQRC-FM (98.9 FM; LEAVENWORTH, KS; Owner: ENTERCOM KANSAS CITY LICENSE, LLC)
- KRBZ (96.5 FM; KANSAS CITY, MO; Owner: ENTERCOM KANSAS CITY LICENSE, LLC)
- KYYS (99.7 FM; KANSAS CITY, MO; Owner: ENTERCOM KANSAS CITY LICENSE, LLC)
- KMXV (93.3 FM; KANSAS CITY, MO; Owner: INFINITY RADIO OPERATIONS INC.)
- KCUR-FM (89.3 FM; KANSAS CITY, MO; Owner: CURATORS OF UNIVERSITY OF MISSOURI)
- KPRS (103.3 FM; KANSAS CITY, MO; Owner: CARTER BROADCAST GROUP, INC.)
- KLJC (88.5 FM; KANSAS CITY, MO; Owner: CALVARY BIBLE COLLEGE)
- KKFI (90.1 FM; KANSAS CITY, MO; Owner: MID-COAST RADIO PROJECT, INC.)
- KCCV-FM (92.3 FM; OLATHE, KS; Owner: BOTT BROADCASTING COMPANY)
- KCFX (101.1 FM; HARRISONVILLE, MO; Owner: SUSQUEHANNA KANSAS CITY PARTNERSHIP)
- KMJK (107.3 FM; LEXINGTON, MO; Owner: ALLUR-KANSAS CITY, INC.)
- KKJO-FM (105.5 FM; ST. JOSEPH, MO; Owner: EAGLE RADIO, INC)
TV broadcast stations around Parkville:
- KCTV (Channel 5; KANSAS CITY, MO; Owner: MEREDITH CORPORATION)
- KMBC-TV (Channel 9; KANSAS CITY, MO; Owner: KMBC HEARST-ARGYLE TELEVISION, INC.)
- KSHB-TV (Channel 41; KANSAS CITY, MO; Owner: SCRIPPS HOWARD BROADCASTING COMPANY)
- WDAF-TV (Channel 4; KANSAS CITY, MO; Owner: WDAF LICENSE, INC.)
- KCWE (Channel 29; KANSAS CITY, MO; Owner: KCWE-TV, INC.)
- KCPT (Channel 19; KANSAS CITY, MO; Owner: PUBLIC TELEVISION 19, INC.)
- KSMO-TV (Channel 62; KANSAS CITY, MO; Owner: KSMO LICENSEE, INC.)
- KPXE (Channel 50; KANSAS CITY, MO; Owner: PAXSON KANSAS CITY LICENSE, INC.)
- K48FS (Channel 48; KANSAS CITY, MO; Owner: WORD OF GOD FELLOWSHIP, INC.)
- KMCI (Channel 38; LAWRENCE, KS; Owner: SCRIPPS HOWARD BROADCASTING COMPANY)
- K35CT (Channel 35; KANSAS CITY, MO; Owner: WORD OF GOD FELLOWSHIP, INC.)
- K26CR (Channel 26; KANSAS CITY, MO; Owner: VENTANA TELEVISION, INC.)
- KTAJ (Channel 16; ST. JOSEPH, MO; Owner: TRINITY BROADCASTING NETWORK)
- National Bridge Inventory (NBI) Statistics
- 32Number of bridges
- 597ft / 182mTotal length
- $797,000Total costs
- 224,886Total average daily traffic
- 22,502Total average daily truck traffic
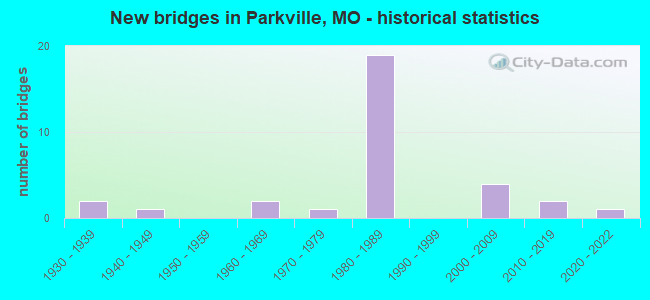
- New bridges - historical statistics
- 21930-1939
- 11940-1949
- 21960-1969
- 11970-1979
- 191980-1989
- 42000-2009
- 22010-2019
- 12020-2022
FCC Registered Antenna Towers:
46 (See the full list of FCC Registered Antenna Towers in Parkville)FCC Registered Broadcast Land Mobile Towers:
7- 6725 Nw Riverpark Dr (Lat: 39.169167 Lon: -94.656333), Call Sign: WNNC538,
Assigned Frequencies: 49.0000 MHz, Grant Date: 11/26/2003, Expiration Date: 12/13/2013, Cancellation Date: 04/17/2012, Certifier: Gary N Gompf, Registrant: Conocophillips Communications Inc., Bartlesville, OK 74005-3338, Phone: (918) 661-3338
- 8700 Nw River Park (Lat: 39.189167 Lon: -94.680028), Type: Bant, Structure height: 18.3 m, Call Sign: WPSK549,
Assigned Frequencies: 159.945 MHz, Grant Date: 05/25/2011, Expiration Date: 05/31/2021, Cancellation Date: 07/31/2021, Certifier: Peter Sturner, Registrant: Commenco, Inc., 4901 Bristol Avenue, Kansas City, MO 64129, Phone: (816) 753-2166, Fax: (816) 753-3688, Email:
- Lat: 39.220278 Lon: -94.710556, Call Sign: WPTD380,
Assigned Frequencies: 463.512 MHz, 457.562 MHz, 457.012 MHz, Grant Date: 09/04/2001, Expiration Date: 09/04/2011, Cancellation Date: 11/05/2011, Certifier: David M Saslow, Registrant: Gps Industries, LLC, 1074 North Orange Ave., Sarasota, FL 34236, Phone: (941) 306-3890, Fax: (941) 952-1859, Email:
- Mdc Parma Woods Range & Outdoor Education Center, 15900 River Road (Lat: 39.201861 Lon: -94.763778), Type: Gtower, Structure height: 21.3 m, Call Sign: WPTX796,
Assigned Frequencies: 151.325 MHz, 151.400 MHz, 151.445 MHz, 159.270 MHz, 159.435 MHz, Grant Date: 10/19/2021, Expiration Date: 01/09/2032, Certifier: James A Lundsted, Registrant: Missouri Department Of Conservation, 230 Commerce Drive, Suite 201, Jefferson City, MO 65102-0180, Phone: (573) 522-4115, Fax: (573) 751-4865, Email:
- Lat: 39.210194 Lon: -94.701639, Call Sign: WQGU490,
Assigned Frequencies: 457.525 MHz, 457.550 MHz, 457.575 MHz, 457.600 MHz, Grant Date: 04/18/2007, Expiration Date: 04/18/2017, Cancellation Date: 06/24/2017, Certifier: Micheal Galey, Registrant: Cara Enterprises Inc, Las Vegas, NV 89140-0124, Phone: (702) 838-9728, Fax: (702) 363-4607, Email:
- PARKVILLE MP 10.5 HB, Bnsf Ls16 Mp 10.5 Parkville Hbd (Lat: 39.191500 Lon: -94.698944), Type: Building, Structure height: 2.7 m, Overall height: 3.4 m, Call Sign: WQMB246,
Assigned Frequencies: 161.160 MHz, 161.100 MHz, Grant Date: 03/28/2020, Expiration Date: 06/16/2030, Certifier: Robert Leedham, Registrant: Bnsf Railway Co., 4515 Kansas Avenue, Kansas City, KS 66106, Phone: (913) 551-4015, Fax: (913) 551-4053, Email:
- Lat: 39.210194 Lon: -94.701639, Call Sign: WRAR718,
Assigned Frequencies: 457.525 MHz, 457.550 MHz, 457.575 MHz, 457.600 MHz, Grant Date: 02/08/2018, Expiration Date: 02/08/2028, Certifier: Emily Decker, Registrant: Akin Gump Strauss Hauer & Feld LLP, 2001 K Street Northwest, Washington, DC 20006, Phone: (202) 887-4524, Email:
FCC Registered Microwave Towers:
3- SOUTH TOWER, .1km S Of Jct Of Riss Lake Rd And Coffe Dr., Parkville Mo (Lat: 39.195278 Lon: -94.664444), Type: Gtower, Structure height: 62.1 m, Overall height: 67.6 m, Call Sign: WQPZ672,
Assigned Frequencies: 11035.0 MHz, 10795.0 MHz, 5974.85 MHz, Grant Date: 09/15/2022, Expiration Date: 09/28/2032, Certifier: Mark Owen, Registrant: Midwest Mobile Radio Service Inc., 812 South 10th Street, Saint Joseph, MO 64506, Phone: (816) 279-2065, Fax: (816) 233-8862, Email:
- PLATTE CO SO, .1km S Of Jct Of Riss Lake Rd And Coffe Dr., Parkville Mo (Lat: 39.195278 Lon: -94.664444), Type: Gtower, Structure height: 62.1 m, Overall height: 67.6 m, Call Sign: WQYZ342,
Assigned Frequencies: 11095.0 MHz, 11095.0 MHz, 11095.0 MHz, 11095.0 MHz, 11095.0 MHz, 11095.0 MHz, 11095.0 MHz, 11095.0 MHz, 11095.0 MHz, 6805.00 MHz... (+5 more), Grant Date: 03/09/2017, Expiration Date: 03/09/2027, Certifier: Nikki Thomas, Registrant: Commenco, LLC, 4901 Bristol Ave, Kansas City, MO 64129, Phone: (816) 753-2166, Fax: (816) 753-3688, Email:
- KCMCI00102A, 13220 Nw 45 Hwy (A5c0236) (Lat: 39.221389 Lon: -94.737361), Type: Mtower, Structure height: 53.3 m, Call Sign: WRTQ611,
Assigned Frequencies: 11265.0 MHz, 11265.0 MHz, 11265.0 MHz, 11265.0 MHz, 11265.0 MHz, 11265.0 MHz, 11265.0 MHz, 11265.0 MHz, 11265.0 MHz, 11265.0 MHz, 11265.0 MHz, 11265.0 MHz, Grant Date: 07/13/2022, Expiration Date: 07/13/2032, Certifier: Alison A Minea, Registrant: Dish Wireless L.L.C., 9601 S Meridan Blvd, Englewood, CO 80112, Phone: (202) 463-3709, Email:
FCC Registered Amateur Radio Licenses:
88 (See the full list of FCC Registered Amateur Radio Licenses in Parkville)FAA Registered Aircraft:
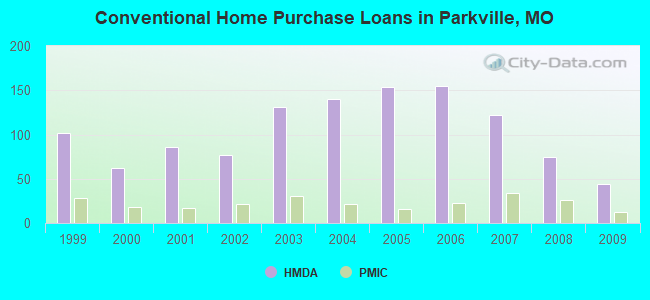
17 (See the full list of FAA Registered Aircraft in Parkville)| Home Mortgage Disclosure Act Aggregated Statistics For Year 2009 (Based on 3 partial tracts) | ||||||||||||
| A) FHA, FSA/RHS & VA Home Purchase Loans | B) Conventional Home Purchase Loans | C) Refinancings | D) Home Improvement Loans | F) Non-occupant Loans on < 5 Family Dwellings (A B C & D) | G) Loans On Manufactured Home Dwelling (A B C & D) | |||||||
|---|---|---|---|---|---|---|---|---|---|---|---|---|
| Number | Average Value | Number | Average Value | Number | Average Value | Number | Average Value | Number | Average Value | Number | Average Value | |
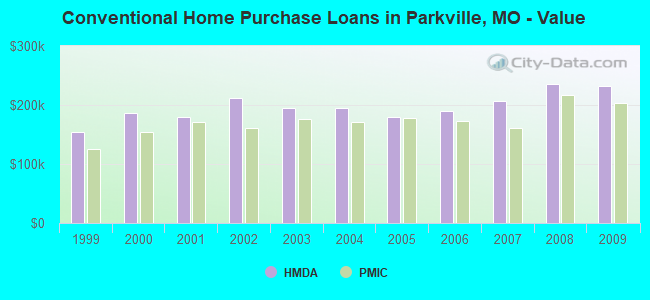
| LOANS ORIGINATED | 35 | $152,695 | 44 | $232,653 | 241 | $218,379 | 10 | $84,457 | 11 | $144,938 | 1 | $115,270 |
| APPLICATIONS APPROVED, NOT ACCEPTED | 1 | $135,600 | 3 | $142,747 | 19 | $207,498 | 3 | $10,077 | 0 | $0 | 0 | $0 |
| APPLICATIONS DENIED | 3 | $131,003 | 3 | $254,603 | 52 | $263,584 | 4 | $35,568 | 1 | $191,730 | 0 | $0 |
| APPLICATIONS WITHDRAWN | 6 | $132,518 | 4 | $251,755 | 46 | $185,119 | 2 | $85,315 | 1 | $147,680 | 0 | $0 |
| FILES CLOSED FOR INCOMPLETENESS | 0 | $0 | 1 | $178,180 | 9 | $233,577 | 0 | $0 | 0 | $0 | 0 | $0 |
Detailed HMDA statistics for the following Tracts: 0301.03 , 0303.05, 0303.06
| Private Mortgage Insurance Companies Aggregated Statistics For Year 2009 (Based on 3 partial tracts) | ||||||
| A) Conventional Home Purchase Loans | B) Refinancings | C) Non-occupant Loans on < 5 Family Dwellings (A & B) | ||||
|---|---|---|---|---|---|---|
| Number | Average Value | Number | Average Value | Number | Average Value | |
| LOANS ORIGINATED | 12 | $204,062 | 12 | $234,653 | 0 | $0 |
| APPLICATIONS APPROVED, NOT ACCEPTED | 2 | $226,890 | 3 | $289,343 | 1 | $54,430 |
| APPLICATIONS DENIED | 2 | $270,210 | 1 | $373,510 | 0 | $0 |
| APPLICATIONS WITHDRAWN | 1 | $81,820 | 0 | $0 | 0 | $0 |
| FILES CLOSED FOR INCOMPLETENESS | 0 | $0 | 1 | $201,830 | 0 | $0 |
Detailed PMIC statistics for the following Tracts: 0301.03 , 0303.05, 0303.06
2002 - 2018 National Fire Incident Reporting System (NFIRS) incidents
- Fire incident types reported to NFIRS in Parkville, MO
- 41453.1%Outside Fires
- 21727.9%Structure Fires
- 8010.3%Mobile Property/Vehicle Fires
- 688.7%Other
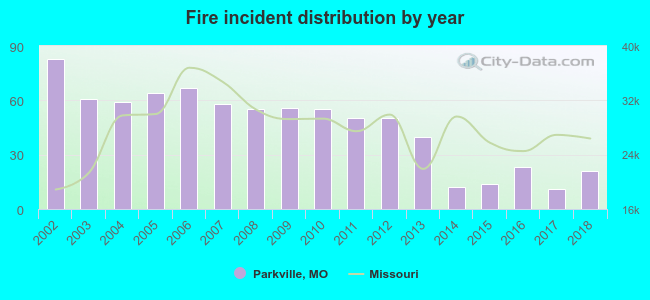 Based on the data from the years 2002 - 2018 the average number of fires per year is 46. The highest number of reported fire incidents - 83 took place in 2002, and the least - 11 in 2017. The data has a dropping trend.
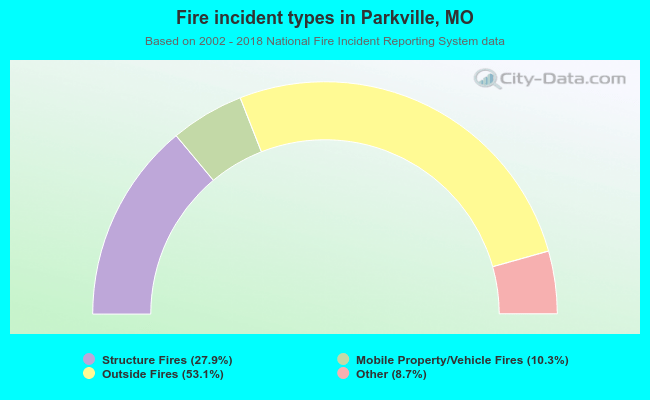 When looking into fire subcategories, the most reports belonged to: Outside Fires (53.1%), and Structure Fires (27.9%).
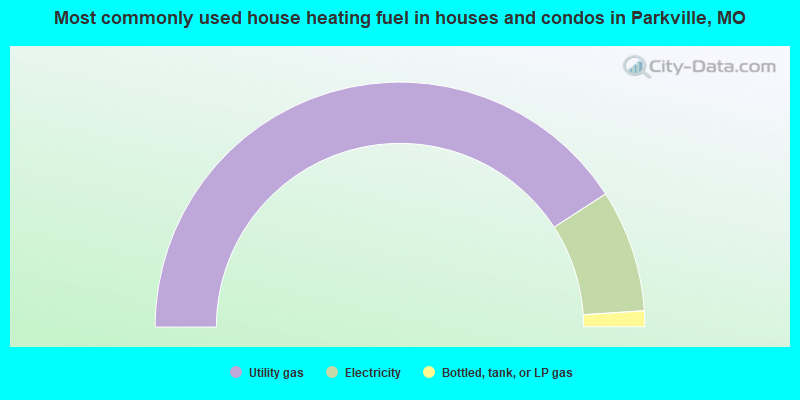
- 81.8%Utility gas
- 16.2%Electricity
- 2.1%Bottled, tank, or LP gas
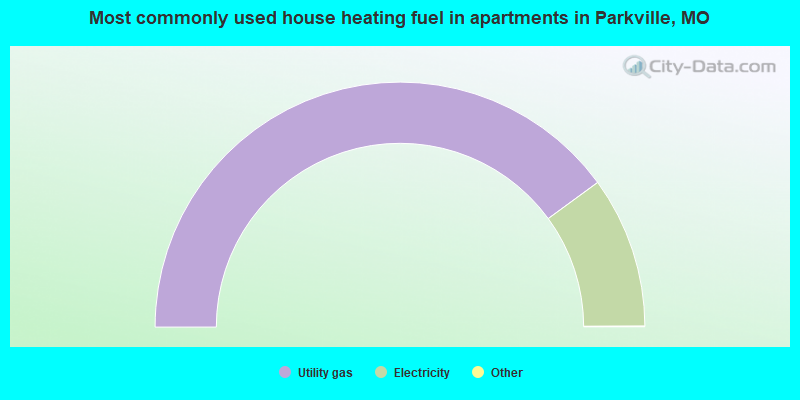
- 80.0%Utility gas
- 20.0%Electricity
Parkville compared to Missouri state average:
- Median household income significantly above state average.
- Median house value significantly above state average.
- Unemployed percentage significantly below state average.
- Hispanic race population percentage significantly above state average.
- Median age above state average.
- Length of stay since moving in above state average.
- Number of rooms per house above state average.
- House age significantly below state average.
- Number of college students above state average.
- Percentage of population with a bachelor's degree or higher significantly above state average.
Parkville on our top lists:
- #33 on the list of "Top 101 cities with largest percentage of females in occupations: legal occupations (population 5,000+)"
- #40 on the list of "Top 101 cities with largest percentage of males in occupations: business and financial operations occupations (population 5,000+)"
- #43 on the list of "Top 101 cities with largest percentage of females in industries: management of companies and enterprises (population 5,000+)"
- #73 on the list of "Top 101 cities with largest percentage of females in occupations: arts, design, entertainment, sports, and media occupations (population 5,000+)"
- #74 on the list of "Top 101 cities with largest percentage of females in industries: wholesale trade (population 5,000+)"
- #50 on the list of "Top 101 counties with the lowest total withdrawal of fresh water for public supply (pop. 50,000+)"
- #68 on the list of "Top 101 counties with the highest percentage of residents relocating from other counties between 2010 and 2011"
- #75 on the list of "Top 101 counties with the highest percentage of residents relocating to other counties in 2011"
- #76 on the list of "Top 101 counties with the largest number of children under 18 without health insurance coverage in 2000 (pop. 50,000+)"

|
|
Total of 215 patent applications in 2008-2024.