Races in Pinellas Park, Florida (FL) Detailed Stats
Data:
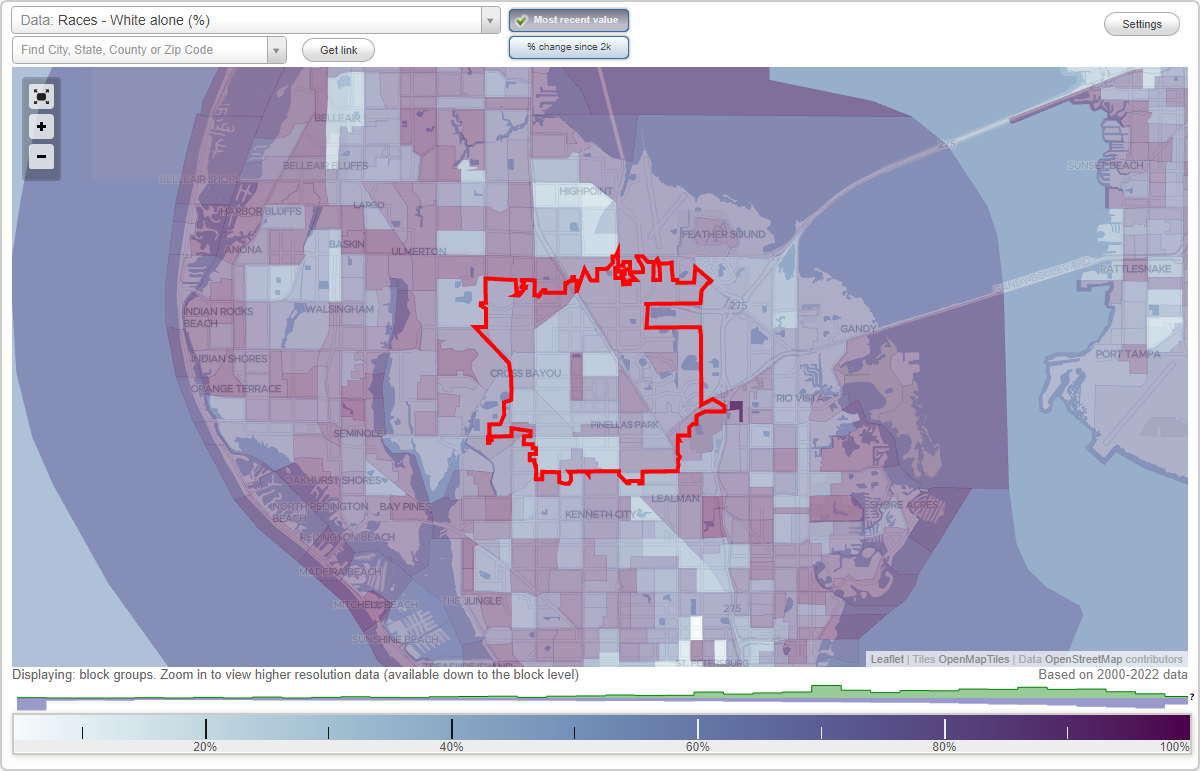
Races - White alone (%)
Races - White alone (% change since 2000)
Races - Black alone (%)
Races - Black alone (% change since 2000)
Races - American Indian alone (%)
Races - American Indian alone (% change since 2000)
Races - Asian alone (%)
Races - Asian alone (% change since 2000)
Races - Hispanic (%)
Races - Hispanic (% change since 2000)
Races - Native Hawaiian and Other Pacific Islander alone (%)
Races - Native Hawaiian and Other Pacific Islander alone (% change since 2000)
Races - Two or more races(%)
Races - Two or more races(% change since 2000)
Races - Other race alone (%)
Races - Other race alone (% change since 2000)
Racial diversity
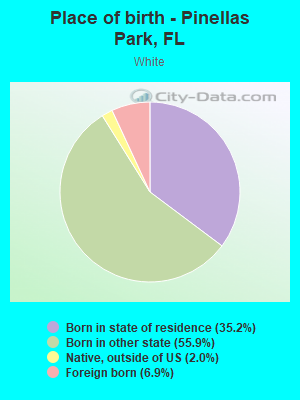
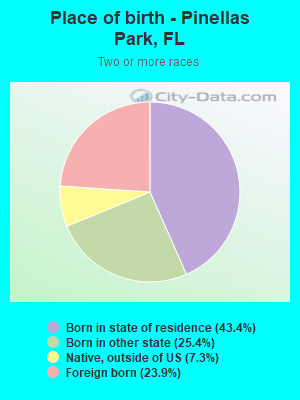
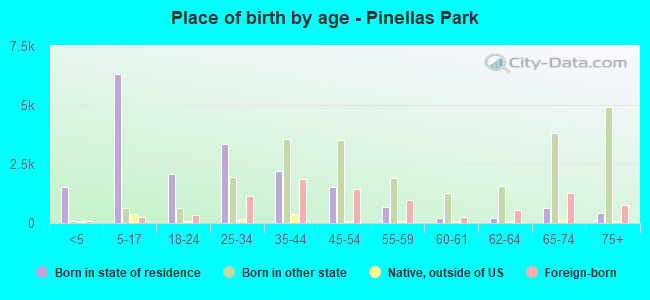
Place of birth - Born in state of residence (%)
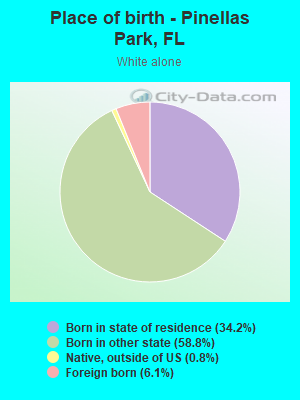
Place of birth - Born in state of residence (%) - White
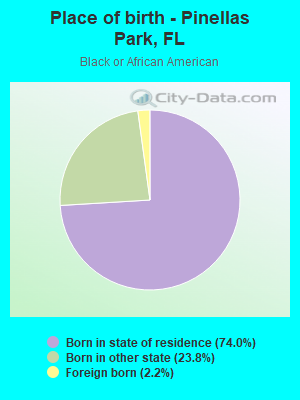
Place of birth - Born in state of residence (%) - Black or African American
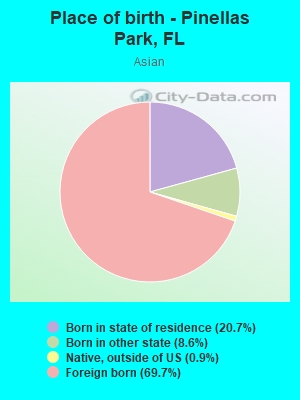
Place of birth - Born in state of residence (%) - Asian
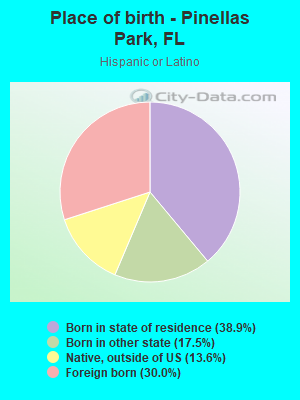
Place of birth - Born in state of residence (%) - Hispanic or Latino
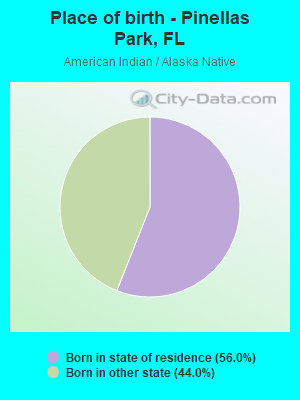
Place of birth - Born in state of residence (%) - American Indian and Alaska Native
Place of birth - Born in state of residence (%) - Multirace
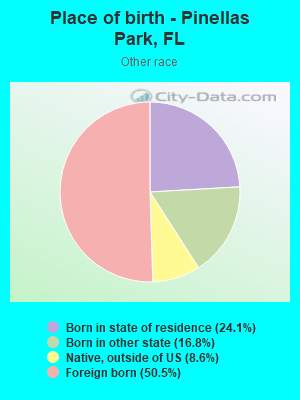
Place of birth - Born in state of residence (%) - Other Race
Place of birth - Born in other state (%)
Place of birth - Born in other state (%) - White
Place of birth - Born in other state (%) - Black or African American
Place of birth - Born in other state (%) - Asian
Place of birth - Born in other state (%) - Hispanic or Latino
Place of birth - Born in other state (%) - American Indian and Alaska Native
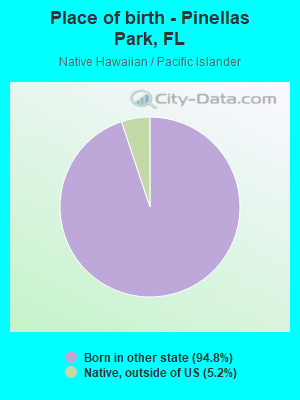
Place of birth - Born in other state (%) - Multirace
Place of birth - Born in other state (%) - Other Race
Place of birth - Native, outside of US (%)
Place of birth - Native, outside of US (%) - White
Place of birth - Native, outside of US (%) - Black or African American
Place of birth - Native, outside of US (%) - Asian
Place of birth - Native, outside of US (%) - Hispanic or Latino
Place of birth - Native, outside of US (%) - American Indian and Alaska Native
Place of birth - Native, outside of US (%) - Multirace
Place of birth - Native, outside of US (%) - Other Race
Place of birth - Foreign born (%)
Place of birth - Foreign born (%) - White
Place of birth - Foreign born (%) - Black or African American
Place of birth - Foreign born (%) - Asian
Place of birth - Foreign born (%) - Hispanic or Latino
Place of birth - Foreign born (%) - American Indian and Alaska Native
Place of birth - Foreign born (%) - Multirace
Place of birth - Foreign born (%) - Other Race
Residents speaking English at home (%)
Residents speaking English at home - Born in the United States (%)
Residents speaking English at home - Native, born elsewhere (%)
Residents speaking English at home - Foreign born (%)
Residents speaking Spanish at home (%)
Residents speaking Spanish at home - Born in the United States (%)
Residents speaking Spanish at home - Native, born elsewhere (%)
Residents speaking Spanish at home - Foreign born (%)
Residents speaking other language at home (%)
Residents speaking other language at home - Born in the United States (%)
Residents speaking other language at home - Native, born elsewhere (%)
Residents speaking other language at home - Foreign born (%)
Marital status - Never married (%)
Marital status - Now married (%)
Marital status - Separated (%)
Marital status - Widowed (%)
Marital status - Divorced (%)
Ancestries Reported - Arab (%)
Ancestries Reported - Czech (%)
Ancestries Reported - Danish (%)
Ancestries Reported - Dutch (%)
Ancestries Reported - English (%)
Ancestries Reported - French (%)
Ancestries Reported - French Canadian (%)
Ancestries Reported - German (%)
Ancestries Reported - Greek (%)
Ancestries Reported - Hungarian (%)
Ancestries Reported - Irish (%)
Ancestries Reported - Italian (%)
Ancestries Reported - Lithuanian (%)
Ancestries Reported - Norwegian (%)
Ancestries Reported - Polish (%)
Ancestries Reported - Portuguese (%)
Ancestries Reported - Russian (%)
Ancestries Reported - Scotch-Irish (%)
Ancestries Reported - Scottish (%)
Ancestries Reported - Slovak (%)
Ancestries Reported - Subsaharan African (%)
Ancestries Reported - Swedish (%)
Ancestries Reported - Swiss (%)
Ancestries Reported - Ukrainian (%)
Ancestries Reported - United States (%)
Ancestries Reported - Welsh (%)
Ancestries Reported - West Indian (%)
Ancestries Reported - Other (%)
Geographical mobility - Same house 1 year ago (%)
Geographical mobility - Same house 1 year ago (%) - White
Geographical mobility - Same house 1 year ago (%) - Black or African American
Geographical mobility - Same house 1 year ago (%) - Asian
Geographical mobility - Same house 1 year ago (%) - Hispanic or Latino
Geographical mobility - Same house 1 year ago (%) - American Indian and Alaska Native
Geographical mobility - Same house 1 year ago (%) - Multirace
Geographical mobility - Same house 1 year ago (%) - Other Race
Geographical mobility - Moved within same county (%)
Geographical mobility - Moved within same county (%) - White
Geographical mobility - Moved within same county (%) - Black or African American
Geographical mobility - Moved within same county (%) - Asian
Geographical mobility - Moved within same county (%) - Hispanic or Latino
Geographical mobility - Moved within same county (%) - American Indian and Alaska Native
Geographical mobility - Moved within same county (%) - Multirace
Geographical mobility - Moved within same county (%) - Other Race
Geographical mobility - Moved from different county within same state (%)
Geographical mobility - Moved from different county within same state (%) - White
Geographical mobility - Moved from different county within same state (%) - Black or African American
Geographical mobility - Moved from different county within same state (%) - Asian
Geographical mobility - Moved from different county within same state (%) - Hispanic or Latino
Geographical mobility - Moved from different county within same state (%) - American Indian and Alaska Native
Geographical mobility - Moved from different county within same state (%) - Multirace
Geographical mobility - Moved from different county within same state (%) - Other Race
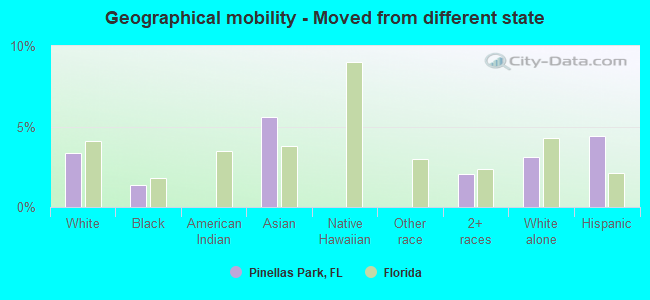
Geographical mobility - Moved from different state (%)
Geographical mobility - Moved from different state (%) - White
Geographical mobility - Moved from different state (%) - Black or African American
Geographical mobility - Moved from different state (%) - Asian
Geographical mobility - Moved from different state (%) - Hispanic or Latino
Geographical mobility - Moved from different state (%) - American Indian and Alaska Native
Geographical mobility - Moved from different state (%) - Multirace
Geographical mobility - Moved from different state (%) - Other Race
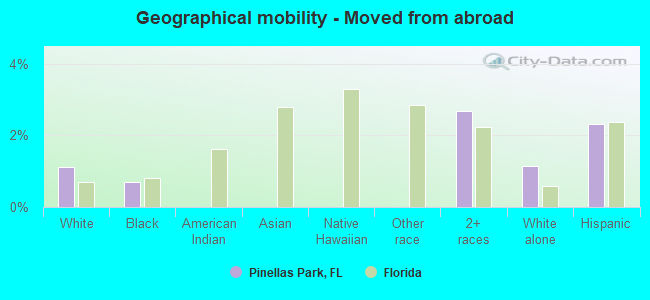
Geographical mobility - Moved from abroad (%)
Geographical mobility - Moved from abroad (%) - White
Geographical mobility - Moved from abroad (%) - Black or African American
Geographical mobility - Moved from abroad (%) - Asian
Geographical mobility - Moved from abroad (%) - Hispanic or Latino
Geographical mobility - Moved from abroad (%) - American Indian and Alaska Native
Geographical mobility - Moved from abroad (%) - Multirace
Geographical mobility - Moved from abroad (%) - Other Race
Place of birth for the foreign-born population - Ireland (%)
Place of birth for the foreign-born population - Denmark (%)
Place of birth for the foreign-born population - Norway (%)
Place of birth for the foreign-born population - Sweden (%)
Place of birth for the foreign-born population - United Kingdom (%)
Place of birth for the foreign-born population - England (%)
Place of birth for the foreign-born population - Scotland (%)
Place of birth for the foreign-born population - Other Northern Europe (%)
Place of birth for the foreign-born population - Austria (%)
Place of birth for the foreign-born population - Belgium (%)
Place of birth for the foreign-born population - France (%)
Place of birth for the foreign-born population - Germany (%)
Place of birth for the foreign-born population - Netherlands (%)
Place of birth for the foreign-born population - Switzerland (%)
Place of birth for the foreign-born population - Other Western Europe (%)
Place of birth for the foreign-born population - Greece (%)
Place of birth for the foreign-born population - Italy (%)
Place of birth for the foreign-born population - Portugal (%)
Place of birth for the foreign-born population - Spain (%)
Place of birth for the foreign-born population - Other Southern Europe (%)
Place of birth for the foreign-born population - Albania (%)
Place of birth for the foreign-born population - Belarus (%)
Place of birth for the foreign-born population - Bosnia and Herzegovina (%)
Place of birth for the foreign-born population - Bulgaria (%)
Place of birth for the foreign-born population - Croatia (%)
Place of birth for the foreign-born population - Czechoslovakia (%)
Place of birth for the foreign-born population - Hungary (%)
Place of birth for the foreign-born population - Latvia (%)
Place of birth for the foreign-born population - Lithuania (%)
Place of birth for the foreign-born population - North Macedonia (Macedonia) (%)
Place of birth for the foreign-born population - Moldova (%)
Place of birth for the foreign-born population - Poland (%)
Place of birth for the foreign-born population - Romania (%)
Place of birth for the foreign-born population - Russia (%)
Place of birth for the foreign-born population - Serbia (%)
Place of birth for the foreign-born population - Ukraine (%)
Place of birth for the foreign-born population - Other Eastern Europe (%)
Place of birth for the foreign-born population - China (%)
Place of birth for the foreign-born population - Hong Kong (%)
Place of birth for the foreign-born population - Taiwan (%)
Place of birth for the foreign-born population - Japan (%)
Place of birth for the foreign-born population - Korea (%)
Place of birth for the foreign-born population - Other Eastern Asia (%)
Place of birth for the foreign-born population - Afghanistan (%)
Place of birth for the foreign-born population - Bangladesh (%)
Place of birth for the foreign-born population - India (%)
Place of birth for the foreign-born population - Iran (%)
Place of birth for the foreign-born population - Kazakhstan (%)
Place of birth for the foreign-born population - Nepal (%)
Place of birth for the foreign-born population - Pakistan (%)
Place of birth for the foreign-born population - Sri Lanka (%)
Place of birth for the foreign-born population - Uzbekistan (%)
Place of birth for the foreign-born population - Other South Central Asia (%)
Place of birth for the foreign-born population - Burma (%)
Place of birth for the foreign-born population - Cambodia (%)
Place of birth for the foreign-born population - Indonesia (%)
Place of birth for the foreign-born population - Laos (%)
Place of birth for the foreign-born population - Malaysia (%)
Place of birth for the foreign-born population - Philippines (%)
Place of birth for the foreign-born population - Singapore (%)
Place of birth for the foreign-born population - Thailand (%)
Place of birth for the foreign-born population - Vietnam (%)
Place of birth for the foreign-born population - Other South Eastern Asia (%)
Place of birth for the foreign-born population - Armenia (%)
Place of birth for the foreign-born population - Iraq (%)
Place of birth for the foreign-born population - Israel (%)
Place of birth for the foreign-born population - Jordan (%)
Place of birth for the foreign-born population - Kuwait (%)
Place of birth for the foreign-born population - Lebanon (%)
Place of birth for the foreign-born population - Saudi Arabia (%)
Place of birth for the foreign-born population - Syria (%)
Place of birth for the foreign-born population - Turkey (%)
Place of birth for the foreign-born population - Yemen (%)
Place of birth for the foreign-born population - Other Western Asia (%)
Place of birth for the foreign-born population - Eritrea (%)
Place of birth for the foreign-born population - Ethiopia (%)
Place of birth for the foreign-born population - Kenya (%)
Place of birth for the foreign-born population - Somalia (%)
Place of birth for the foreign-born population - Uganda (%)
Place of birth for the foreign-born population - Zimbabwe (%)
Place of birth for the foreign-born population - Other Eastern Africa (%)
Place of birth for the foreign-born population - Cameroon (%)
Place of birth for the foreign-born population - Congo (%)
Place of birth for the foreign-born population - Democratic Republic of Congo (Zaire) (%)
Place of birth for the foreign-born population - Other Middle Africa (%)
Place of birth for the foreign-born population - Egypt (%)
Place of birth for the foreign-born population - Morocco (%)
Place of birth for the foreign-born population - Sudan (%)
Place of birth for the foreign-born population - Other Northern Africa (%)
Place of birth for the foreign-born population - South Africa (%)
Place of birth for the foreign-born population - Other Southern Africa (%)
Place of birth for the foreign-born population - Cabo Verde (%)
Place of birth for the foreign-born population - Ghana (%)
Place of birth for the foreign-born population - Liberia (%)
Place of birth for the foreign-born population - Nigeria (%)
Place of birth for the foreign-born population - Senegal (%)
Place of birth for the foreign-born population - Sierra Leone (%)
Place of birth for the foreign-born population - Other Western Africa (%)
Place of birth for the foreign-born population - Australia (%)
Place of birth for the foreign-born population - New Zealand (%)
Place of birth for the foreign-born population - Fiji (%)
Place of birth for the foreign-born population - Micronesia (%)
Place of birth for the foreign-born population - Bahamas (%)
Place of birth for the foreign-born population - Barbados (%)
Place of birth for the foreign-born population - Cuba (%)
Place of birth for the foreign-born population - Dominica (%)
Place of birth for the foreign-born population - Dominican Republic (%)
Place of birth for the foreign-born population - Grenada (%)
Place of birth for the foreign-born population - Haiti (%)
Place of birth for the foreign-born population - Jamaica (%)
Place of birth for the foreign-born population - St. Vincent and the Grenadines (%)
Place of birth for the foreign-born population - Trinidad and Tobago (%)
Place of birth for the foreign-born population - West Indies (%)
Place of birth for the foreign-born population - Other Caribbean (%)
Place of birth for the foreign-born population - Belize (%)
Place of birth for the foreign-born population - Costa Rica (%)
Place of birth for the foreign-born population - El Salvador (%)
Place of birth for the foreign-born population - Guatemala (%)
Place of birth for the foreign-born population - Honduras (%)
Place of birth for the foreign-born population - Mexico (%)
Place of birth for the foreign-born population - Nicaragua (%)
Place of birth for the foreign-born population - Panama (%)
Place of birth for the foreign-born population - Other Central America (%)
Place of birth for the foreign-born population - Argentina (%)
Place of birth for the foreign-born population - Bolivia (%)
Place of birth for the foreign-born population - Brazil (%)
Place of birth for the foreign-born population - Chile (%)
Place of birth for the foreign-born population - Colombia (%)
Place of birth for the foreign-born population - Ecuador (%)
Place of birth for the foreign-born population - Guyana (%)
Place of birth for the foreign-born population - Peru (%)
Place of birth for the foreign-born population - Uruguay (%)
Place of birth for the foreign-born population - Venezuela (%)
Place of birth for the foreign-born population - Other South America (%)
Place of birth for the foreign-born population - Canada (%)
Place of birth for the foreign-born population - Other Northern America (%)
Place of birth for the foreign-born population - Other (%)
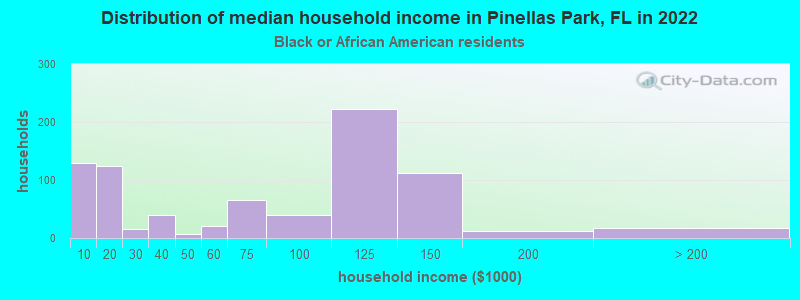
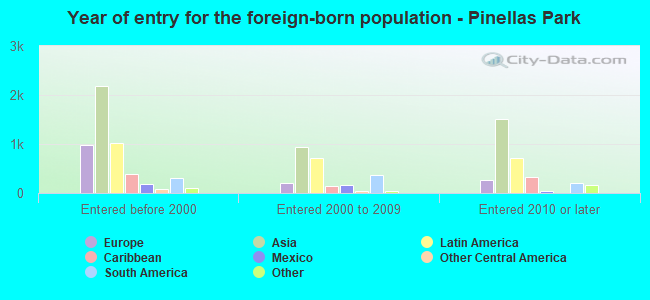
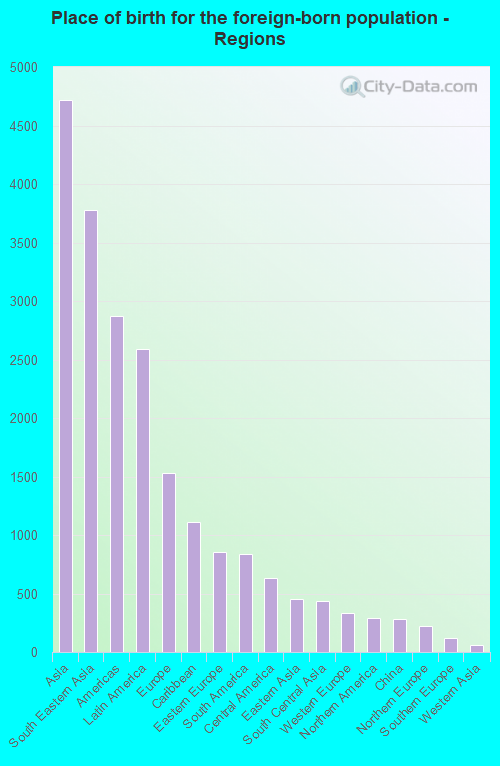
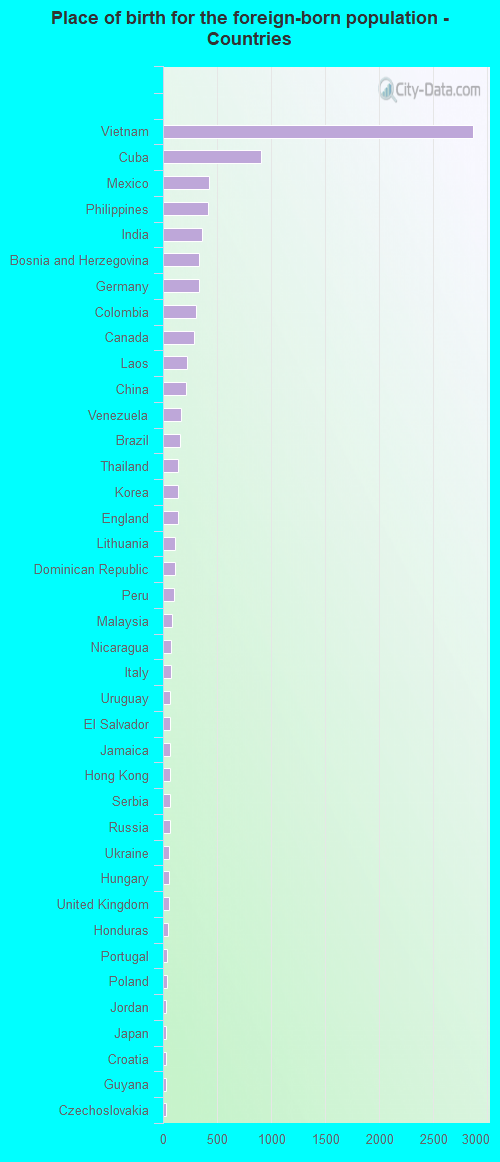
According to 2022 data, the most numerous races in Pinellas Park, FL are White alone (34,438 residents), Hispanic (7,543 residents), and Black alone (2,957 residents). 75.3% of Pinellas Park residents speak English at home. 17.1% of Pinellas Park, FL residents are foreign-born (8.4% born in Asia, 4.6% born in Latin America, 2.7% born in Europe), which is 22.9% less than the foreign-born rate of 21.0% across the entire state of Florida.
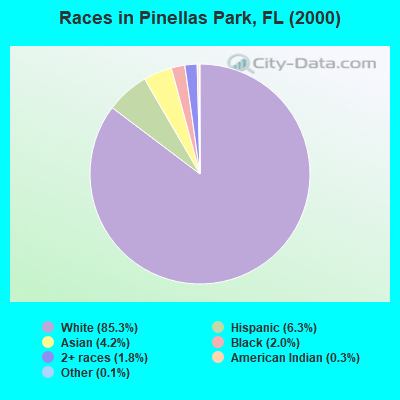
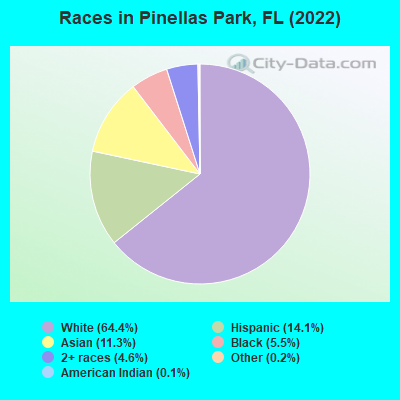
Race distribution in Pinellas Park
2000 2022
10,458,509 65.4% White alone 2,682,715 16.8% Hispanic 2,264,268 14.2% Black alone 261,693 1.6% Asian alone 236,954 1.5% Two or more races 42,358 0.3% American Indian alone 28,994 0.2% Other race alone 6,887 0.04% Native Hawaiian and Other
11,309,403 50.8% White alone 6,025,039 27.1% Hispanic 3,241,015 14.6% Black alone 861,630 3.9% Two or more races 623,692 2.8% Asian alone 152,054 0.7% Other race alone 22,504 0.1% American Indian alone 9,486 0.04% Native Hawaiian and Other
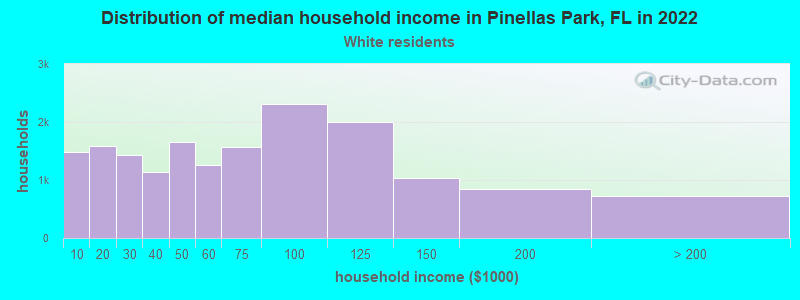
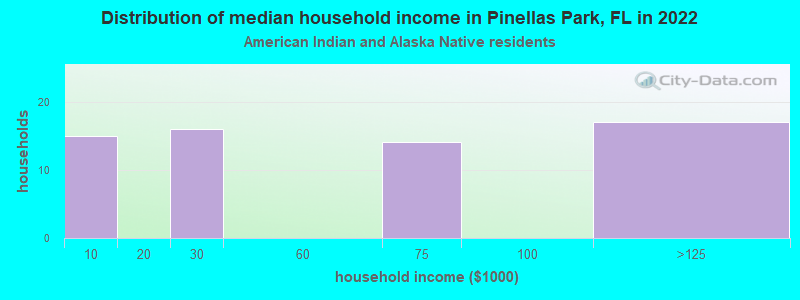
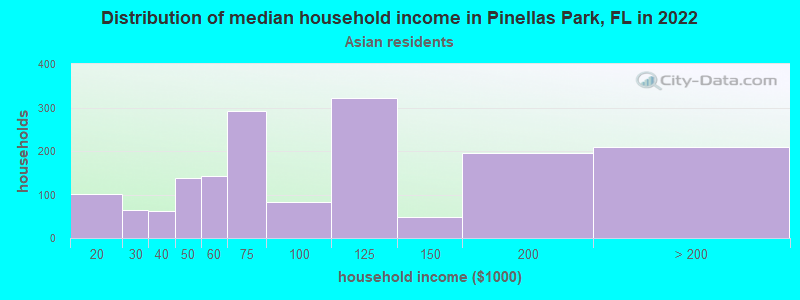
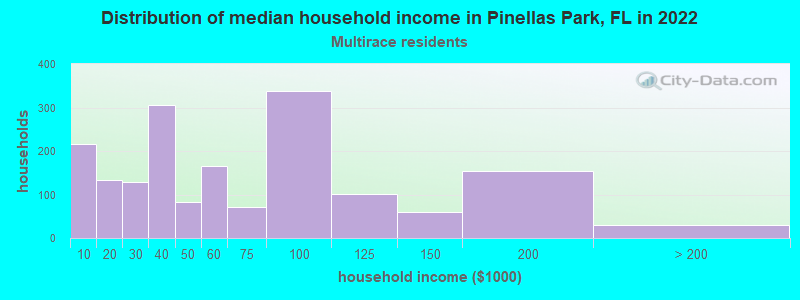
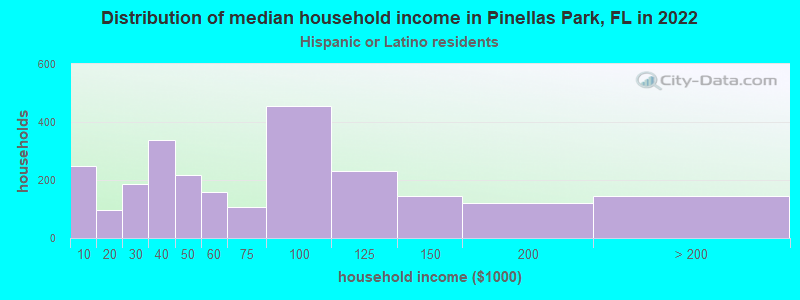
Income and house value in Pinellas Park Median household income in 2022 $59,506 White non-Hispanic householders$71,191 Black householders$89,741 Asian householders$55,473 Some other race householders$53,562 Two or more races householders$65,337 Hispanic or Latino race householdersMedian 2022 house value $308,651 White Non-Hispanic householders$360,093 Black or African American householders$273,670 American Indian or Alaska Native householders $320,585 Asian householders$344,866 Some other race householders$315,647 Two or more races householders$340,339 Hispanic or Latino householders
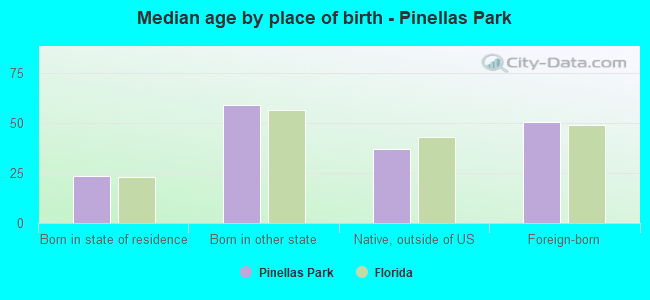
Median age by race in Pinellas Park
50.3 Median age for White residents46.5 54.3 32.8 Median age for Black or African American residents32.7 28.1 10.7 Median age for American Indian / Alaska Native residents18.2 10.0 44.1 Median age for Asian residents46.4 42.8 36.5 Median age for Native Hawaiian / Pacific Islander residents-663,446,054.1 -373,522,458.3 32.3 Median age for Other race residents27.7 44.0 35.9 Median age for Two or more races residents35.4 36.6 52.4 Median age for White alone residents49.3 55.4 35.0 Median age for Hispanic or Latino residents33.3 35.5
Owner/renter occupied households by race in Pinellas Park
House owners and renters - White residents 12,226 71.6% Owner occupied4,857 28.4% Renter occupiedHouse owners and renters - Black or African American residents 383 53.4% Owner occupied334 46.6% Renter occupiedHouse owners and renters - American Indian / Alaska Native residents 34 63.7% Owner occupied19 36.3% Renter occupiedHouse owners and renters - Asian residents 1,433 87.9% Owner occupied197 12.1% Renter occupiedHouse owners and renters - Native Hawaiian / Pacific Islander residents 5 11.8% Owner occupied35 88.2% Renter occupiedHouse owners and renters - Other race residents 144 27.6% Owner occupied378 72.4% Renter occupiedHouse owners and renters - Two or more races residents 938 52.0% Owner occupied866 48.0% Renter occupiedHouse owners and renters - White alone residents 11,726 72.6% Owner occupied4,436 27.4% Renter occupiedHouse owners and renters - Hispanic or Latino residents 1,128 48.0% Owner occupied1,219 52.0% Renter occupied
Language usage in Pinellas Park
English speakers - Total 75.3% of residents of Pinellas Park speak English at home.
10.4% of residents speak Spanish at home 3,011 55.6% Speak English very well2,400 44.4% Speak English less than very well14.8% of residents speak other language at home 3,423 44.5% Speak English very well4,264 55.5% Speak English less than very well
English speakers - Born in the United States 93.4% of residents of Pinellas Park speak English at home.
3.4% of residents speak Spanish at home 730 91.4% Speak English very well69 8.6% Speak English less than very well3.5% of residents speak other language at home 408 49.6% Speak English very well414 50.4% Speak English less than very well
English speakers - Native, born elsewhere 35.4% of residents of Pinellas Park speak English at home.
59.5% of residents speak Spanish at home 537 64.7% Speak English very well293 35.3% Speak English less than very well4.9% of residents speak other language at home 59 86.8% Speak English very well9 13.2% Speak English less than very well
English speakers - Foreign-born 14.8% of residents of Pinellas Park speak English at home.
24.8% of residents speak Spanish at home 622 27.9% Speak English very well1,606 72.1% Speak English less than very well63.1% of residents speak other language at home 1,845 32.6% Speak English very well3,817 67.4% Speak English less than very well
White (Caucasian) - Speak only English Native:
92.9% (31,522)Foreign-born:
24.9% (631)
White (Caucasian) - Speak another language Native:
6.3% (2,125)Foreign-born:
74.8% (1,891)
Black or African American - Speak only English Native:
100.0% (2,753)Foreign-born:
100.0% (64)
Asian - Speak only English Native:
31.5% (515)Foreign-born:
9.2% (390)
Asian - Speak another language Native:
69.6% (1,139)Foreign-born:
90.6% (3,835)
Other race - Speak only English Native:
26.1% (211)Foreign-born:
6.8% (58)
Other race - Speak another language Native:
73.5% (596)Foreign-born:
94.7% (806)
Two or more races - Speak only English Native:
69.2% (2,753)Foreign-born:
17.8% (241)
Two or more races - Speak another language Native:
30.6% (1,216)Foreign-born:
82.3% (1,114)
White alone - Speak only English Native:
97.1% (30,650)Foreign-born:
31.4% (654)
White alone - Speak another language Native:
2.9% (902)Foreign-born:
69.6% (1,449)
Hispanic or Latino - Speak only English Native:
38.1% (1,945)Foreign-born:
5.6% (126)
Hispanic or Latino - Speak another language Native:
62.7% (3,200)Foreign-born:
95.4% (2,142)
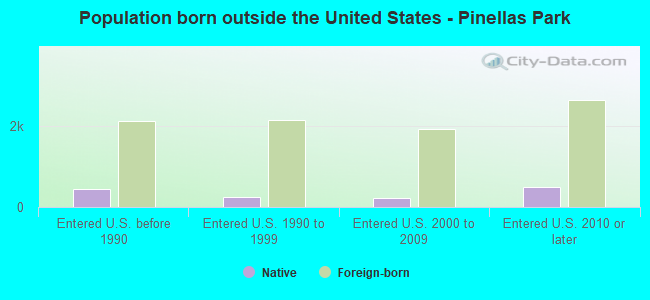
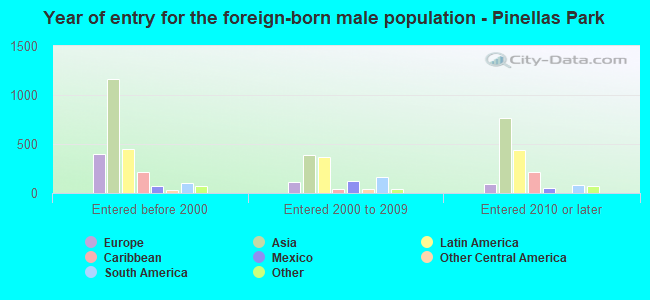
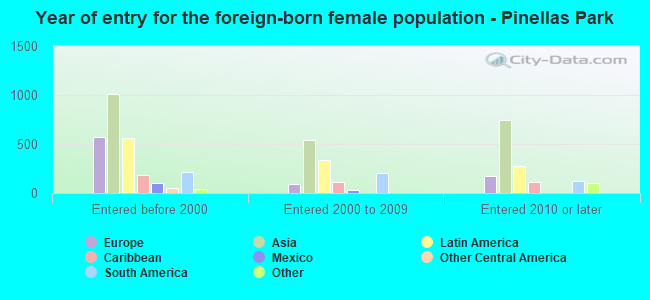
Foreign-born residents in Pinellas Park 9,136 residents are foreign born (8.4% Asia , 4.6% Latin America , 2.7% Europe ).
This city:
17.1%Florida:
21.1%
Marital status for residents in Pinellas Park Marital status - White (Caucasian) population 15 years and over
Males 30.0% Never married45.7% Now married1.3% Separated4.4% Widowed18.6% DivorcedFemales 22.4% Never married42.3% Now married2.4% Separated15.7% Widowed17.3% DivorcedWomen who gave birth in the past 12 months Now married:
51.9% (183)Unmarried:
48.1% (170)
Women who did not give birth in the past 12 months Now married:
47.2% (3,189)Unmarried:
52.8% (3,567)
Marital status - Black or African American population 15 years and over
Males 56.4% Never married30.3% Now married1.2% Separated1.2% Widowed10.9% DivorcedFemales 50.0% Never married21.8% Now married1.4% Separated15.1% Widowed11.8% DivorcedWomen who gave birth in the past 12 months Now married:
87.4% (103)Unmarried:
12.6% (15)
Women who did not give birth in the past 12 months Now married:
9.0% (53)Unmarried:
91.0% (535)
Marital status - American Indian / Alaska Native population 15 years and over
Males 58.9% Never married26.8% Now married0.0% Separated0.0% Widowed14.3% DivorcedFemales 58.6% Never married41.4% Now married0.0% Separated0.0% Widowed0.0% DivorcedWomen who did not give birth in the past 12 months Now married:
41.4% (20)Unmarried:
58.6% (28)
Marital status - Asian population 15 years and over
Males 28.8% Never married51.0% Now married2.1% Separated6.6% Widowed11.6% DivorcedFemales 14.8% Never married55.8% Now married2.0% Separated11.6% Widowed15.8% DivorcedWomen who gave birth in the past 12 months Now married:
100.0% (25)Unmarried:
0.0% (0)
Women who did not give birth in the past 12 months Now married:
56.7% (801)Unmarried:
43.3% (610)
Marital status - Native Hawaiian / Pacific Islander population 15 years and over
Males 0.0% Never married0.0% Now married0.0% Separated0.0% Widowed100.0% DivorcedFemales 0.0% Never married60.0% Now married0.0% Separated0.0% Widowed40.0% DivorcedMarital status - Other race population 15 years and over
Males 48.3% Never married44.3% Now married1.2% Separated4.8% Widowed1.4% DivorcedFemales 26.2% Never married60.8% Now married0.0% Separated0.0% Widowed13.0% DivorcedWomen who gave birth in the past 12 months Now married:
100.0% (38)Unmarried:
0.0% (0)
Women who did not give birth in the past 12 months Now married:
48.6% (176)Unmarried:
51.4% (186)
Marital status - Two or more races population 15 years and over
Males 46.1% Never married45.7% Now married0.5% Separated1.2% Widowed6.5% DivorcedFemales 46.9% Never married33.2% Now married4.2% Separated5.3% Widowed10.4% DivorcedWomen who gave birth in the past 12 months Now married:
0.0% (0)Unmarried:
100.0% (123)
Women who did not give birth in the past 12 months Now married:
32.3% (477)Unmarried:
67.7% (999)
Marital status - White alone, not Hispanic / Latino population 15 years and over
Males 29.5% Never married46.6% Now married1.4% Separated4.3% Widowed18.2% DivorcedFemales 20.4% Never married42.6% Now married2.5% Separated16.3% Widowed18.2% DivorcedWomen who gave birth in the past 12 months Now married:
41.3% (125)Unmarried:
58.7% (178)
Women who did not give birth in the past 12 months Now married:
48.7% (2,877)Unmarried:
51.3% (3,035)
Marital status - Hispanic or Latino population 15 years and over
Males 39.4% Never married44.3% Now married0.3% Separated3.6% Widowed12.4% DivorcedFemales 36.9% Never married43.6% Now married2.3% Separated7.2% Widowed9.9% DivorcedWomen who gave birth in the past 12 months Now married:
77.0% (100)Unmarried:
23.0% (30)
Women who did not give birth in the past 12 months Now married:
43.5% (930)Unmarried:
56.5% (1,207)
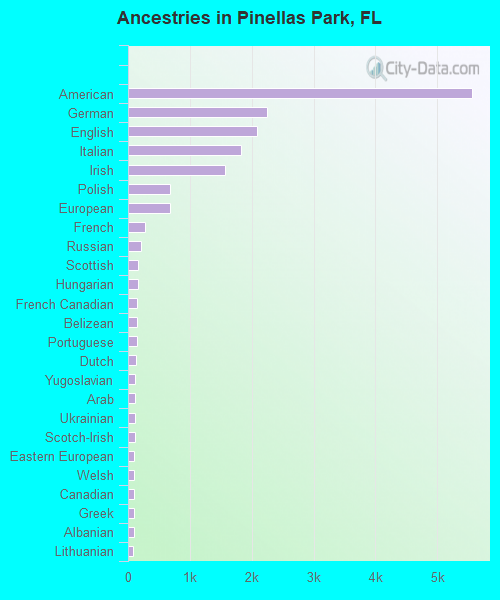
Ancestries in Pinellas Park
5,557 19.1% American2,242 7.7% German2,088 7.2% English1,822 6.3% Italian1,571 5.4% Irish682 2.3% Polish680 2.3% European278 1.0% French204 0.7% Russian162 0.6% Scottish159 0.5% Hungarian146 0.5% French Canadian146 0.5% Belizean143 0.5% Portuguese129 0.4% Dutch118 0.4% Yugoslavian109 0.4% Arab108 0.4% Ukrainian107 0.4% Scotch-Irish104 0.4% Eastern European95 0.3% Welsh93 0.3% Canadian93 0.3% Greek92 0.3% Albanian80 0.3% Lithuanian60 0.2% Swedish56 0.2% Serbian44 0.2% Finnish39 0.1% Iranian38 0.1% Brazilian35 0.1% Slovak34 0.1% Northern European33 0.1% Czech32 0.1% Norwegian31 0.1% Palestinian27 0.09% Romanian21 0.07% Trinidadian and Tobagonian19 0.07% Bulgarian18 0.06% Jamaican17 0.06% Croatian15 0.05% British15 0.05% Australian11 0.04% Swiss10 0.03% Syrian10 0.03% Slovene10 0.03% Danish10 0.03% Austrian5 0.02% Turkish
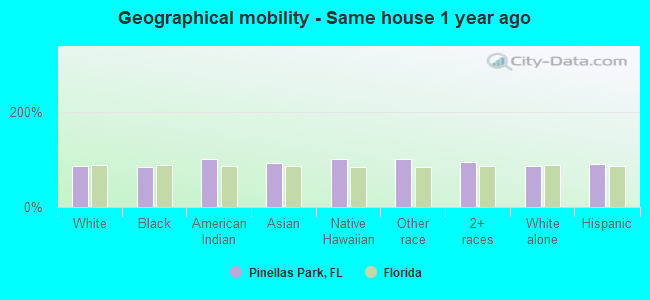
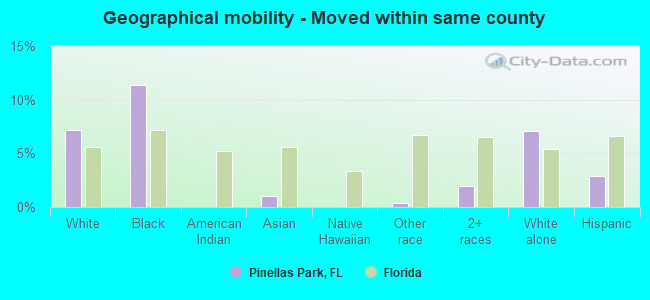
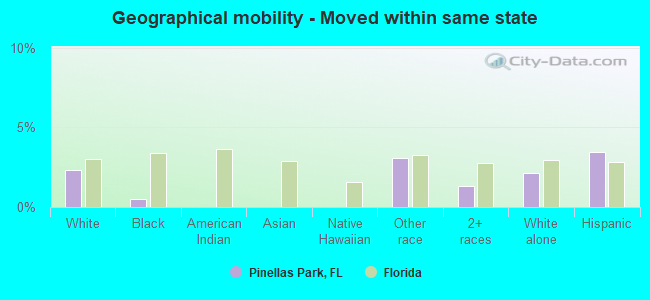
Geographical mobility in Pinellas Park Same house 1 year ago 31,695 85.6% White (Caucasian)2,451 84.1% Black or African American163 100.0% American Indian / Alaska Native5,593 91.8% Asian42 100.0% Native Hawaiian / Pacific Islander1,748 100.0% Other race5,445 94.5% Two or more races29,488 86.0% White alone, not Hispanic / Latino6,752 89.8% Hispanic or LatinoMoved within same county 2,658 7.2% White / Caucasian332 11.4% Black or African American64 1.0% Asian7 0.4% Other race112 2.0% Two or more races2,436 7.1% White alone, not Hispanic / Latino217 2.9% Hispanic or LatinoMoved within same state 858 2.3% White / Caucasian15 0.5% Black or African American52 3.1% Other race76 1.3% Two or more races734 2.1% White alone, not Hispanic / Latino260 3.5% Hispanic or LatinoMoved from different state 1,249 3.4% White / Caucasian40 1.4% Black or African American340 5.6% Asian119 2.1% Two or more races1,063 3.1% White alone, not Hispanic / Latino330 4.4% Hispanic or LatinoMoved from abroad 416 1.1% White20 0.7% Black or African American155 2.7% Two or more races391 1.1% White alone, not Hispanic / Latino174 2.3% Hispanic or Latino
Children Nativity (place of birth) in Pinellas Park
Children under 6 years - Living with two parents Both parents native 710 100.0% NativeBoth parents foreign-born 159 76.2% Native50 23.8% Foreign-bornOne native, one foreign-born parent 159 100.0% NativeChildren under 6 years - Living with one parent Native parent 757 100.0% NativeForeign-born parent 87 100.0% NativeChildren 6 to 17 years - Living with two parents Both parents native 3,080 100.0% NativeBoth parents foreign-born 570 67.9% Native270 32.1% Foreign-bornOne native, one foreign-born parent 863 100.0% NativeChildren 6 to 17 years - Living with one parent Native parent 1,380 100.0% NativeForeign-born parent 461 53.3% Native405 46.7% Foreign-born
Grandparents responsible for own grandchildren in Pinellas Park
Grandparents (30 to 59 years) White / Caucasian 44 23.4% Responsible for grandchildren144 76.6% Not responsible for grandchildrenBlack or African American 8 100.0% Responsible for grandchildrenAsian 49 100.0% Not responsible for grandchildrenWhite alone, not Hispanic / Latino 52 33.7% Responsible for grandchildren102 66.3% Not responsible for grandchildrenHispanic or Latino 85 100.0% Not responsible for grandchildrenGrandparents (60 years and over) White / Caucasian 158 36.5% Responsible for grandchildren275 63.5% Not responsible for grandchildrenAsian 196 100.0% Not responsible for grandchildrenWhite alone, not Hispanic / Latino 152 36.9% Responsible for grandchildren261 63.1% Not responsible for grandchildrenHispanic or Latino 24 15.4% Responsible for grandchildren134 84.6% Not responsible for grandchildren