Races in Pismo Beach, California (CA) Detailed Stats
Ancestries, Foreign-born residents, place of birth
Settings
X


Recent posts about races in Pismo Beach, California on our local forum with over 2,400,000 registered users:
 | Asian family moving away from Bay Area (77 replies) |
| San Joaquin Valley Gentrification thread(Fresno, Merced, Stockton, Bakersfield) (340 replies) |
| Summer Trip 2024-And Questions (18 replies) |
| Prop 13 (megatopic) (1358 replies) |
| Santa Barbara vs other Central California Beach Towns (18 replies) |
| Nurse looking to try out a new area for a year (13 replies) |
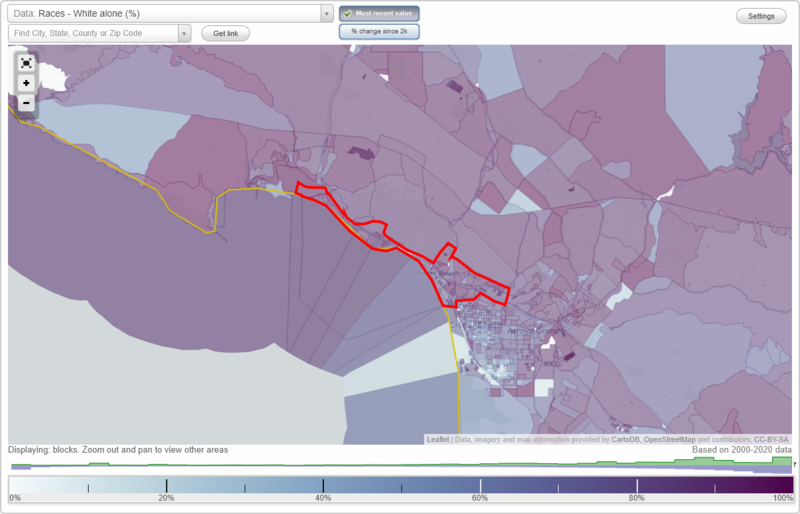
According to 2022 data, the most numerous races in Pismo Beach, CA are Hispanic (1,030 residents), White alone (6,141 residents), and Asian alone (154 residents). 90.1% of Pismo Beach residents speak English at home. 7.7% of Pismo Beach, CA residents are foreign-born (2.5% born in Asia, 2.3% born in Europe, 2.0% born in Latin America), which is 236.7% less than the foreign-born rate of 26.0% across the entire state of California.
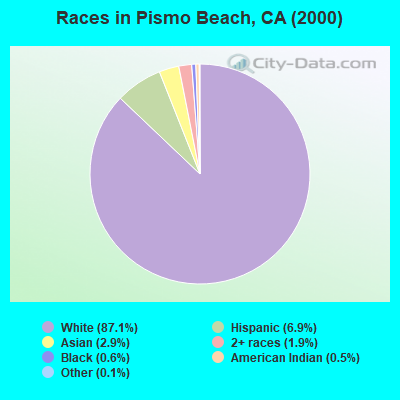
Race distribution in Pismo Beach
2000
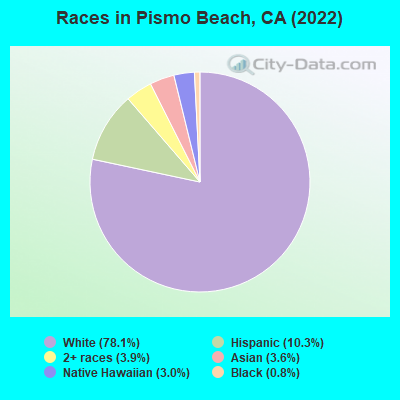
2022

- 7,44987.1%White alone
- 5896.9%Hispanic
- 2442.9%Asian alone
- 1631.9%Two or more races
- 490.6%Black alone
- 410.5%American Indian alone
- 110.1%Other race alone
- 50.06%Native Hawaiian and Other
Pacific Islander alone
-
- 6,14174.5%White alone
- 1,03012.5%Hispanic
- 2553.1%Two or more races
- 2222.7%Black alone
- 1541.9%Asian alone
- 220.3%American Indian alone
2000
2022
-
- 15,816,79046.7%White alone
- 10,966,55632.4%Hispanic
- 3,648,86010.8%Asian alone
- 2,181,9266.4%Black alone
- 903,1152.7%Two or more races
- 178,9840.5%American Indian alone
- 103,7360.3%Native Hawaiian and Other
Pacific Islander alone - 71,6810.2%Other race alone

-
- 15,732,18440.3%Hispanic
- 13,160,42633.7%White alone
- 5,957,86715.3%Asian alone
- 2,025,2185.2%Black alone
- 1,663,2224.3%Two or more races
- 251,6180.6%Other race alone
- 135,7770.3%Native Hawaiian and Other
Pacific Islander alone - 103,0300.3%American Indian alone

Income and house value in Pismo Beach
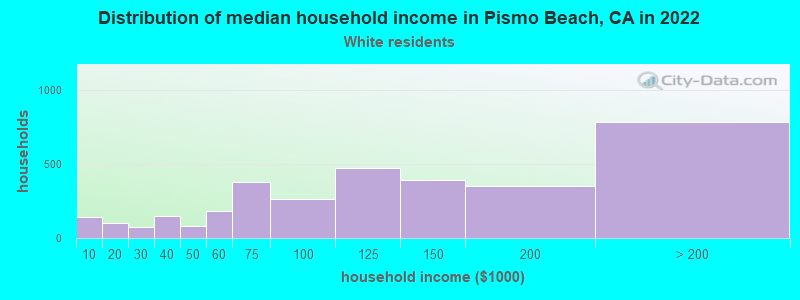
- Median household income in 2022
- $100,764White non-Hispanic householders
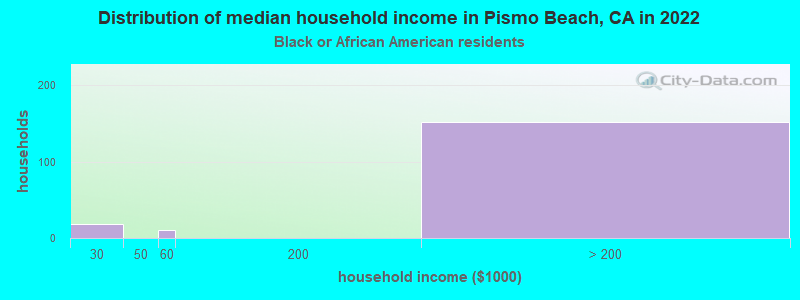
- over $200,000Black householders
- $56,426American Indian and Alaska Native householders
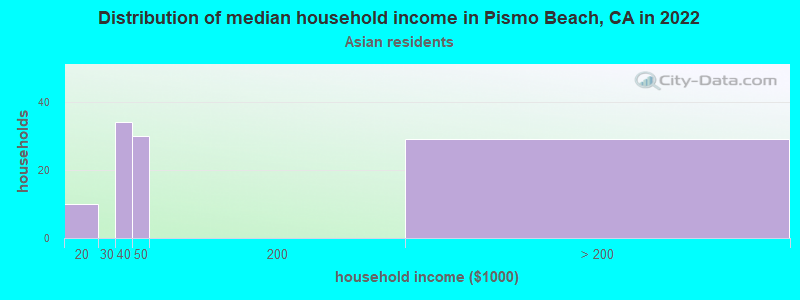
- $22,028Asian householders
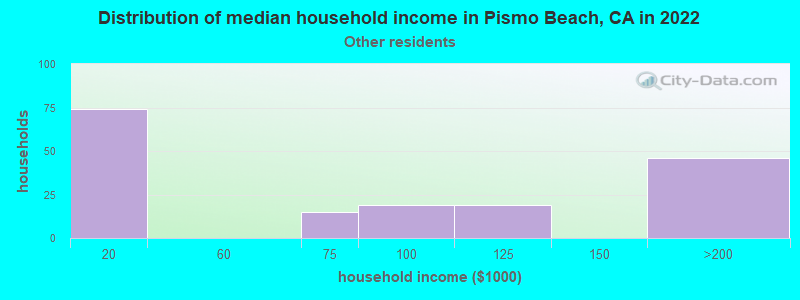
- $128,848Some other race householders
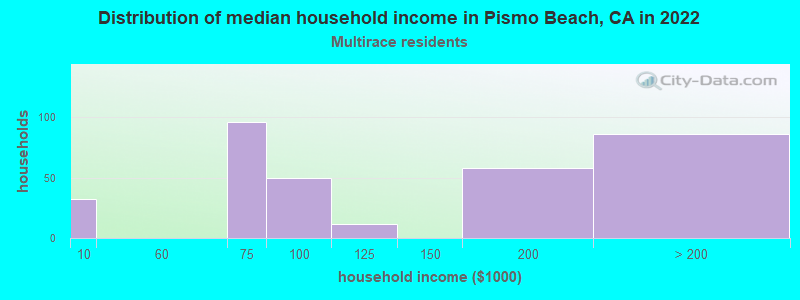
- $103,961Two or more races householders
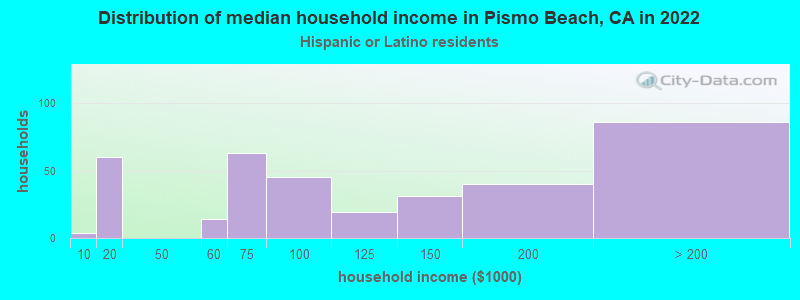
- $93,085Hispanic or Latino race householders
- Median 2022 house value
- over $1,000,000White Non-Hispanic householders
- $674,868American Indian or Alaska Native householders
- over $1,000,000Asian householders
- over $1,000,000Two or more races householders
- over $1,000,000Hispanic or Latino householders
Household income for White non-Hispanic householders
Household income for Black householders
Household income for Asian householders
Household income for Some other race householders
Household income for Two or more races householders
Household income for Hispanic or Latino race householders
Median age by race in Pismo Beach
- 62.7Median age for White residents
- 62.4Males
- 62.2Females
- 27.6Median age for Black or African American residents
- 18.5Median age for American Indian / Alaska Native residents
- 79.9Males
- 14.8Females
- 64.8Median age for Asian residents
- 81.1Males
- 51.2Females
- 35.9Median age for Other race residents
- 34.3Males
- 59.0Females
- 32.7Median age for Two or more races residents
- 45.0Males
- 21.8Females
- 61.2Median age for White alone residents
- 61.3Males
- 61.8Females
- 34.4Median age for Hispanic or Latino residents
- 30.4Males
- 47.2Females
Owner/renter occupied households by race in Pismo Beach
- House owners and renters - White residents
- 2,27766.4%Owner occupied
- 1,15333.6%Renter occupied
- House owners and renters - Black or African American residents
- 4239.1%Owner occupied
- 6660.9%Renter occupied
- House owners and renters - Asian residents
- 62100.0%Owner occupied
- House owners and renters - Other race residents
- 5763.3%Owner occupied
- 3336.7%Renter occupied
- House owners and renters - Two or more races residents
- 5124.0%Owner occupied
- 16176.0%Renter occupied
- House owners and renters - White alone residents
- 2,37968.1%Owner occupied
- 1,11631.9%Renter occupied
- House owners and renters - Hispanic or Latino residents
- 13035.5%Owner occupied
- 23764.5%Renter occupied
Language usage in Pismo Beach
- English speakers - Total
- 90.1% of residents of Pismo Beach speak English at home.
- 6.0% of residents speak Spanish at home
- 41786.5%Speak English very well
- 6513.5%Speak English less than very well
- 4.4% of residents speak other language at home
- 26575.3%Speak English very well
- 8724.7%Speak English less than very well
- English speakers - Born in the United States
- 97.9% of residents of Pismo Beach speak English at home.
- 0.7% of residents speak Spanish at home
- 18100.0%Speak English very well
- 1.1% of residents speak other language at home
- 27100.0%Speak English very well
- English speakers - Native, born elsewhere
- 60.5% of residents of Pismo Beach speak English at home.
- 40.8% of residents speak Spanish at home
- 64100.0%Speak English very well
- English speakers - Foreign-born
- 40.2% of residents of Pismo Beach speak English at home.
- 13.9% of residents speak Spanish at home
- 3341.8%Speak English very well
- 4658.2%Speak English less than very well
- 50.1% of residents speak other language at home
- 20772.9%Speak English very well
- 7727.1%Speak English less than very well
White (Caucasian) - Speak only English
| Native: | 100.0% (5,751) |
| Foreign-born: | 50.8% (131) |
White (Caucasian) - Speak another language
| Native: | 4.3% (246) |
| Foreign-born: | 58.6% (151) |
Asian - Speak only English
| Native: | 100.0% (46) |
| Foreign-born: | 38.2% (45) |
Other race - Speak another language
| Native: | 47.1% (121) |
| Foreign-born: | 99.7% (27) |
White alone - Speak only English
| Native: | 97.9% (5,571) |
| Foreign-born: | 29.7% (119) |
White alone - Speak another language
| Native: | 1.4% (80) |
| Foreign-born: | 75.9% (304) |
Hispanic or Latino - Speak only English
| Native: | 57.8% (552) |
| Foreign-born: | 45.9% (28) |
Hispanic or Latino - Speak another language
| Native: | 42.2% (403) |
| Foreign-born: | 64.4% (39) |
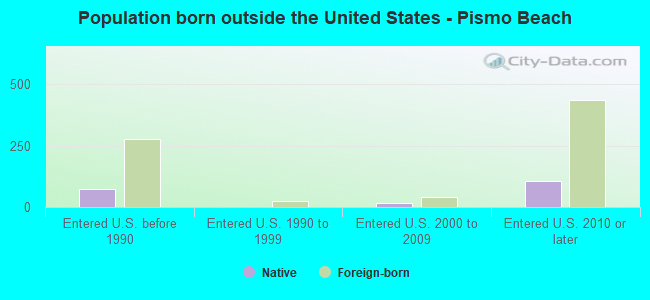
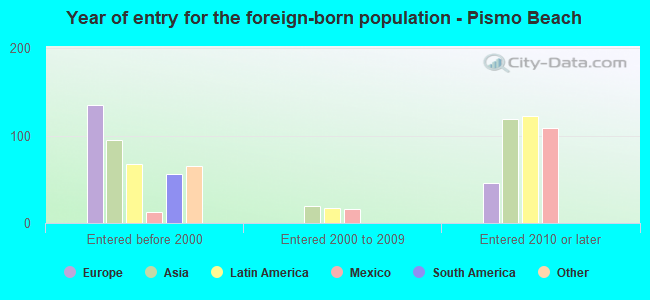
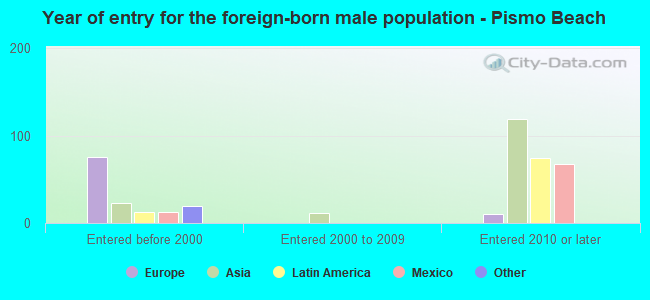
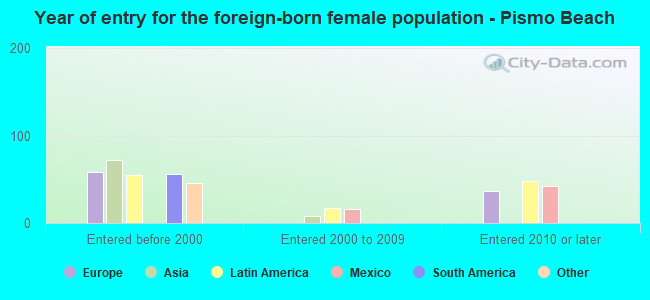
Foreign-born residents in Pismo Beach
635 residents are foreign born (2.5% Asia, 2.3% Europe, 2.0% Latin America).
| This city: | 7.7% |
| California: | 100.0% |

Marital status for residents in Pismo Beach
Marital status - White (Caucasian) population 15 years and over
- Males
- 28.5%Never married
- 58.9%Now married
- 0.9%Separated
- 4.1%Widowed
- 7.6%Divorced
- Females
- 23.7%Never married
- 46.0%Now married
- 0.0%Separated
- 12.7%Widowed
- 17.5%Divorced
Women who gave birth in the past 12 months
| Now married: | 100.0% (21) |
| Unmarried: | 0.0% (0) |
Women who did not give birth in the past 12 months
| Now married: | 31.4% (262) |
| Unmarried: | 68.6% (572) |
Marital status - Black or African American population 15 years and over
- Males
- 64.2%Never married
- 18.3%Now married
- 17.4%Separated
- 0.0%Widowed
- 0.0%Divorced
- Females
- 100.0%Never married
- 0.0%Now married
- 0.0%Separated
- 0.0%Widowed
- 0.0%Divorced
Women who did not give birth in the past 12 months
| Now married: | 0.0% (0) |
| Unmarried: | 100.0% (10) |
Marital status - Asian population 15 years and over
- Males
- 47.9%Never married
- 52.1%Now married
- 0.0%Separated
- 0.0%Widowed
- 0.0%Divorced
- Females
- 20.0%Never married
- 63.2%Now married
- 0.0%Separated
- 16.8%Widowed
- 0.0%Divorced
Women who did not give birth in the past 12 months
| Now married: | 67.8% (41) |
| Unmarried: | 32.2% (20) |
Marital status - Other race population 15 years and over
- Males
- 59.5%Never married
- 29.8%Now married
- 0.0%Separated
- 0.0%Widowed
- 10.7%Divorced
- Females
- 36.0%Never married
- 15.2%Now married
- 0.0%Separated
- 0.0%Widowed
- 48.8%Divorced
Women who did not give birth in the past 12 months
| Now married: | 29.7% (21) |
| Unmarried: | 70.3% (51) |
Marital status - Two or more races population 15 years and over
- Males
- 40.0%Never married
- 15.2%Now married
- 0.0%Separated
- 0.0%Widowed
- 44.8%Divorced
- Females
- 100.0%Never married
- 0.0%Now married
- 0.0%Separated
- 0.0%Widowed
- 0.0%Divorced
Women who did not give birth in the past 12 months
| Now married: | 0.0% (0) |
| Unmarried: | 100.0% (68) |
Marital status - White alone, not Hispanic / Latino population 15 years and over
- Males
- 24.4%Never married
- 62.2%Now married
- 1.0%Separated
- 4.0%Widowed
- 8.4%Divorced
- Females
- 21.7%Never married
- 46.8%Now married
- 0.0%Separated
- 12.2%Widowed
- 19.3%Divorced
Women who gave birth in the past 12 months
| Now married: | 100.0% (24) |
| Unmarried: | 0.0% (0) |
Women who did not give birth in the past 12 months
| Now married: | 34.0% (275) |
| Unmarried: | 66.0% (534) |
Marital status - Hispanic or Latino population 15 years and over
- Males
- 64.5%Never married
- 28.3%Now married
- 0.0%Separated
- 3.8%Widowed
- 3.3%Divorced
- Females
- 42.6%Never married
- 31.8%Now married
- 0.0%Separated
- 12.7%Widowed
- 12.9%Divorced
Women who did not give birth in the past 12 months
| Now married: | 20.2% (50) |
| Unmarried: | 79.8% (198) |
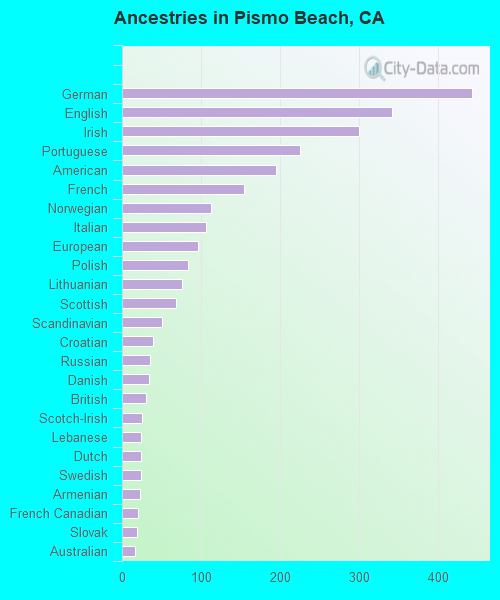
Ancestries in Pismo Beach

- 37910.7%American
- 2958.4%German
- 2757.8%European
- 2587.3%English
- 2095.9%Italian
- 1704.8%Portuguese
- 1444.1%Irish
- 882.5%Scottish
- 852.4%Norwegian
- 471.3%French Canadian
- 411.2%British
- 280.8%Greek
- 280.8%Slovak
- 250.7%Swedish
- 230.7%Lebanese
- 230.7%Polish
- 220.6%Scandinavian
- 210.6%Lithuanian
- 150.4%Danish
- 150.4%Russian
- 130.4%Austrian
- 100.3%Iranian
- 80.2%Armenian
- 80.2%Australian
- 70.2%Assyrian
- 70.2%Belgian
- 70.2%Croatian
- 60.2%Scotch-Irish
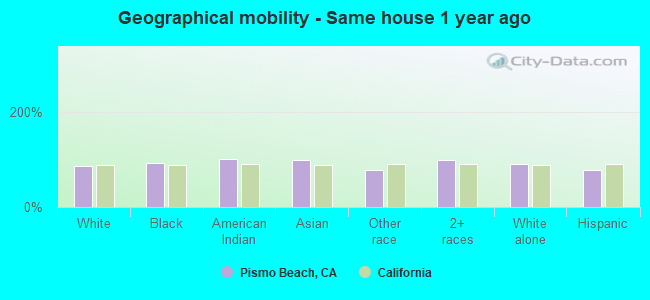
Geographical mobility in Pismo Beach

- Same house 1 year ago
- 5,04286.3%White (Caucasian)
- 20893.2%Black or African American
- 37100.0%American Indian / Alaska Native
- 15097.6%Asian
- 31976.8%Other race
- 56898.5%Two or more races
- 5,59589.6%White alone, not Hispanic / Latino
- 78577.2%Hispanic or Latino
-
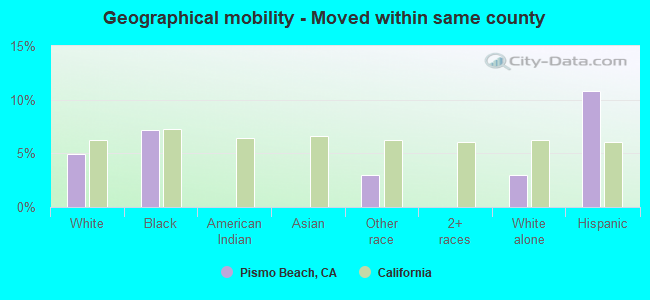
- Moved within same county
- 2864.9%White / Caucasian
- 167.2%Black or African American
- 123.0%Other race
- 1893.0%White alone, not Hispanic / Latino
- 11010.8%Hispanic or Latino
-
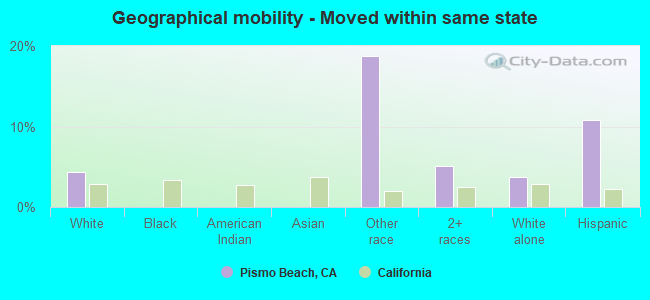
- Moved within same state
- 2554.4%White / Caucasian
- 7818.8%Other race
- 295.1%Two or more races
- 2323.7%White alone, not Hispanic / Latino
- 11010.8%Hispanic or Latino
-
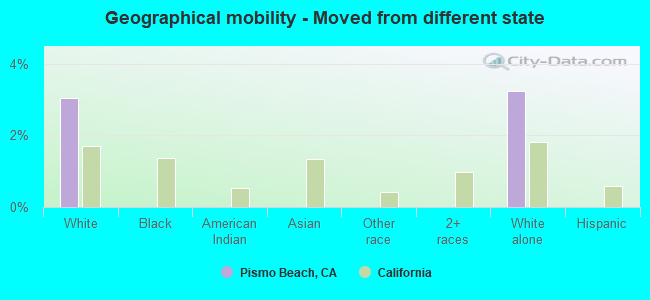
- Moved from different state
- 1783.0%White / Caucasian
- 2023.2%White alone, not Hispanic / Latino
-
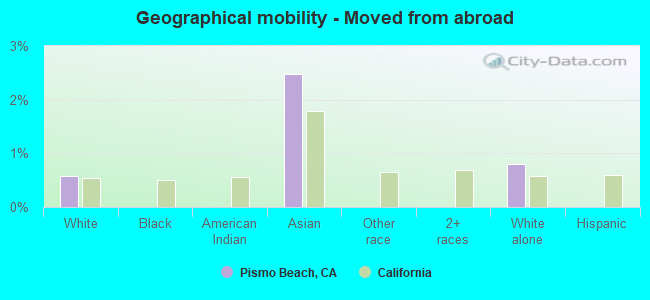
- Moved from abroad
- 340.6%White
- 42.5%Asian
- 500.8%White alone, not Hispanic / Latino
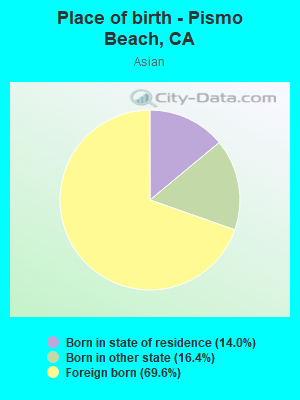
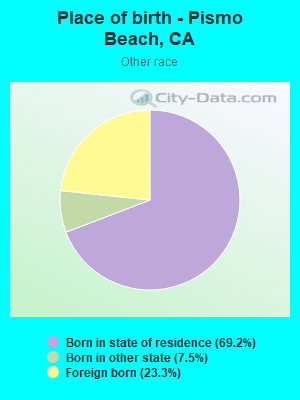
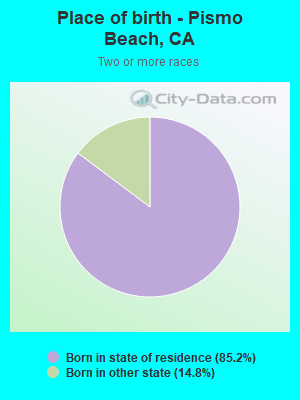
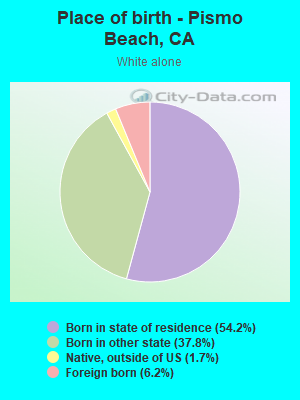
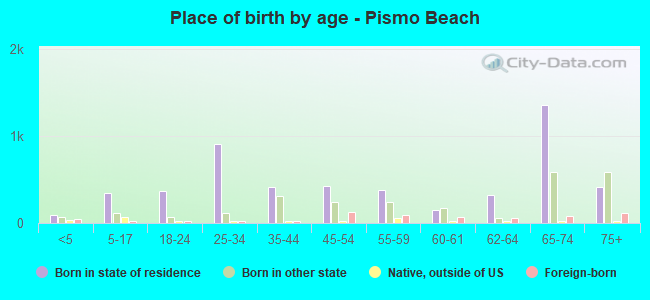
Children Nativity (place of birth) in Pismo Beach
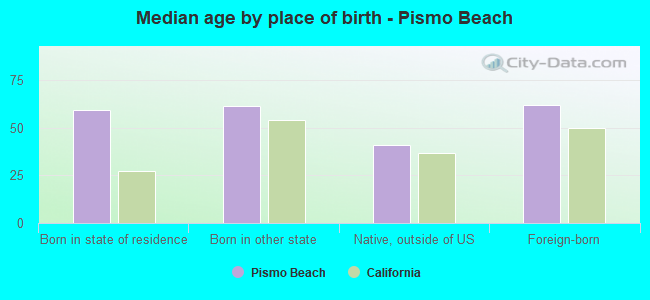
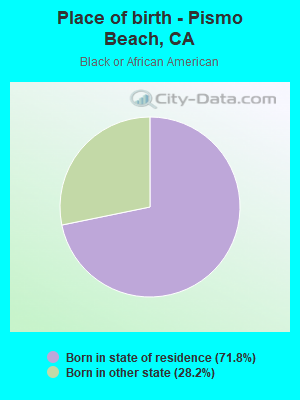
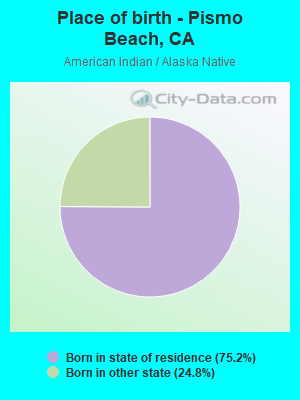
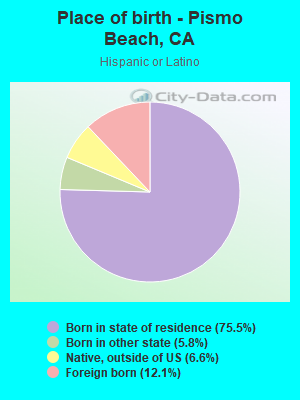
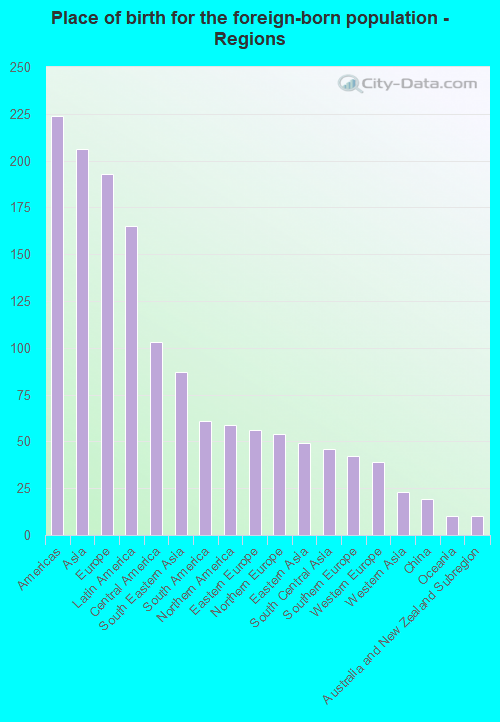
Place of birth for residents in Pismo Beach
![Place of birth for the foreign-born population - Regions]()
- 224Americas
- 206Asia
- 193Europe
- 165Latin America
- 103Central America
- 87South Eastern Asia
- 61South America
- 59Northern America
- 56Eastern Europe
- 54Northern Europe
- 49Eastern Asia
- 46South Central Asia
- 42Southern Europe
- 39Western Europe
- 23Western Asia
- 19China
- 10Oceania
- 10Australia and New Zealand Subregion
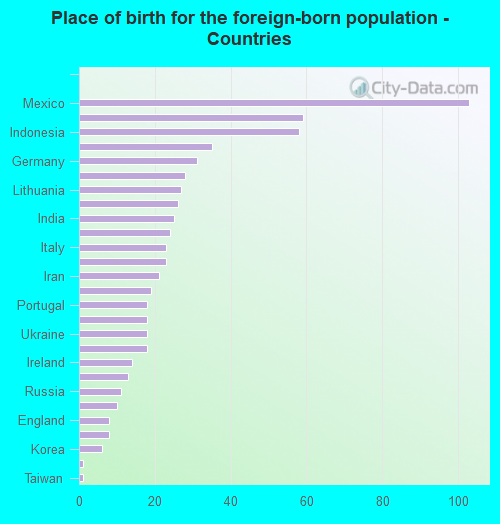
![Place of birth for the foreign-born population - Countries]()
- 103Mexico
- 59Canada
- 58Indonesia
- 35Ecuador
- 31Germany
- 28Cambodia
- 27Lithuania
- 26Colombia
- 25India
- 24Japan
- 23Italy
- 23Lebanon
- 21Iran
- 19United Kingdom
- 18Portugal
- 18Azores Islands
- 18Ukraine
- 18China
- 14Ireland
- 13Scotland
- 11Russia
- 10Australia
- 8England
- 8Belgium
- 6Korea
- 1Spain
- 1Taiwan
Grandparents responsible for own grandchildren in Pismo Beach
Zip codes: 93449.